| Name
|
Size
|
Creator |
Creation Date
|
Last Modification Date
|
Labels |
Attached To |
|
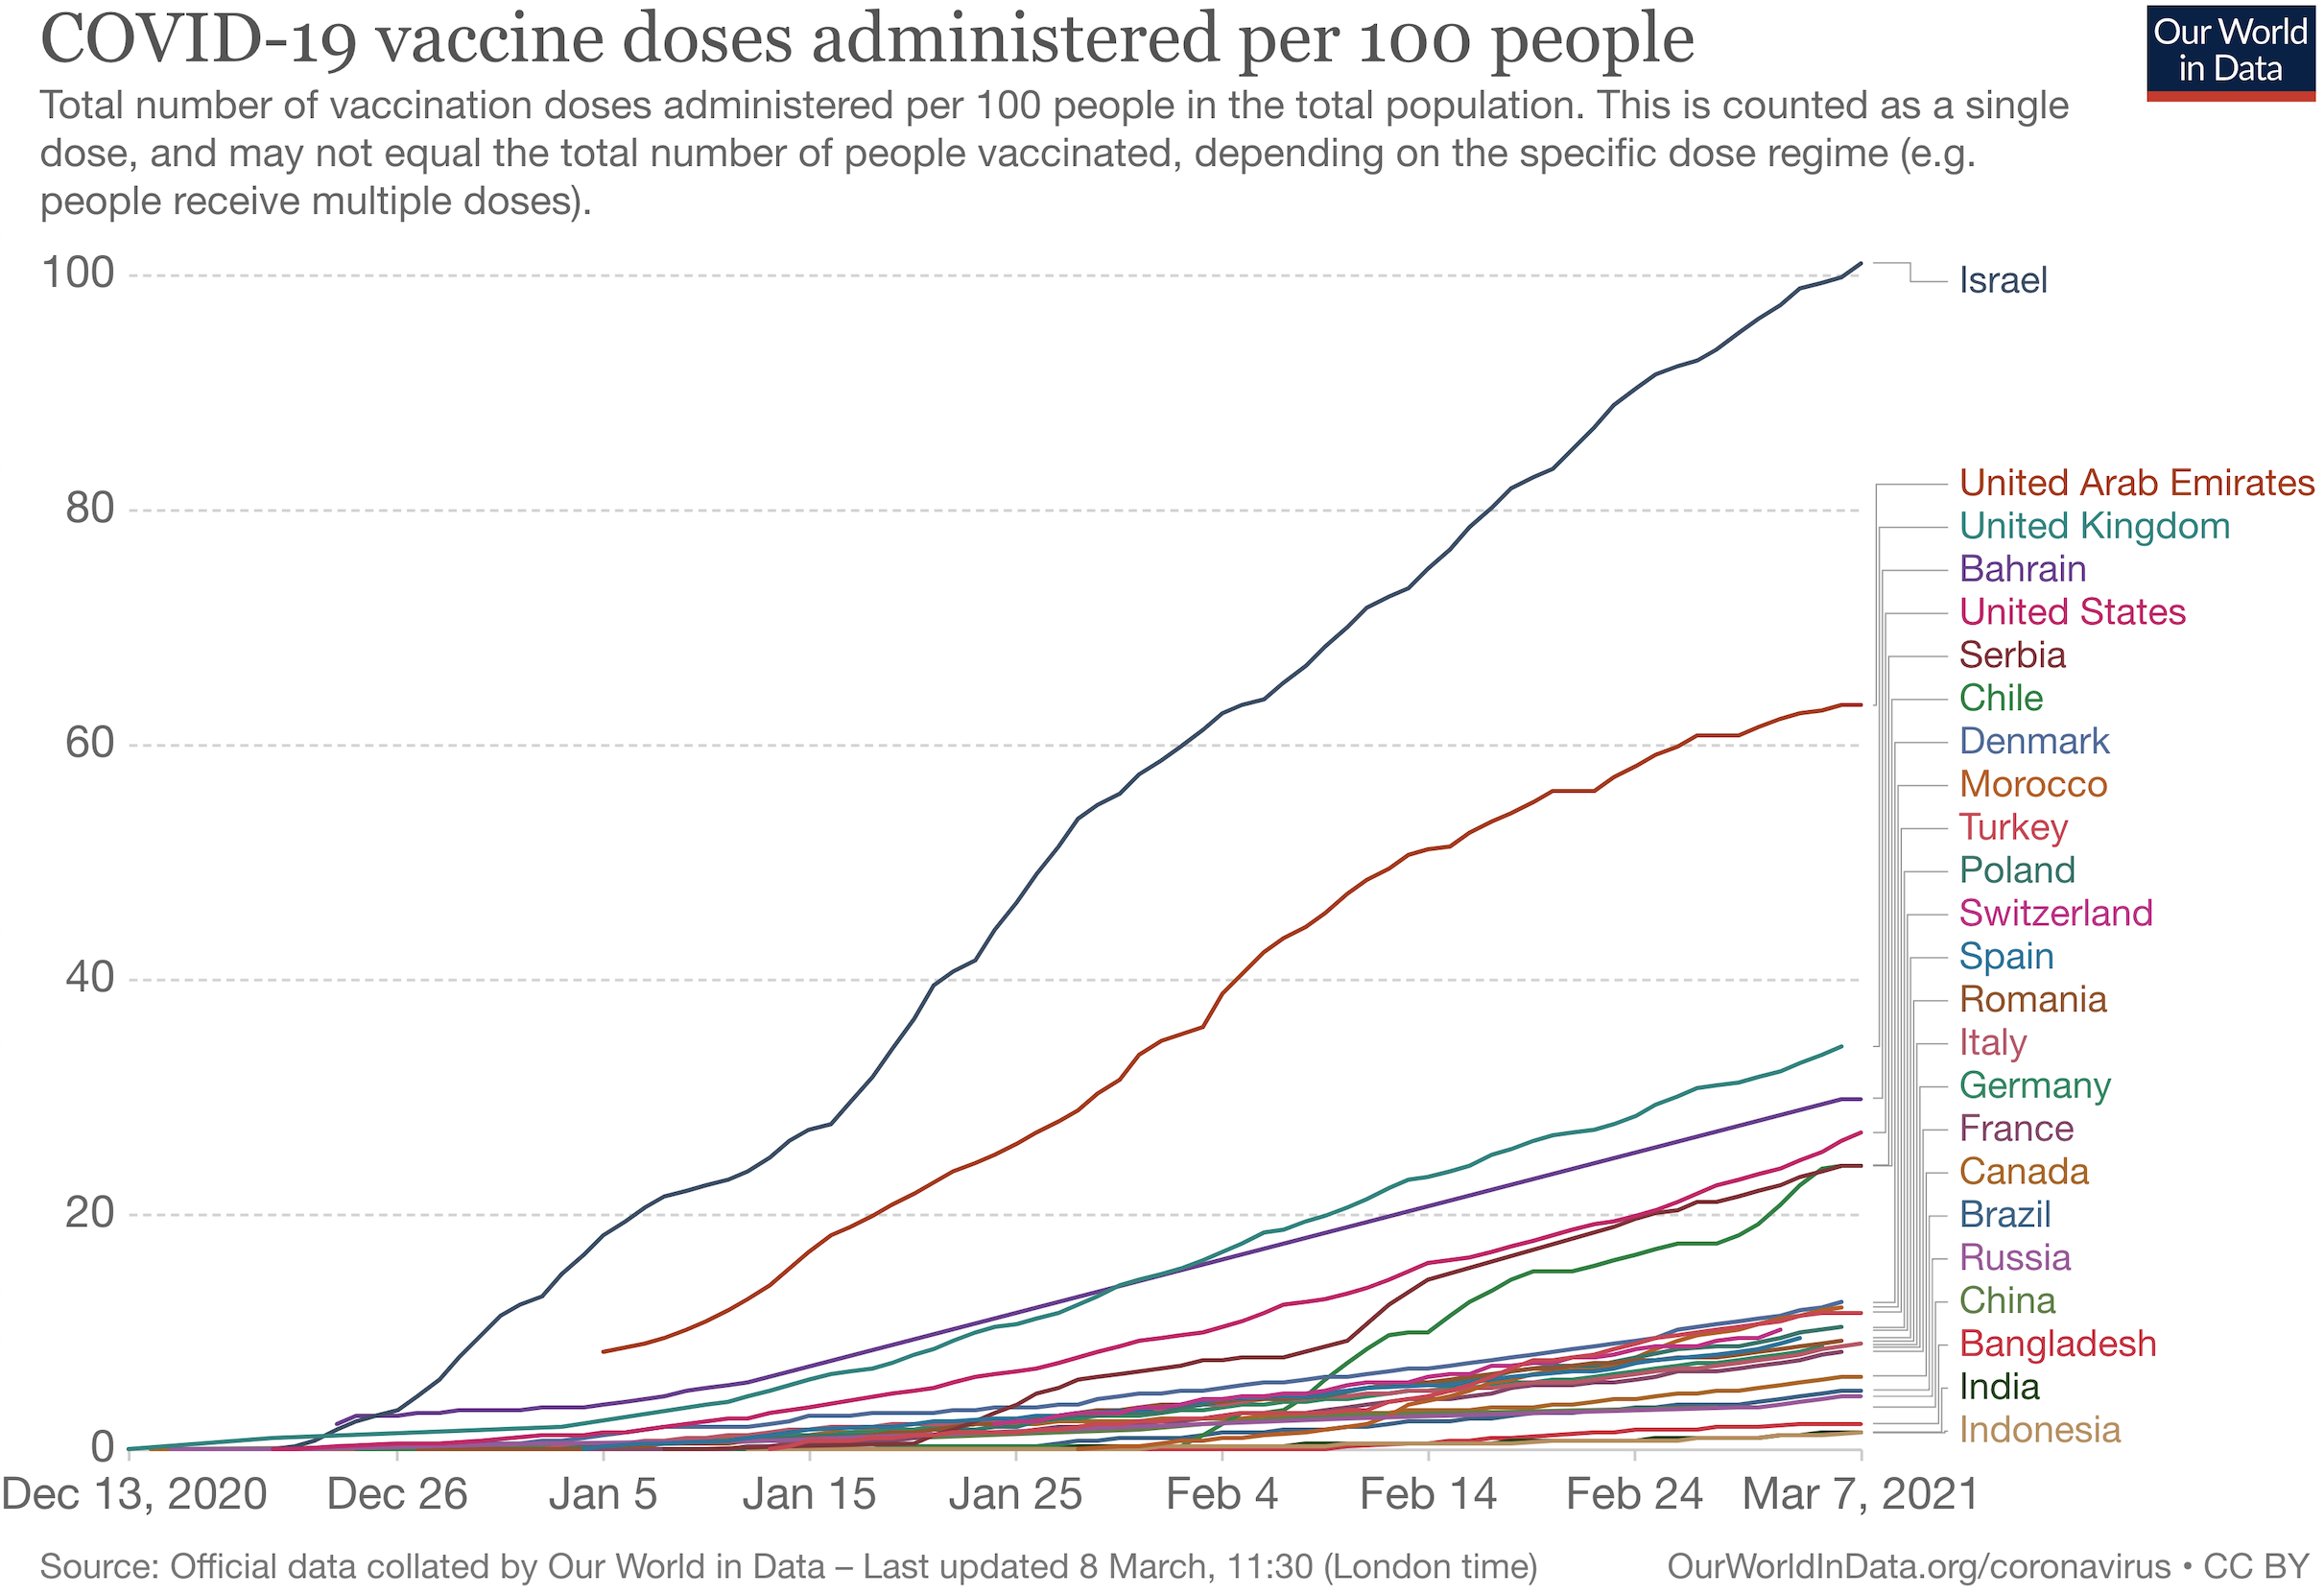
PNG File Screen Shot 2021-03-08 at 2.38.04 PM.png |
1023 kB |
Les Cottrell |
Mar 08, 2021 14:39 |
Mar 08, 2021 14:39 |
|
Page: Covid-19 March 7 Leading countries by number of vaccinations per capita
|
|
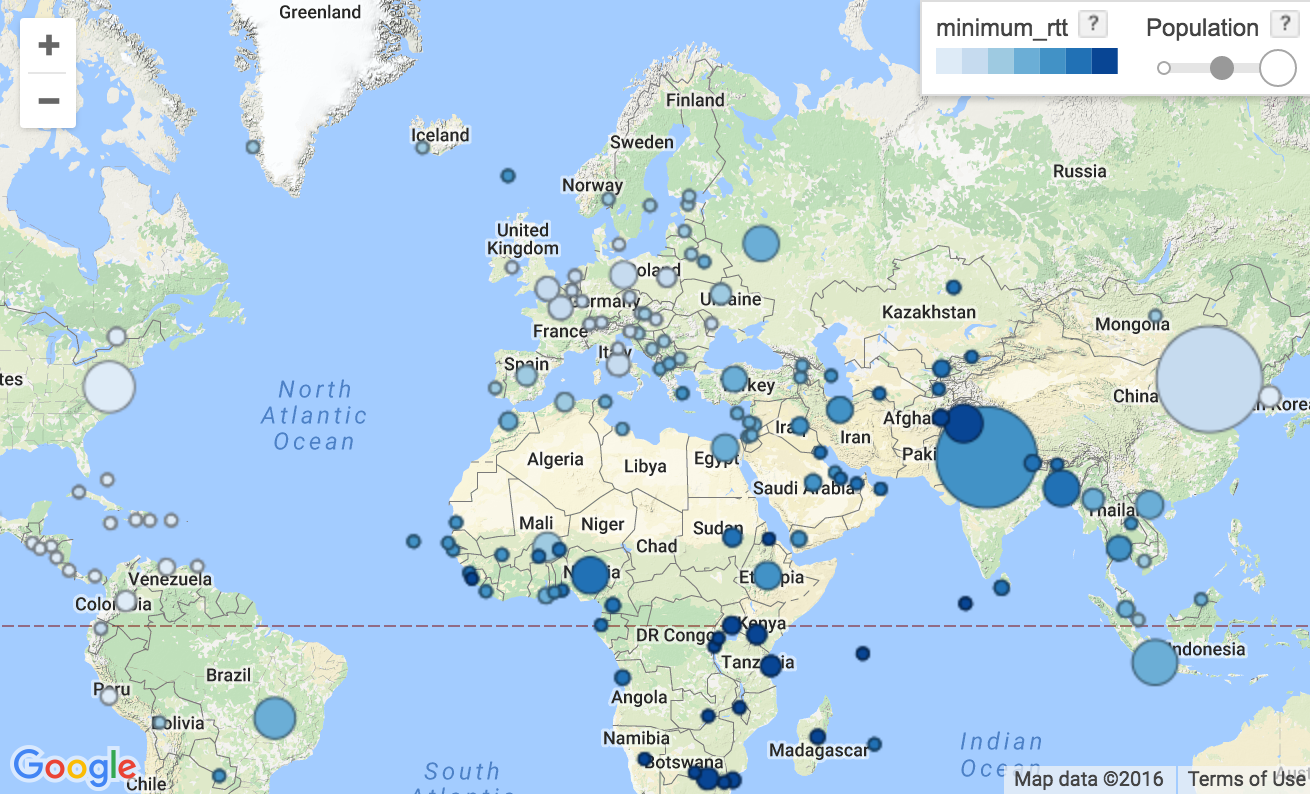
PNG File Screen Shot 2016-08-04 at 9.14.39 PM.png |
1017 kB |
Les Cottrell |
Aug 04, 2016 21:17 |
Aug 04, 2016 21:17 |
|
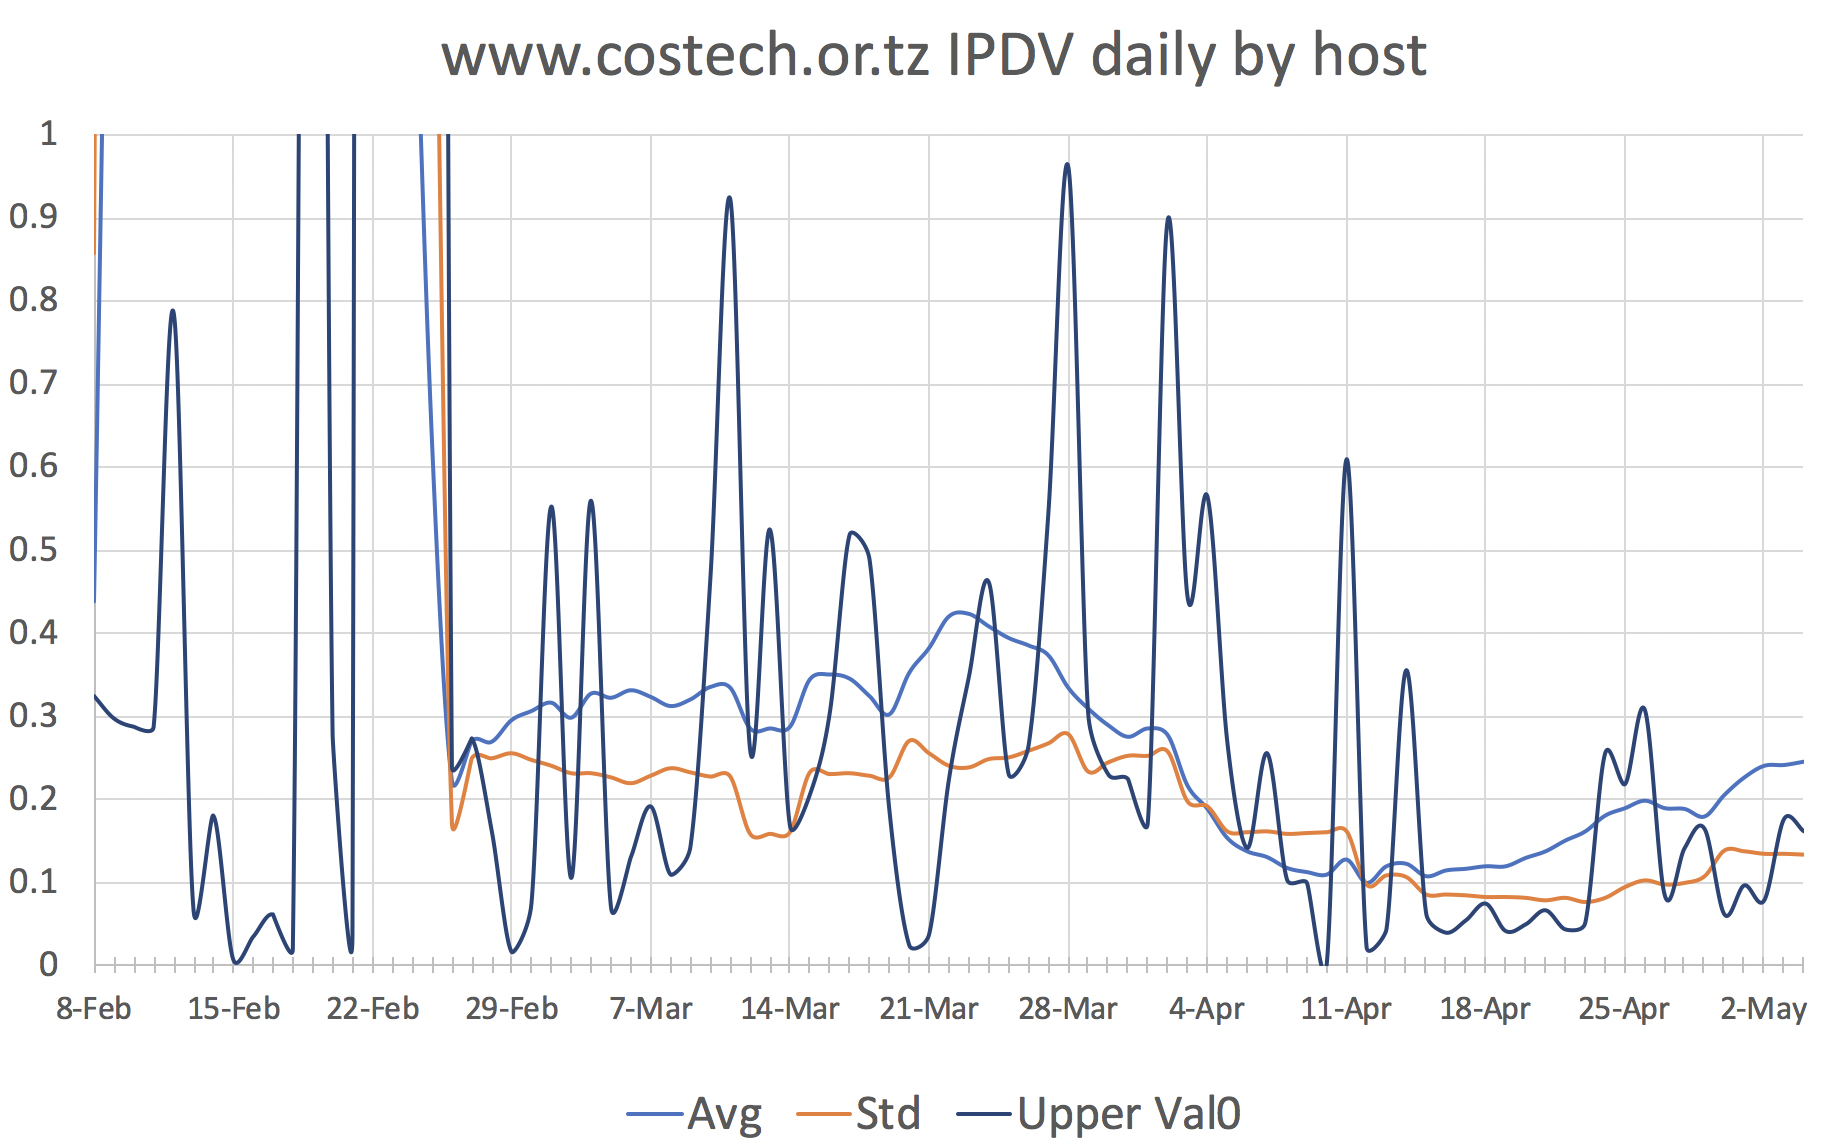
Page: Visualizing PingER data
|
|
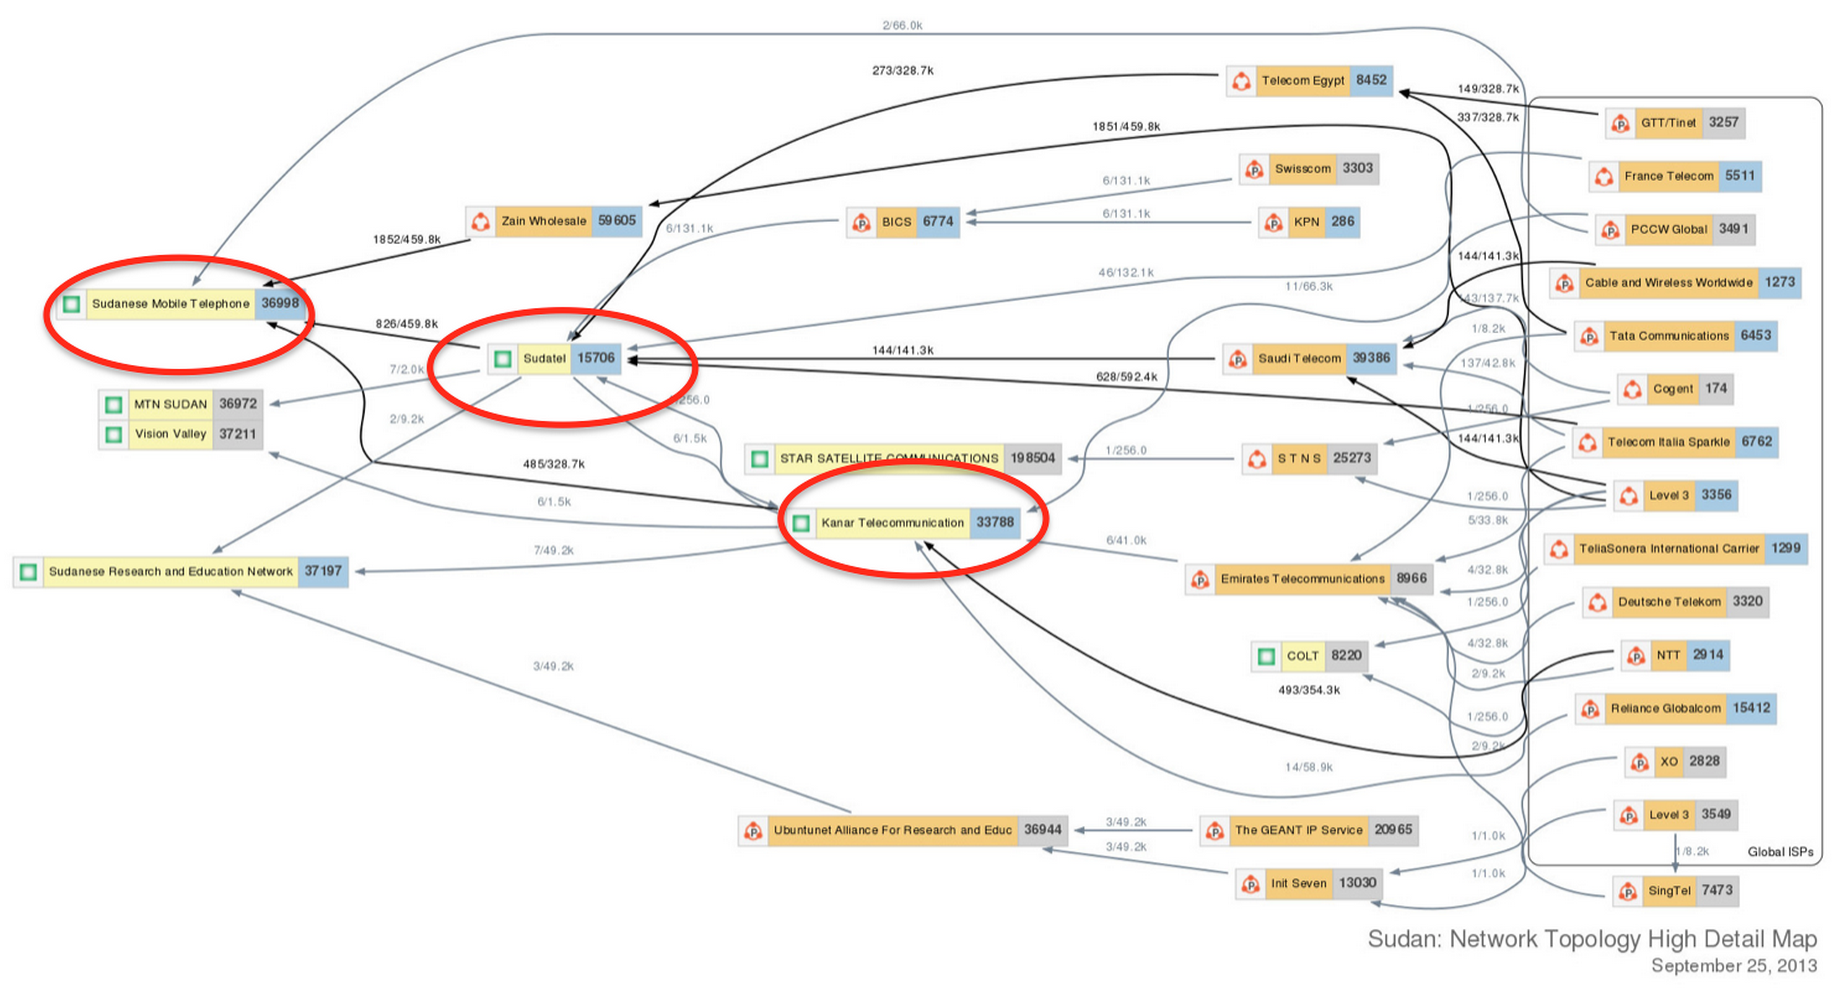
PNG File Screen Shot 2013-09-25 at 8.22.25 PM.png |
1017 kB |
Les Cottrell |
Sep 25, 2013 20:26 |
Sep 25, 2013 20:26 |
|
Page: Sudan disconnected from the Internet Sep 2013.
|
|
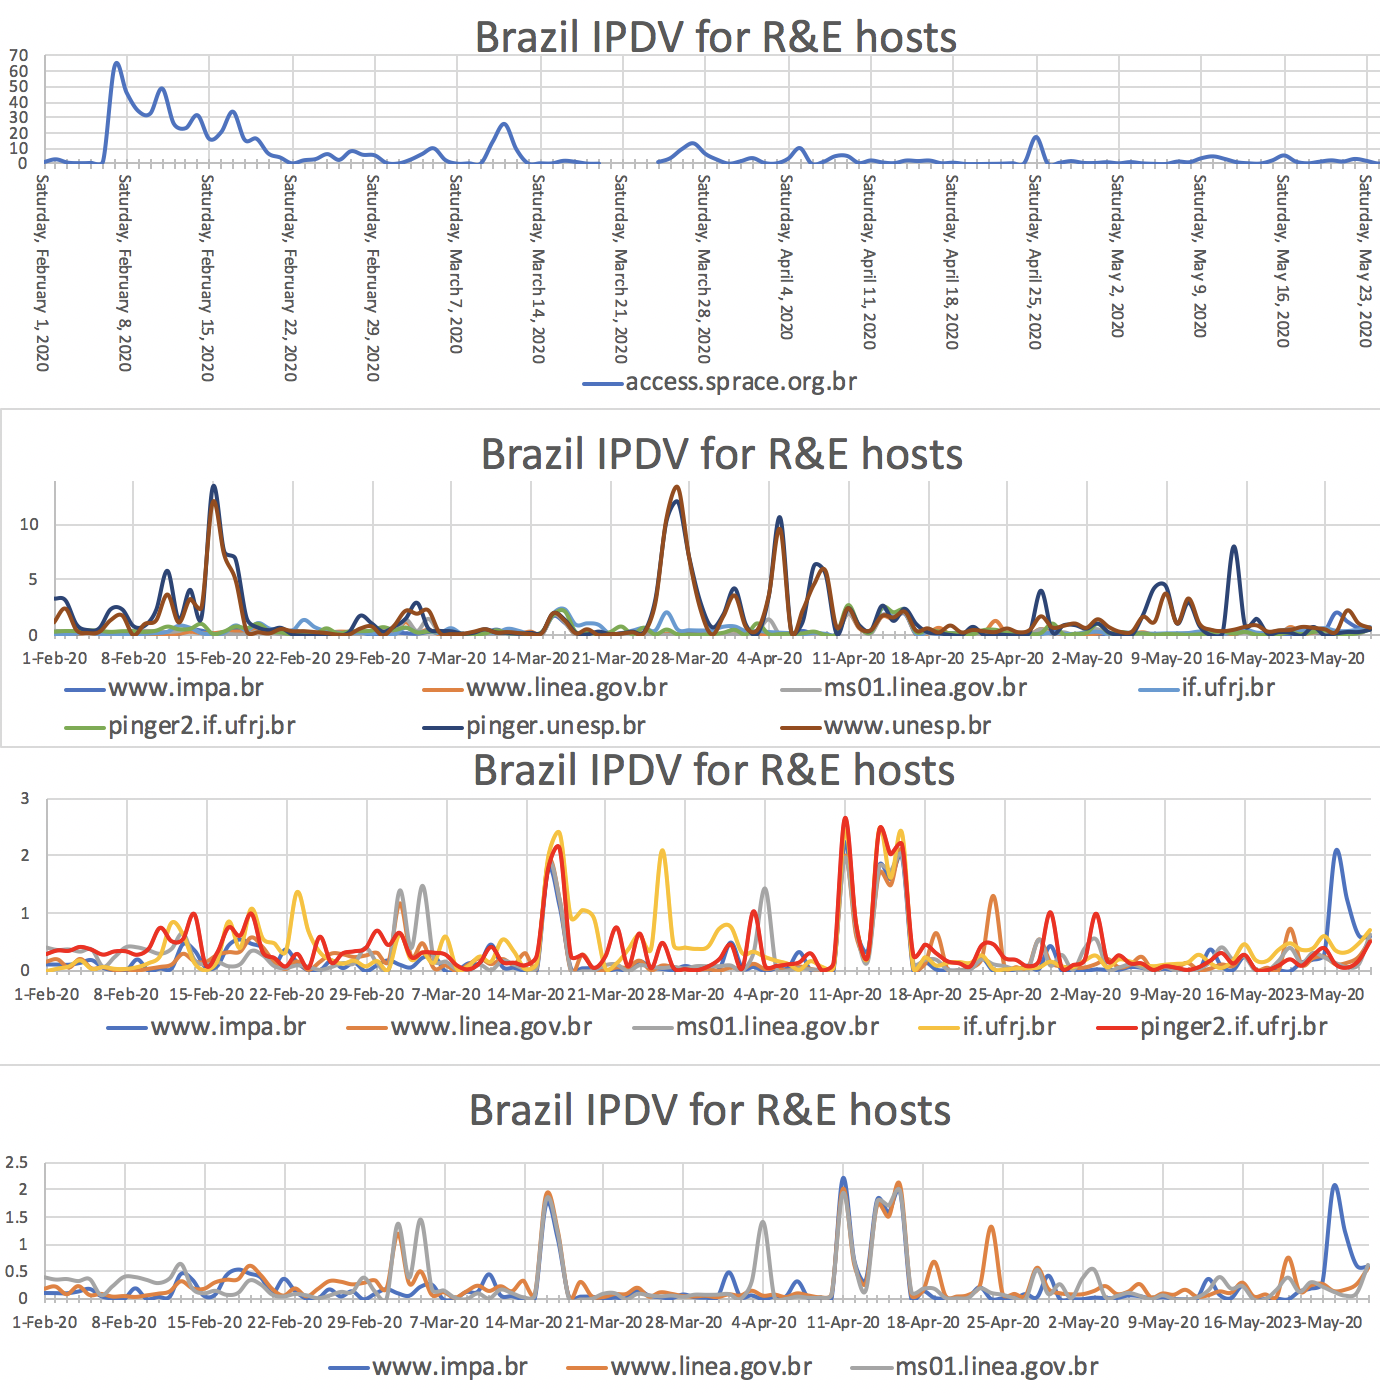
PNG File Screen Shot 2020-05-28 at 1.53.07 PM.png |
1016 kB |
Les Cottrell |
May 28, 2020 13:54 |
May 28, 2020 13:54 |
|
Page: PingER and Covid-15 and South America
|
|
PNG File Screen Shot 2021-03-29 at 8.57.53 AM.png |
1009 kB |
Les Cottrell |
Mar 29, 2021 08:59 |
Mar 29, 2021 09:02 |
|
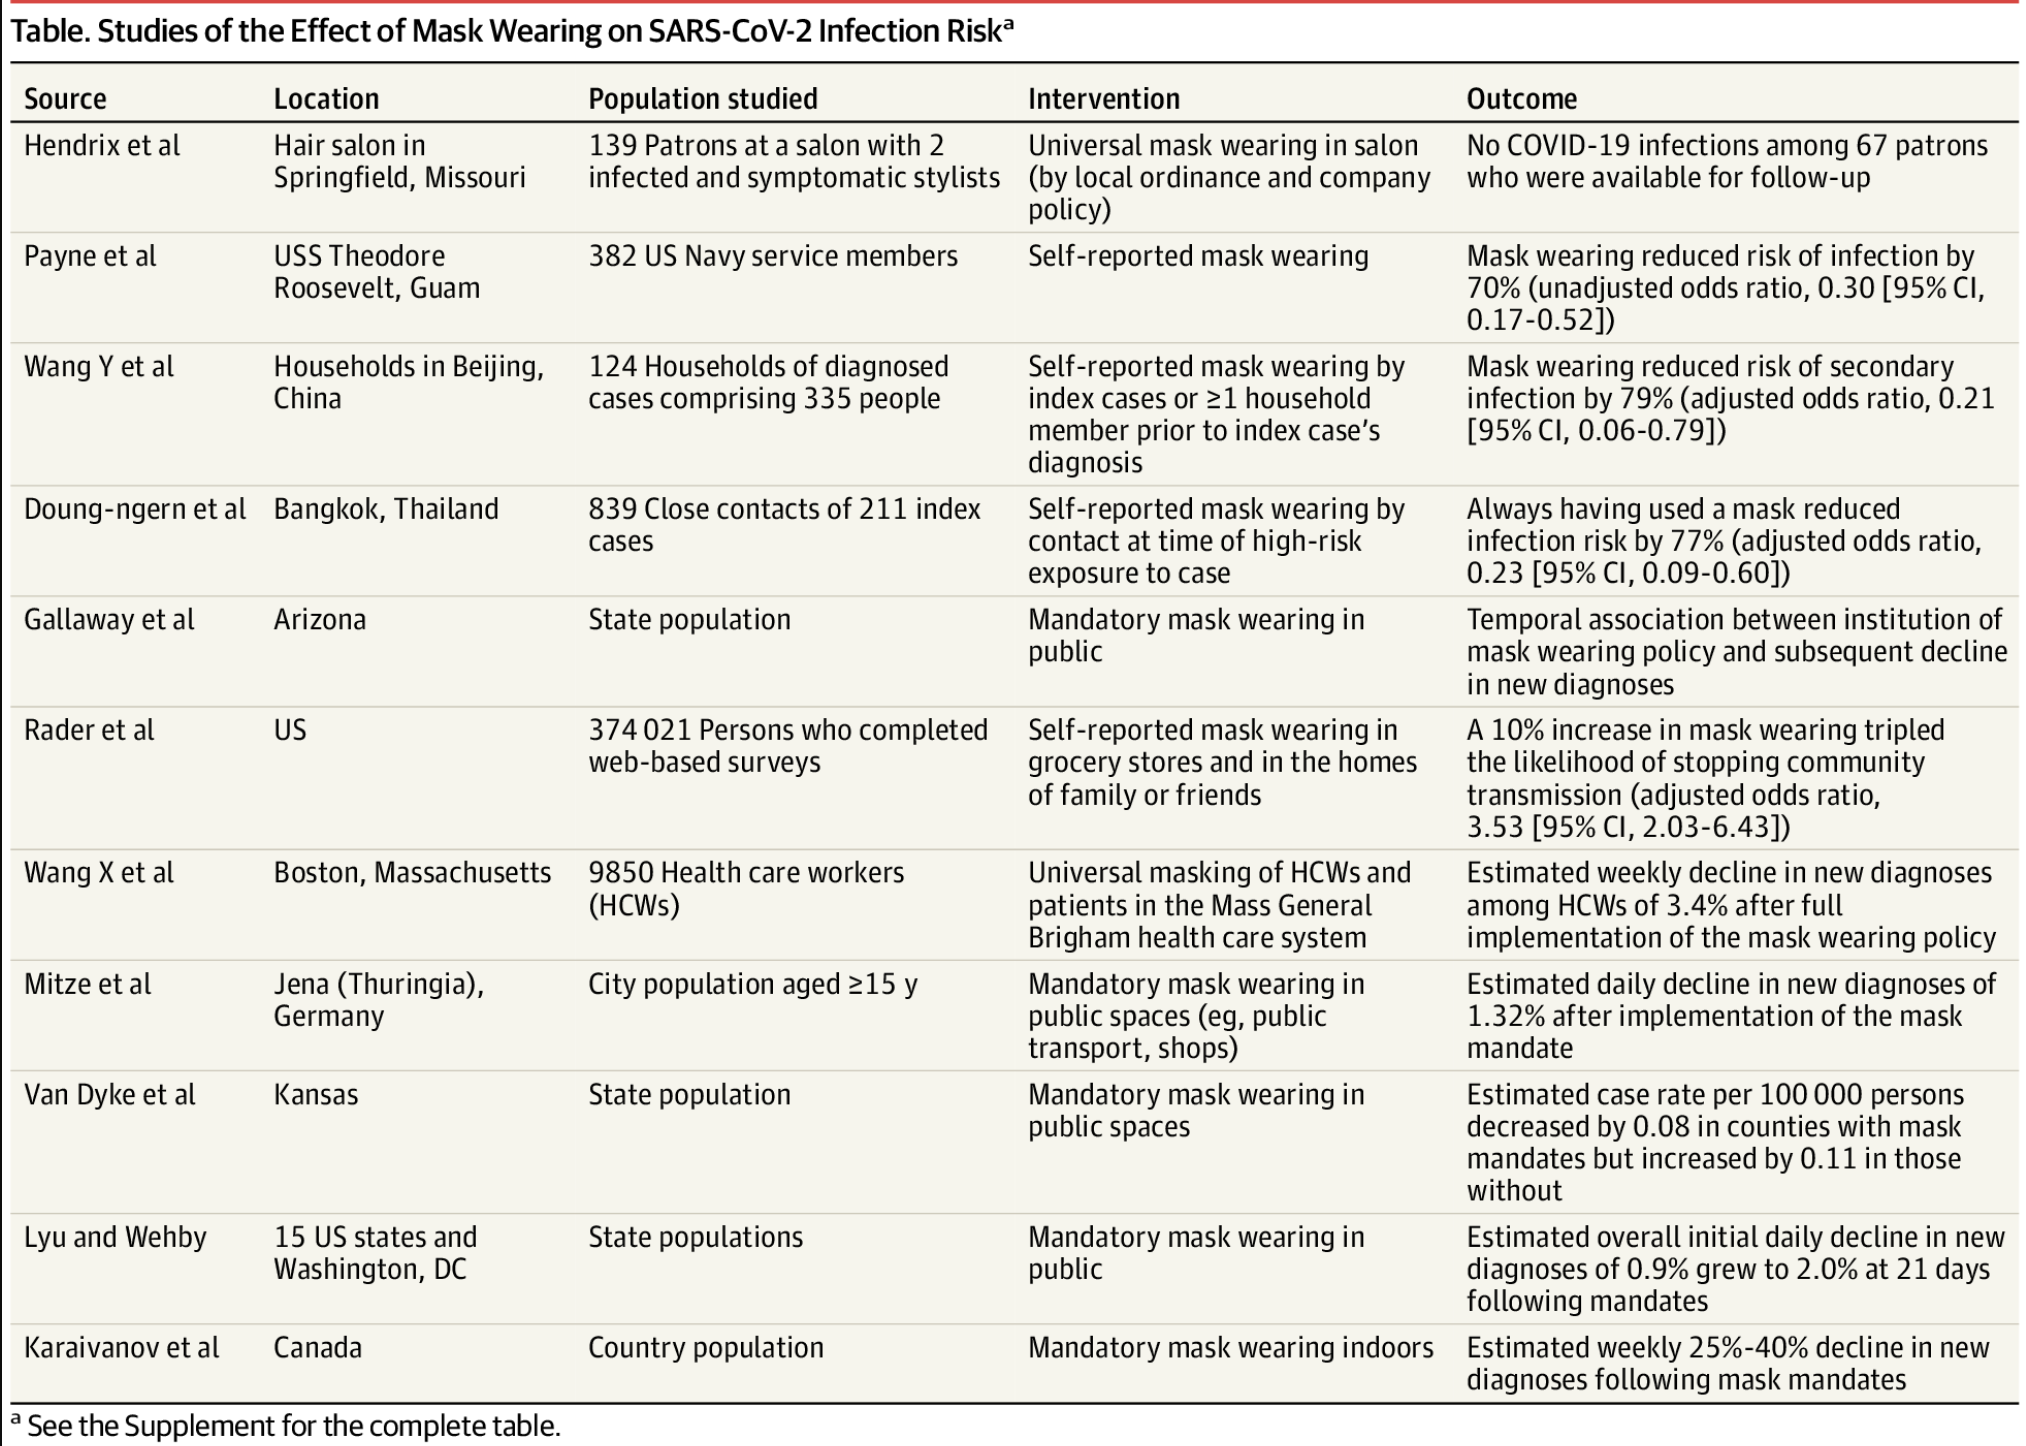
Page: Covid-19 Papers
|
|
PDF File trustcom2018-saqibali.pdf |
1008 kB |
Les Cottrell |
Feb 14, 2019 18:30 |
Feb 14, 2019 18:30 |
|
Page: PingER Papers and Presentations
|
|
PNG File Screen Shot 2022-03-02 at 9.05.38 PM.png |
1004 kB |
Les Cottrell |
Mar 02, 2022 21:10 |
Mar 02, 2022 21:10 |
|
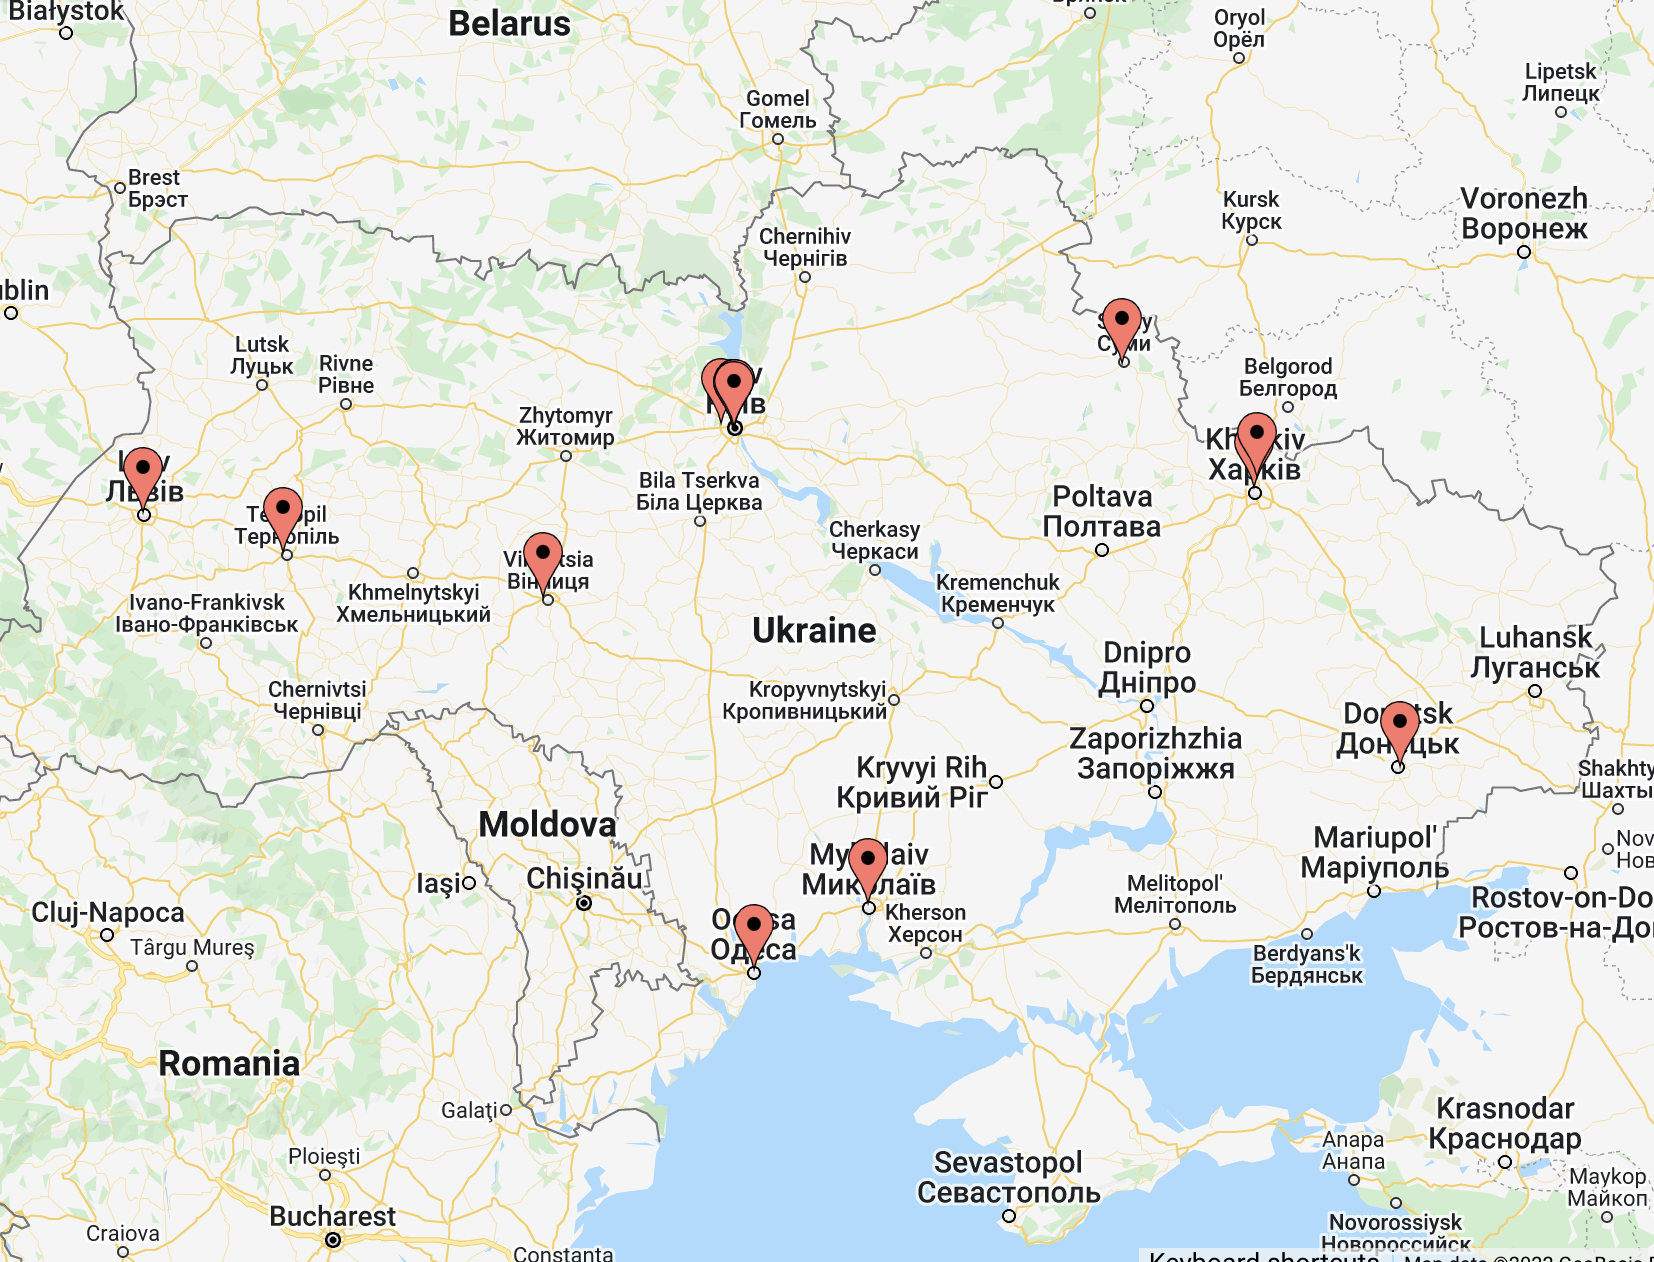
Page: Impact of the Russo Ukraine war on ping response times
|
|
PDF File 2012-slac-worldmap-boxplot.pdf |
1002 kB |
Les Cottrell |
Jul 13, 2013 09:39 |
Jul 13, 2013 09:39 |
|
Page: Box plot of RTT on World map
|
|
Microsoft Powerpoint Presentation A Survey On Big Data Indexing Strategies.pptx |
992 kB |
Les Cottrell |
Jan 19, 2016 08:59 |
Jan 19, 2016 08:59 |
|
Page: PingER Papers and Presentations
|
|
PNG File Screen Shot 2020-01-29 at 1.45.31 PM.png |
989 kB |
Les Cottrell |
Jan 29, 2020 13:46 |
Jan 29, 2020 13:46 |
|
Page: South Africa damage to the SAT-3 and WACS undersea cable Jan 16 2020
|
|
PNG File Screen Shot 2020-11-01 at 2.03.47 PM.png |
985 kB |
Les Cottrell |
Nov 01, 2020 14:07 |
Nov 01, 2020 14:07 |
|
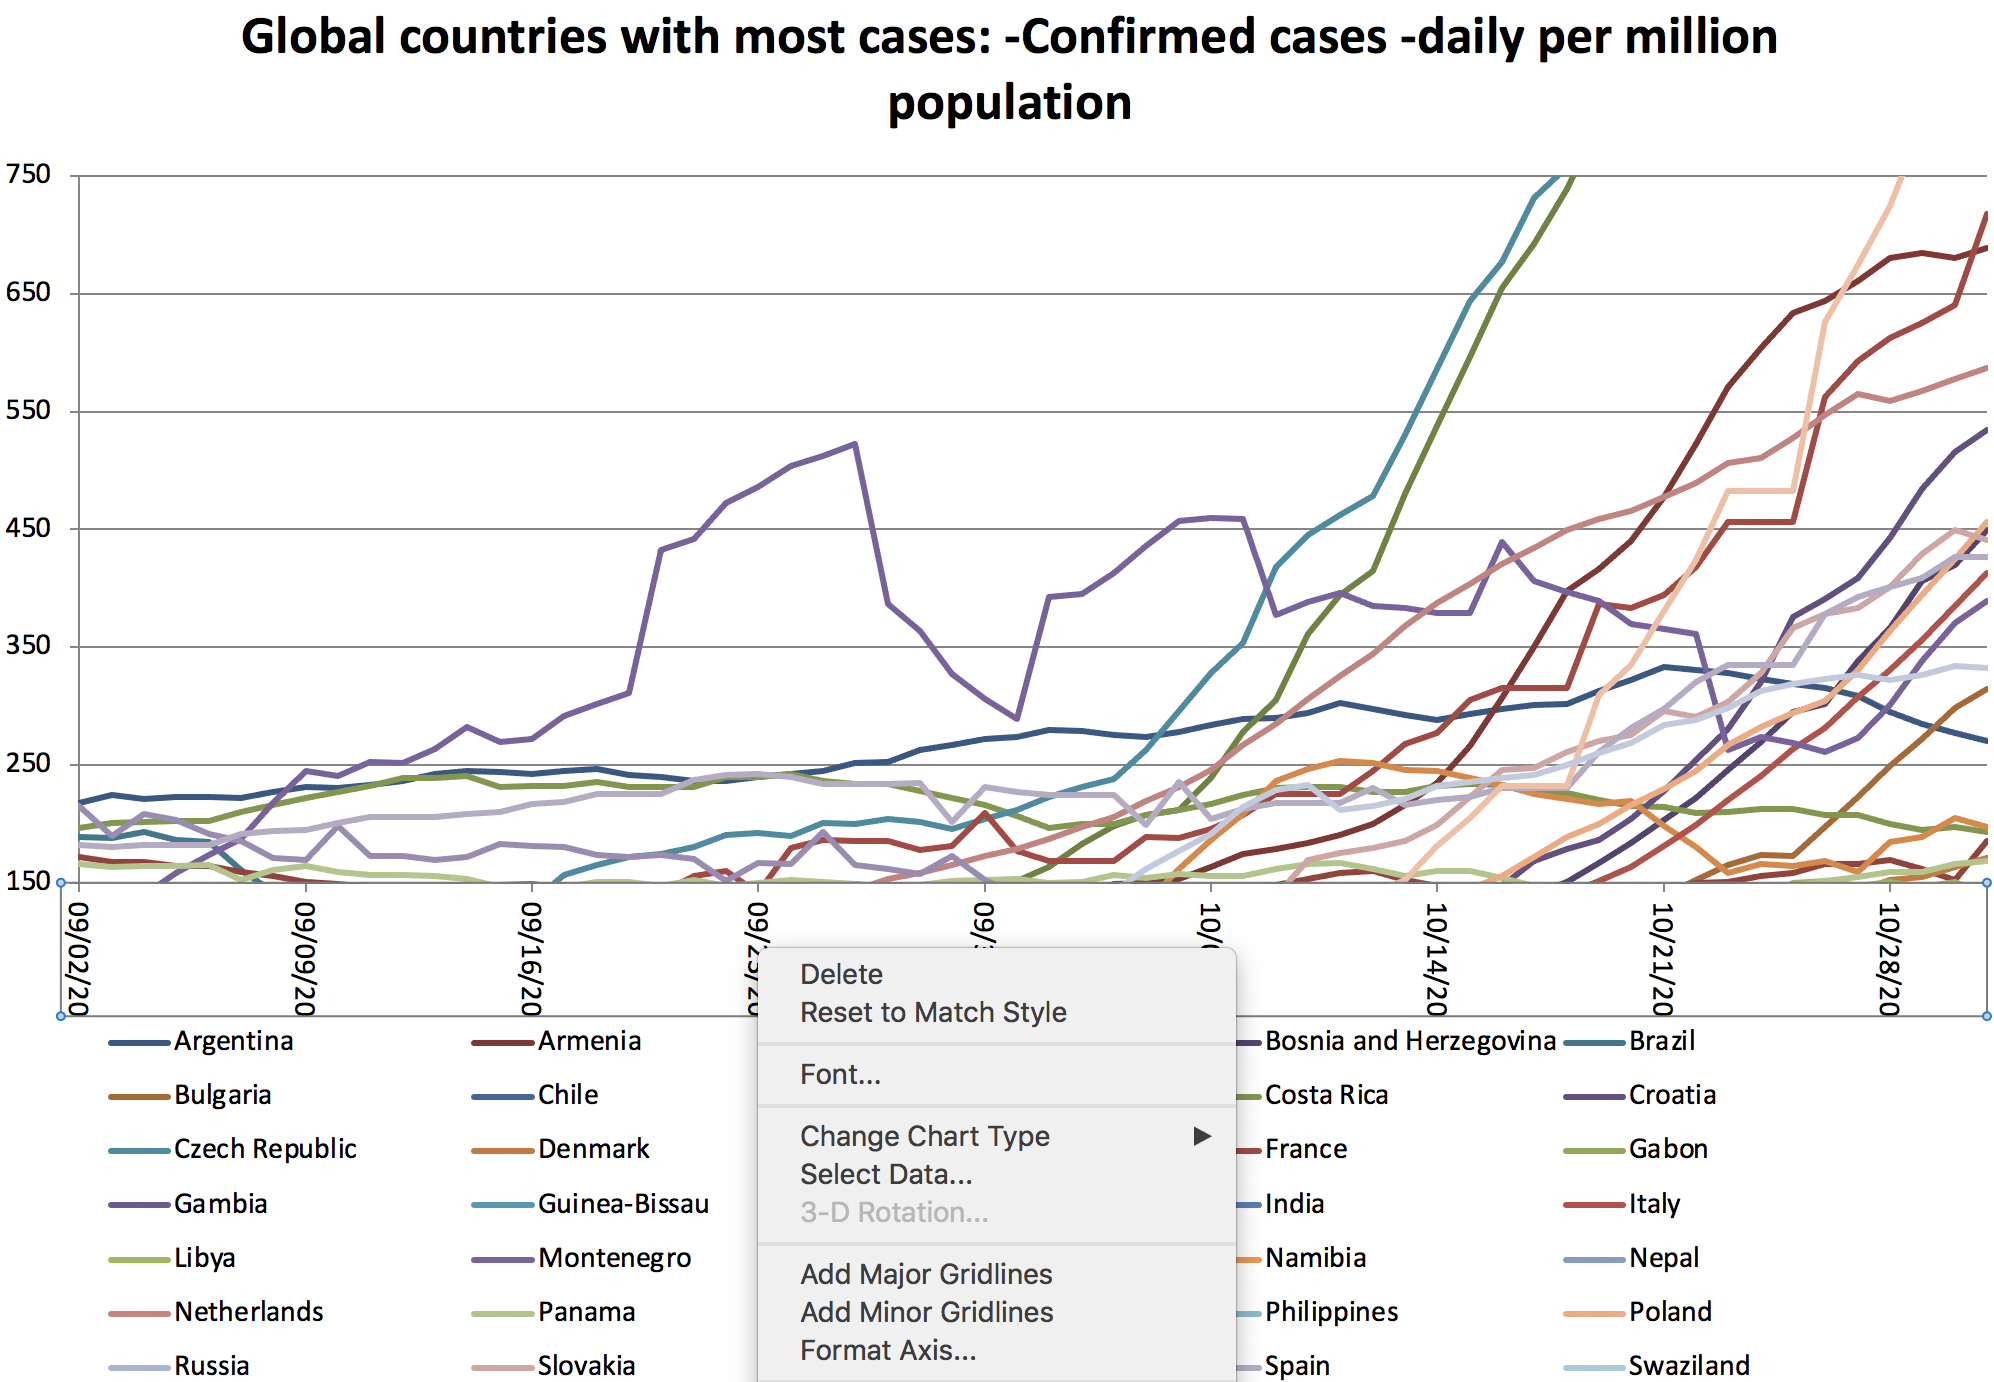
Page: Covid-19 - Visualizing the data with Excel
|
|
PNG File Screen Shot 2020-06-10 at 4.11.22 PM.png |
981 kB |
Les Cottrell |
Jun 10, 2020 16:12 |
Jun 10, 2020 16:12 |
|
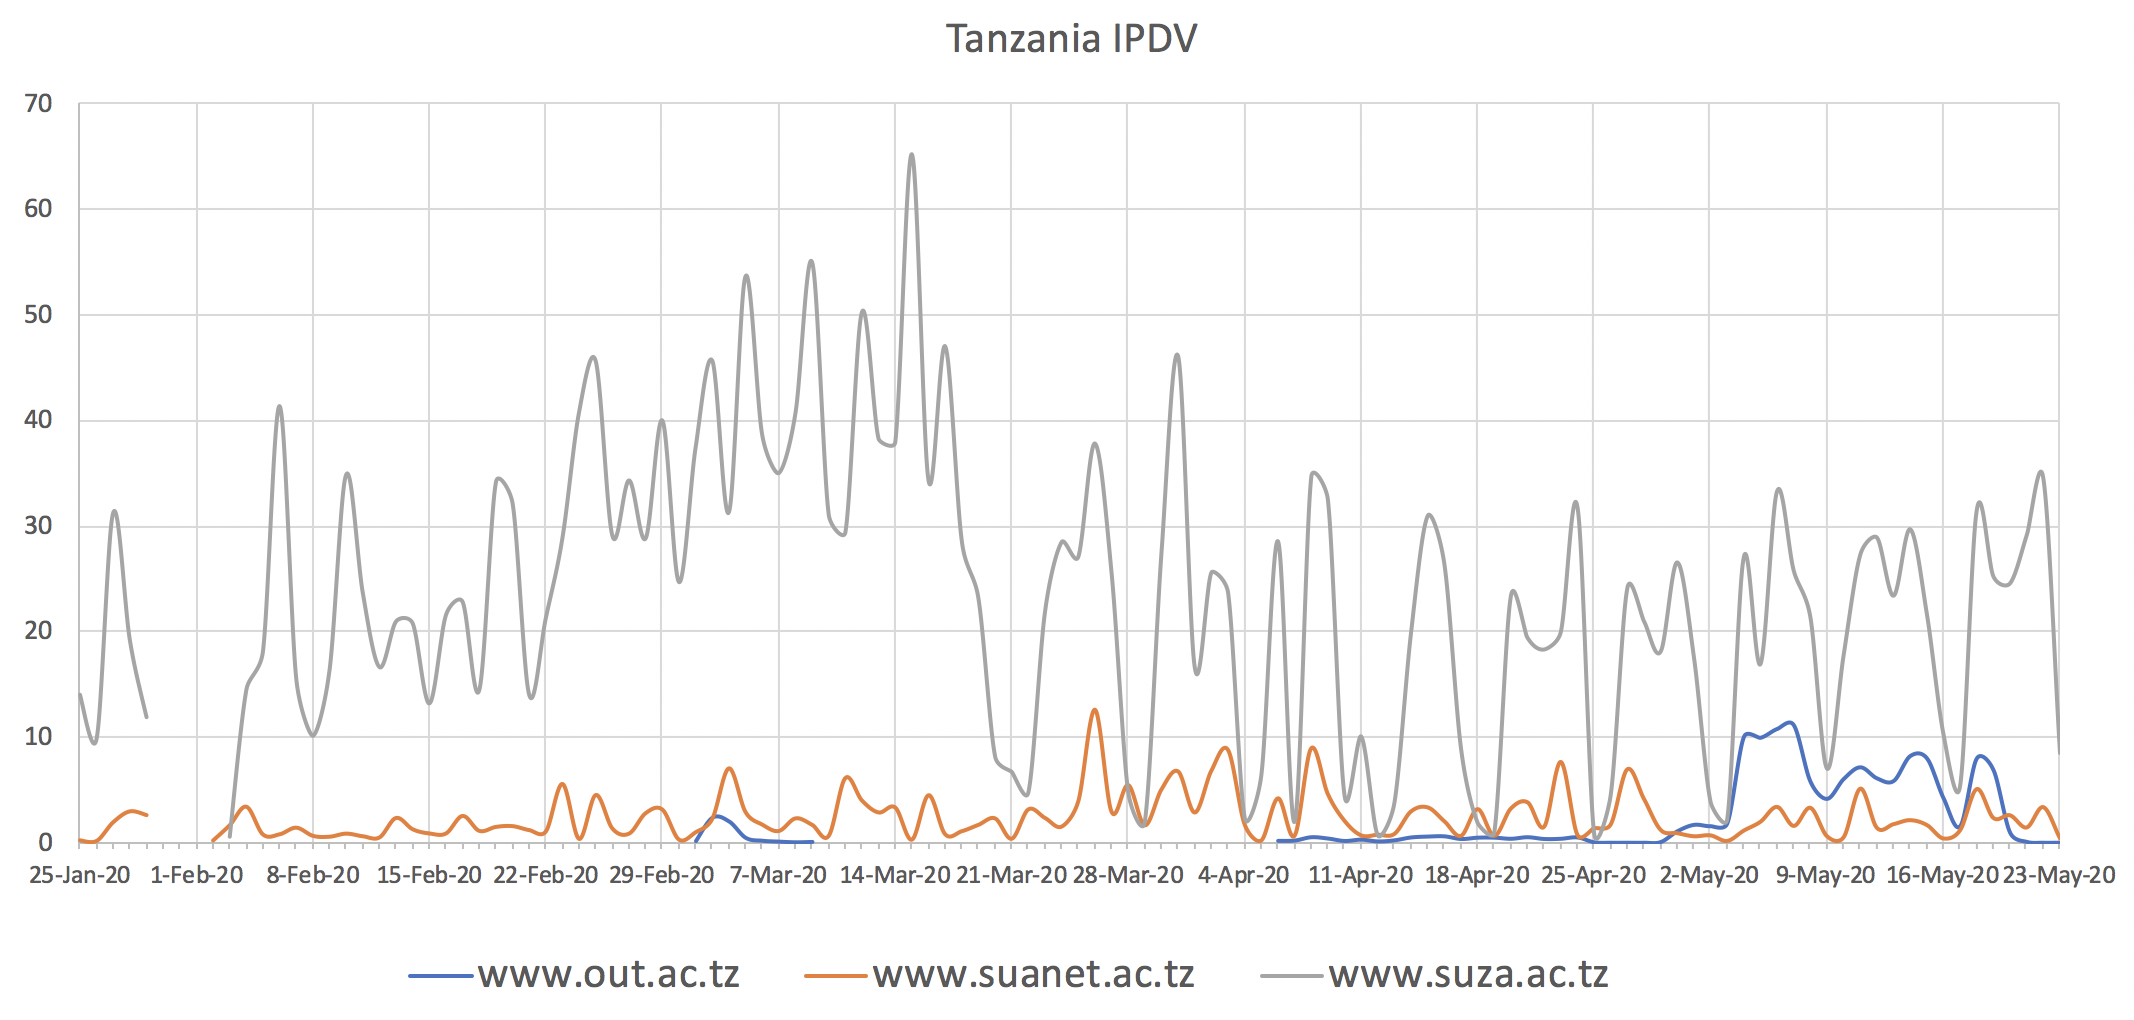
Page: PingER and Covid-19 in East Africa
|
|
Microsoft Powerpoint Presentation gaffney.pptx |
980 kB |
Les Cottrell |
Nov 30, 2015 18:07 |
Nov 30, 2015 18:07 |
|
Page: Papers and Presentations
|
|
PNG File Screen Shot 2020-09-15 at 11.10.23 AM.png |
973 kB |
Les Cottrell |
Sep 15, 2020 11:15 |
Sep 15, 2020 11:15 |
|
Page: Covid-19 US compared to other countries
|
|
PNG File Screen Shot 2020-05-18 at 5.58.33 PM.png |
972 kB |
Les Cottrell |
May 18, 2020 18:00 |
May 18, 2020 18:07 |
|
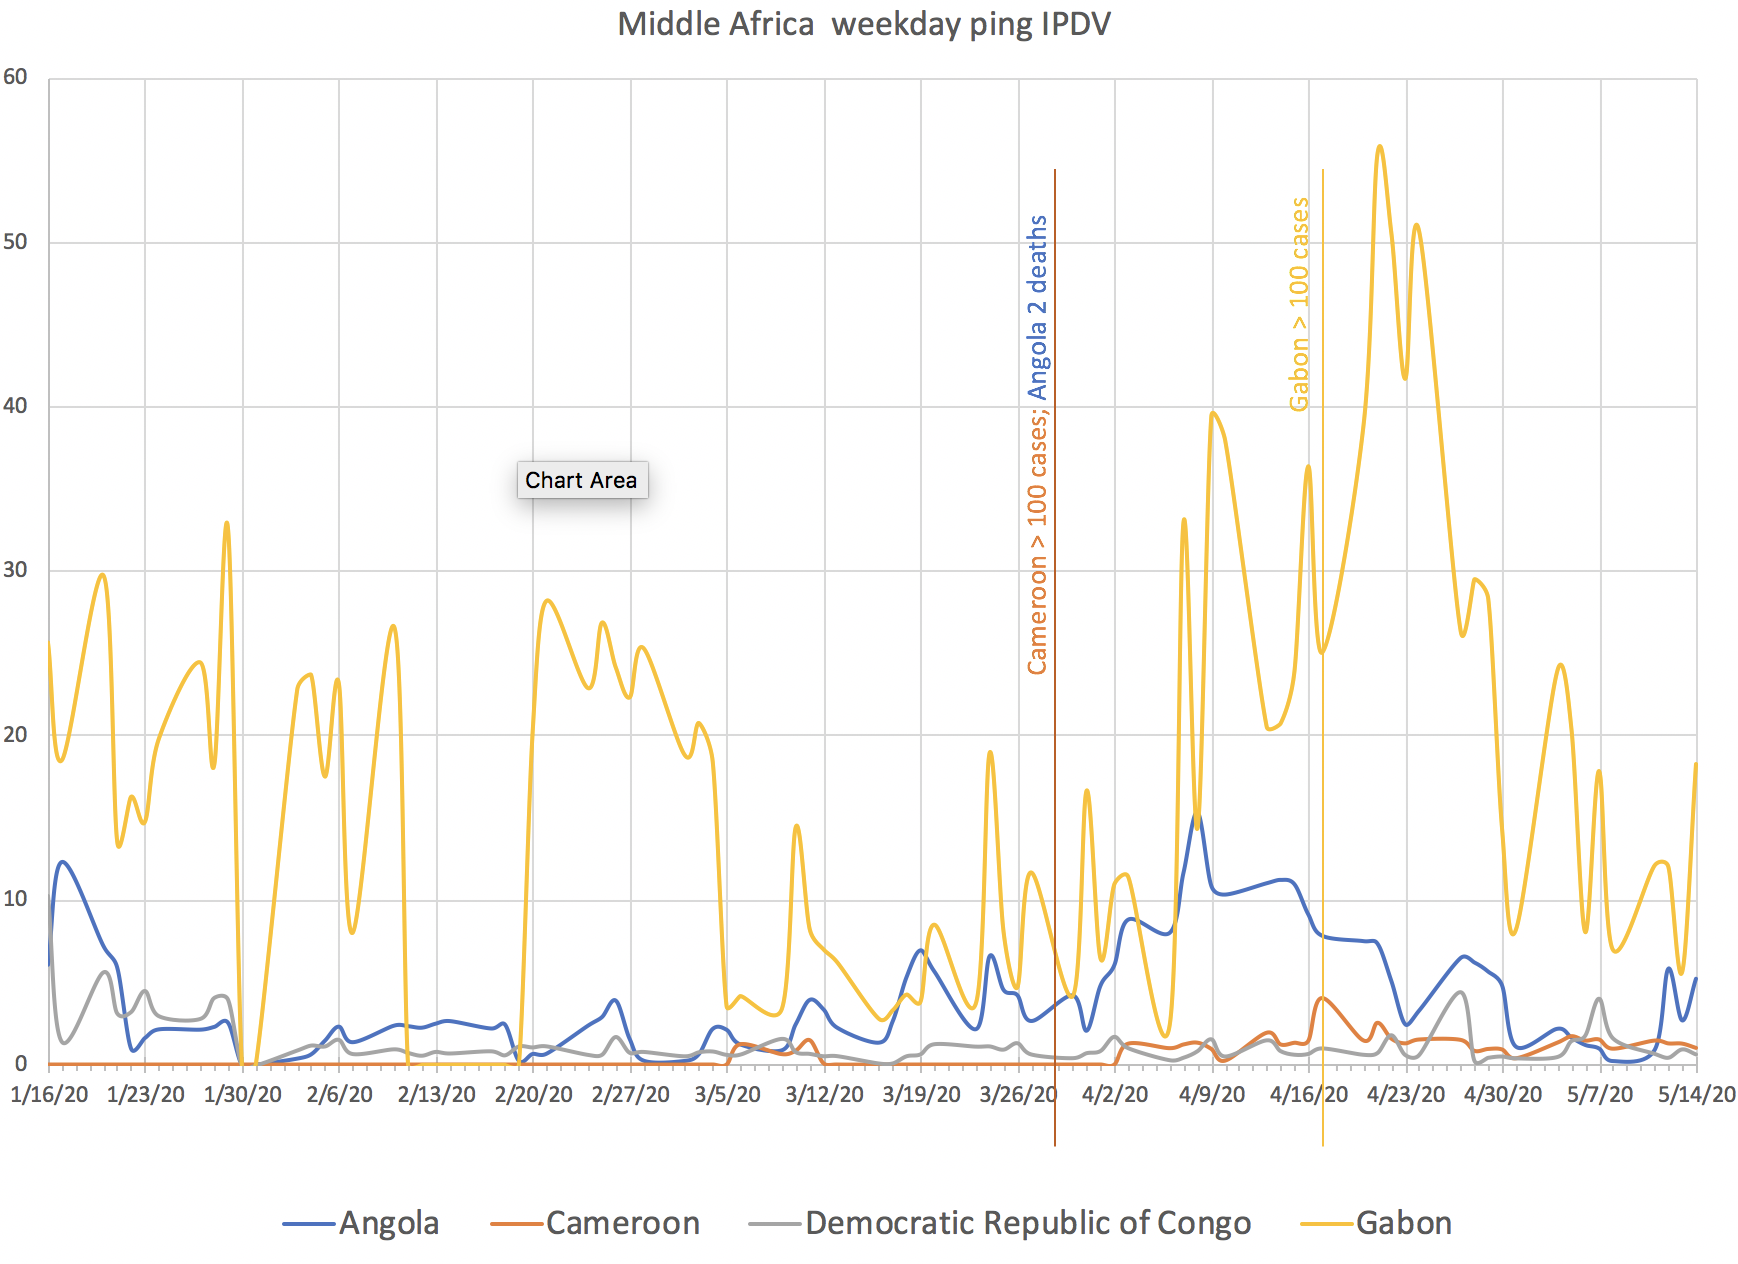
Page: PingER and Covid-19 and Central Africa
|
|
PNG File Screen Shot 2014-02-12 at 7.13.30 PM.png |
969 kB |
Les Cottrell |
Feb 12, 2014 19:16 |
Feb 12, 2014 19:16 |
|
Page: Visual Traceroute (VTrace)
|
|
PNG File Screen Shot 2020-05-24 at 5.01.59 PM.png |
966 kB |
Les Cottrell |
May 24, 2020 17:05 |
May 24, 2020 17:05 |
|
Page: PingER and Covid-19 in East Africa
|
|
PNG File Screen Shot 2020-05-19 at 4.24.02 PM.png |
965 kB |
Les Cottrell |
May 19, 2020 16:25 |
May 19, 2020 16:30 |
|
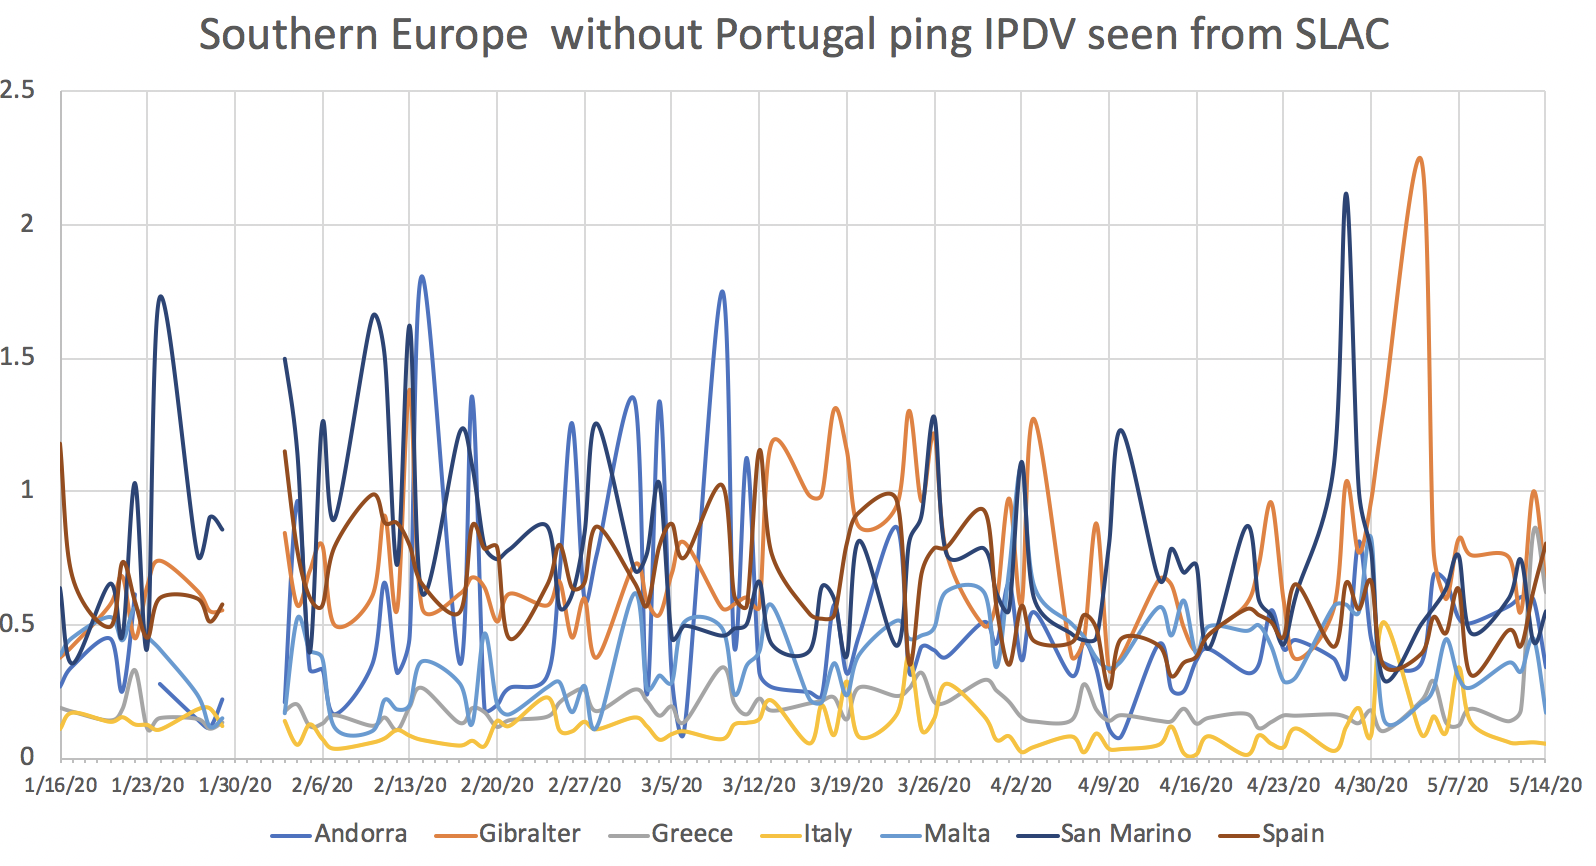
Page: Pinger and Covid-19 for Southern Europe
|
|
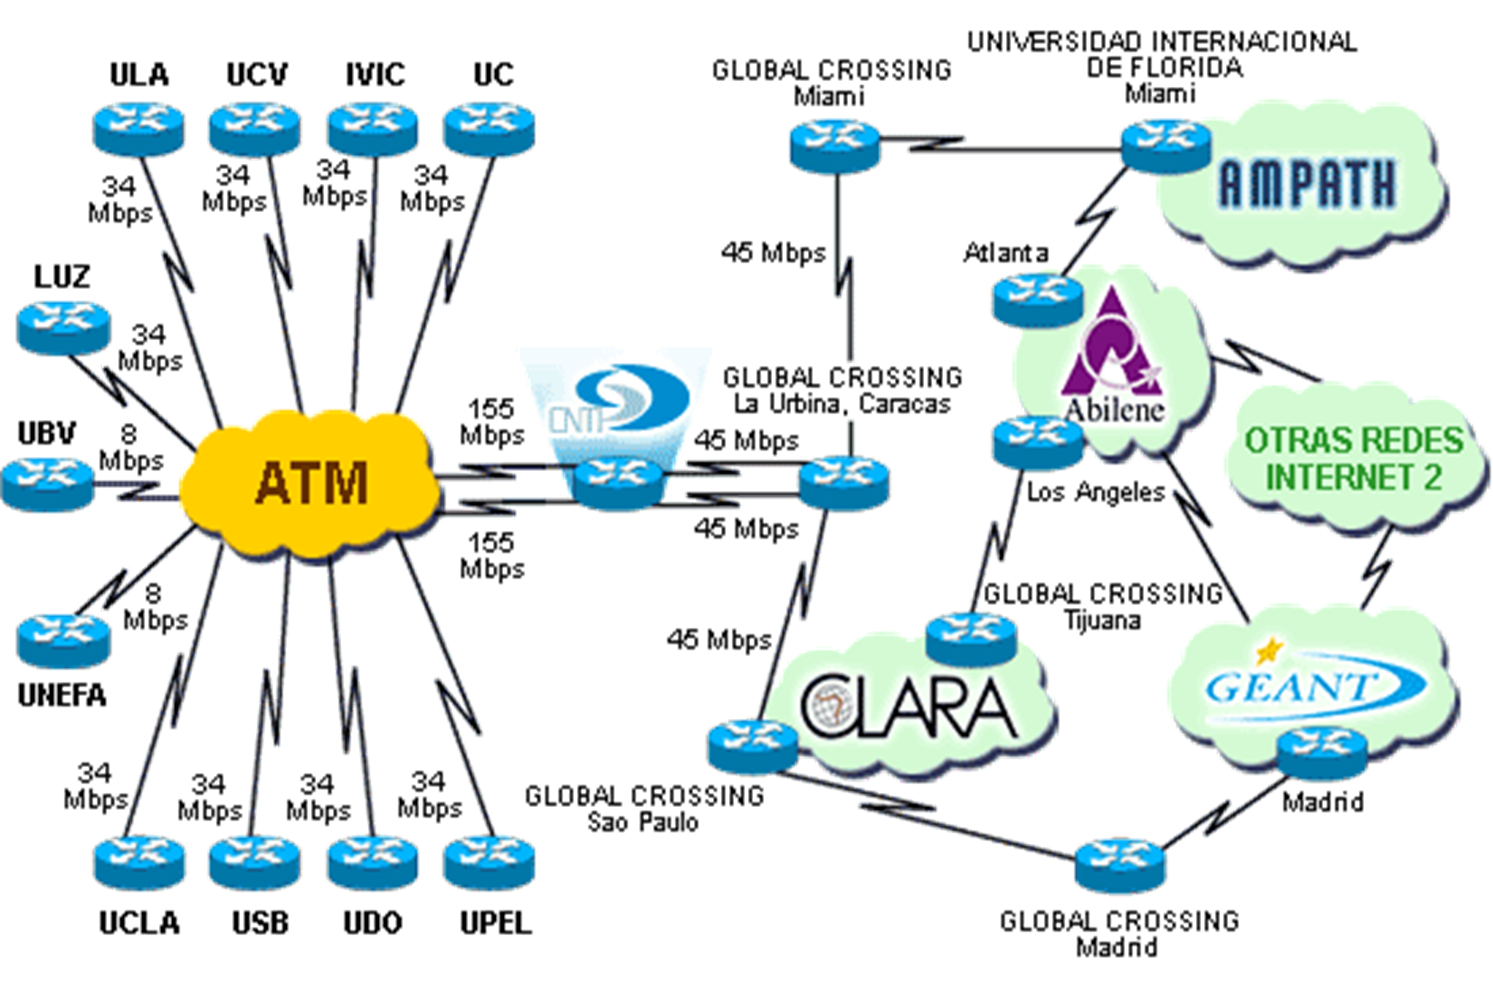
PNG File venz.png |
960 kB |
Unknown User (shahryar2001) |
Jun 15, 2007 16:23 |
Jun 15, 2007 16:23 |
|
Page: Latin America Case Study
|
|
PNG File Screen Shot 2014-02-08 at 12.36.10 PM.png |
955 kB |
Les Cottrell |
Feb 08, 2014 12:37 |
Feb 08, 2014 12:37 |
|
Page: Visual Traceroute (VTrace)
|