| Name
|
Size
|
Creator |
Creation Date
|
Last Modification Date
|
Labels |
Attached To |
|
Microsoft Powerpoint 97 Slideshow telecom-jul12.ppt |
406 kB |
Les Cottrell |
Aug 10, 2012 07:47 |
Aug 10, 2012 07:47 |
|
Page: Papers and Presentations
|
|
PNG File Screen Shot 2020-09-20 at 6.51.09 PM.png |
406 kB |
Les Cottrell |
Sep 20, 2020 18:51 |
Sep 20, 2020 18:51 |
|
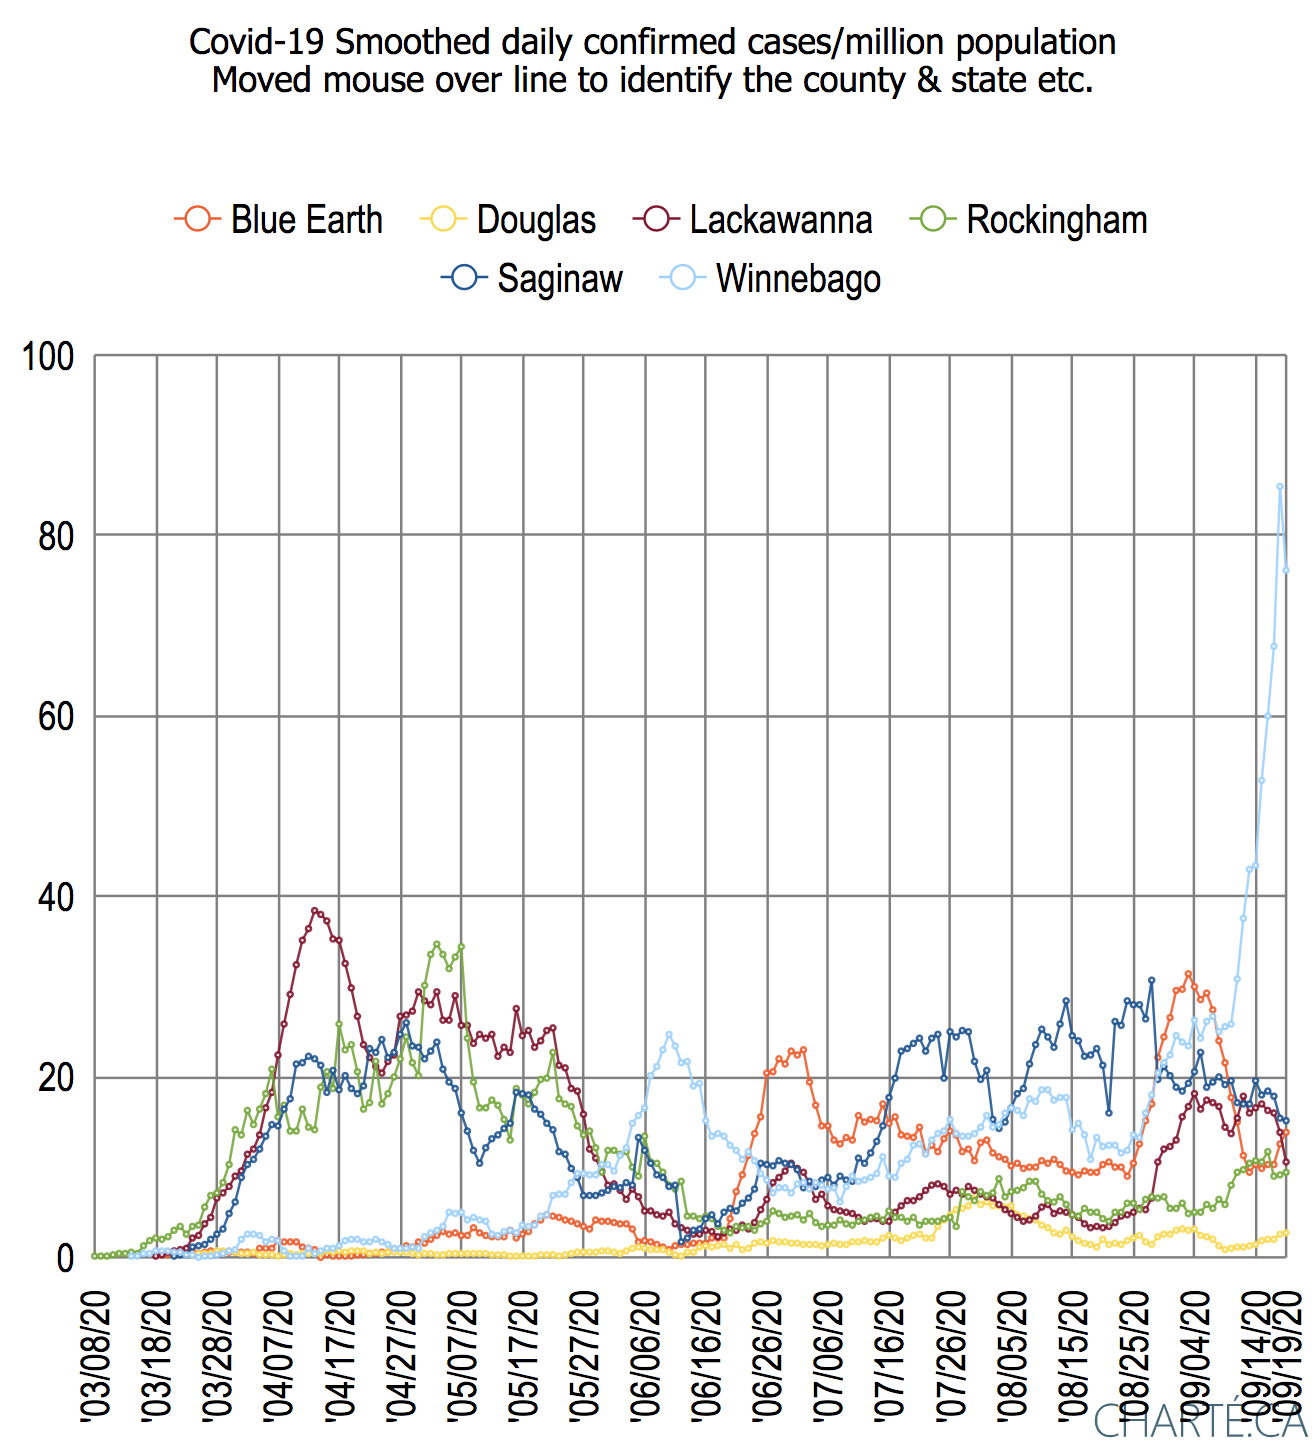
Page: Covid-19 US cases by counties following political rallies
|
|
PNG File Screen Shot 2021-01-26 at 5.11.19 PM.png |
406 kB |
Les Cottrell |
Jan 26, 2021 17:14 |
Jan 26, 2021 17:14 |
|
Page: Covid-19 Comparing the ratio of Deaths to Confirmed cases for representative countries
|
|
PNG File Screen Shot 2020-08-15 at 7.18.27 PM.png |
405 kB |
Les Cottrell |
Aug 15, 2020 19:19 |
Aug 15, 2020 19:19 |
|
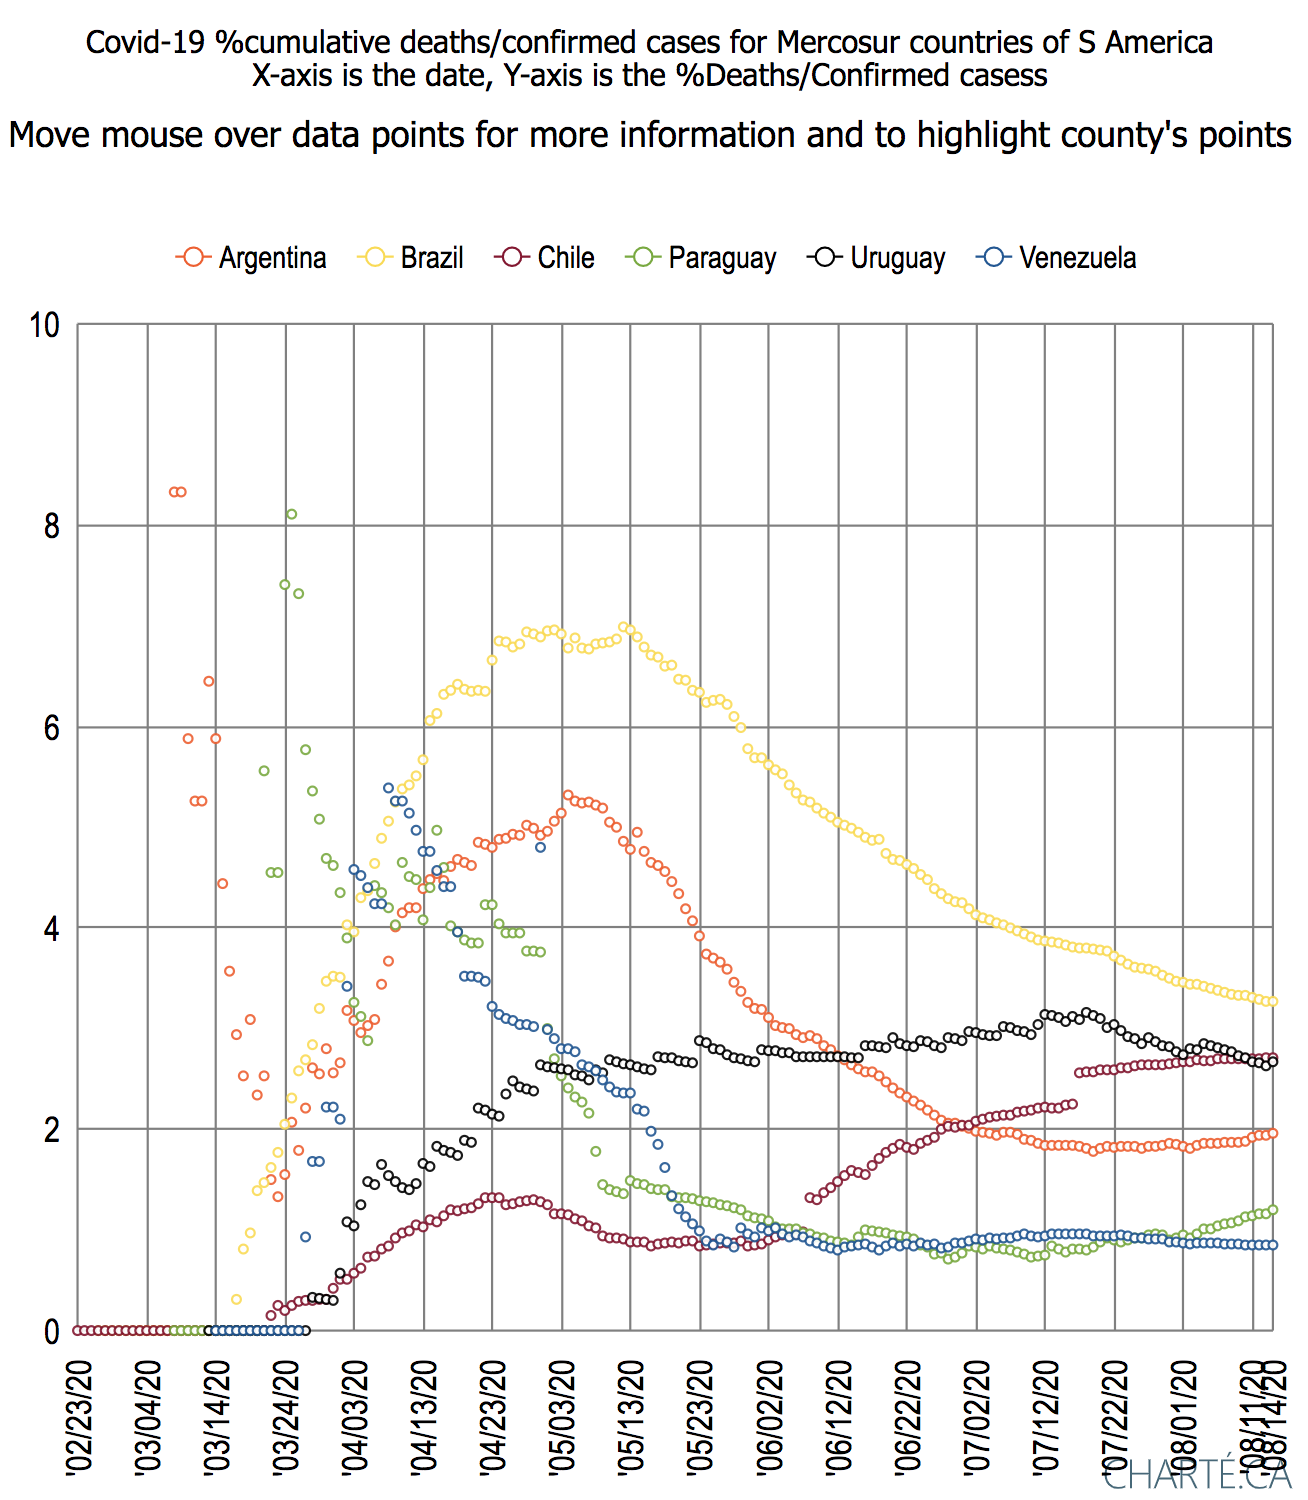
Page: Covid-19 South America
|
|
PNG File Screen Shot 2021-01-26 at 7.18.21 PM.png |
405 kB |
Les Cottrell |
Jan 26, 2021 19:20 |
Jan 26, 2021 19:20 |
|
Page: Covid-19 Comparing the ratio of Deaths to Confirmed cases for representative countries
|
|
PNG File Screen Shot 2021-01-26 at 7.18.21 PM.png |
405 kB |
Les Cottrell |
Jan 30, 2021 13:31 |
Jan 30, 2021 13:31 |
|
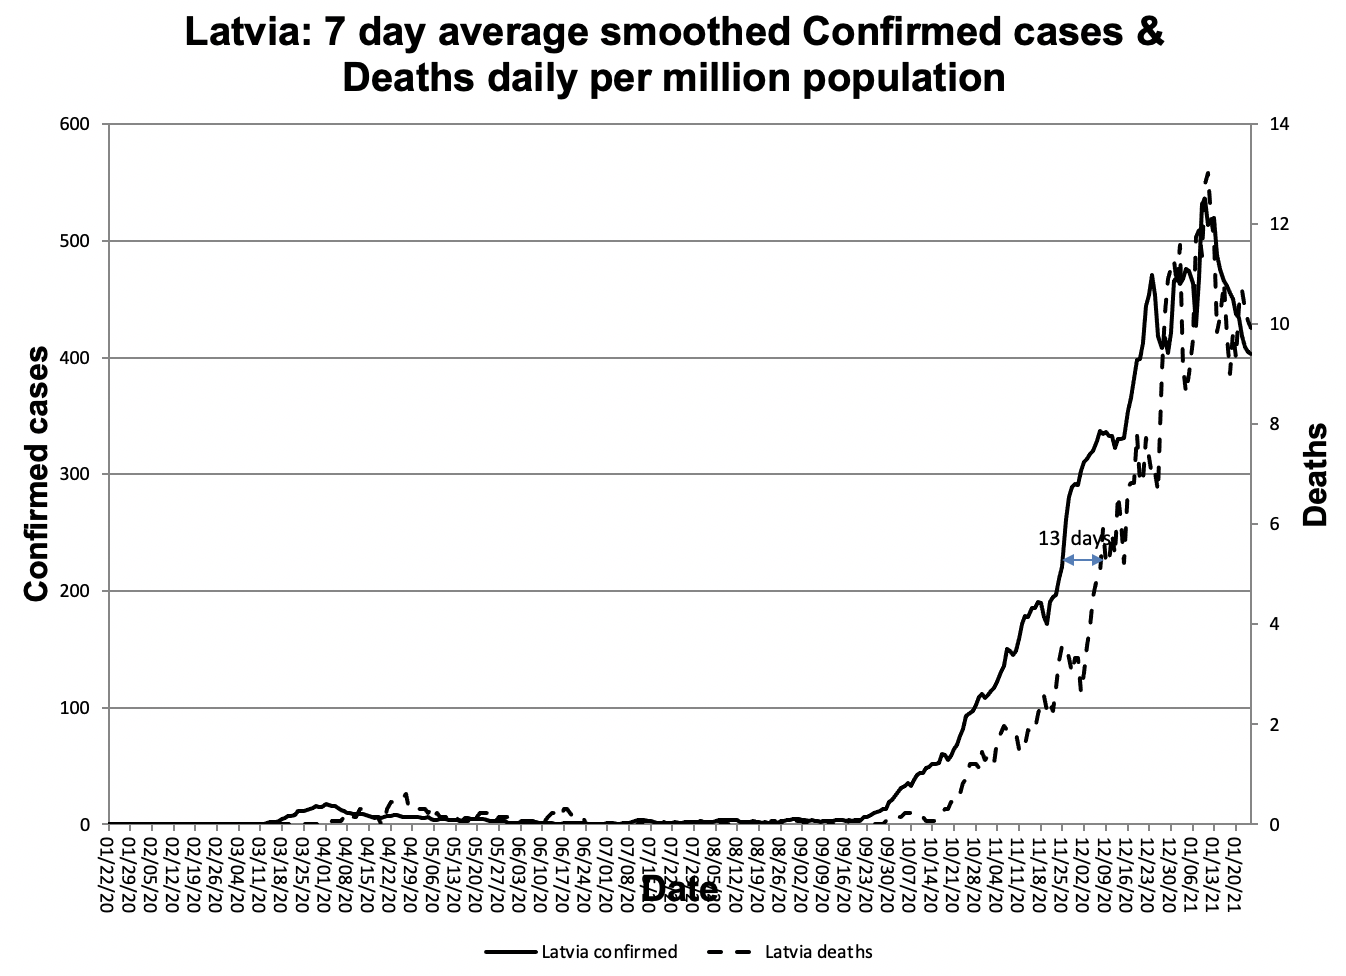
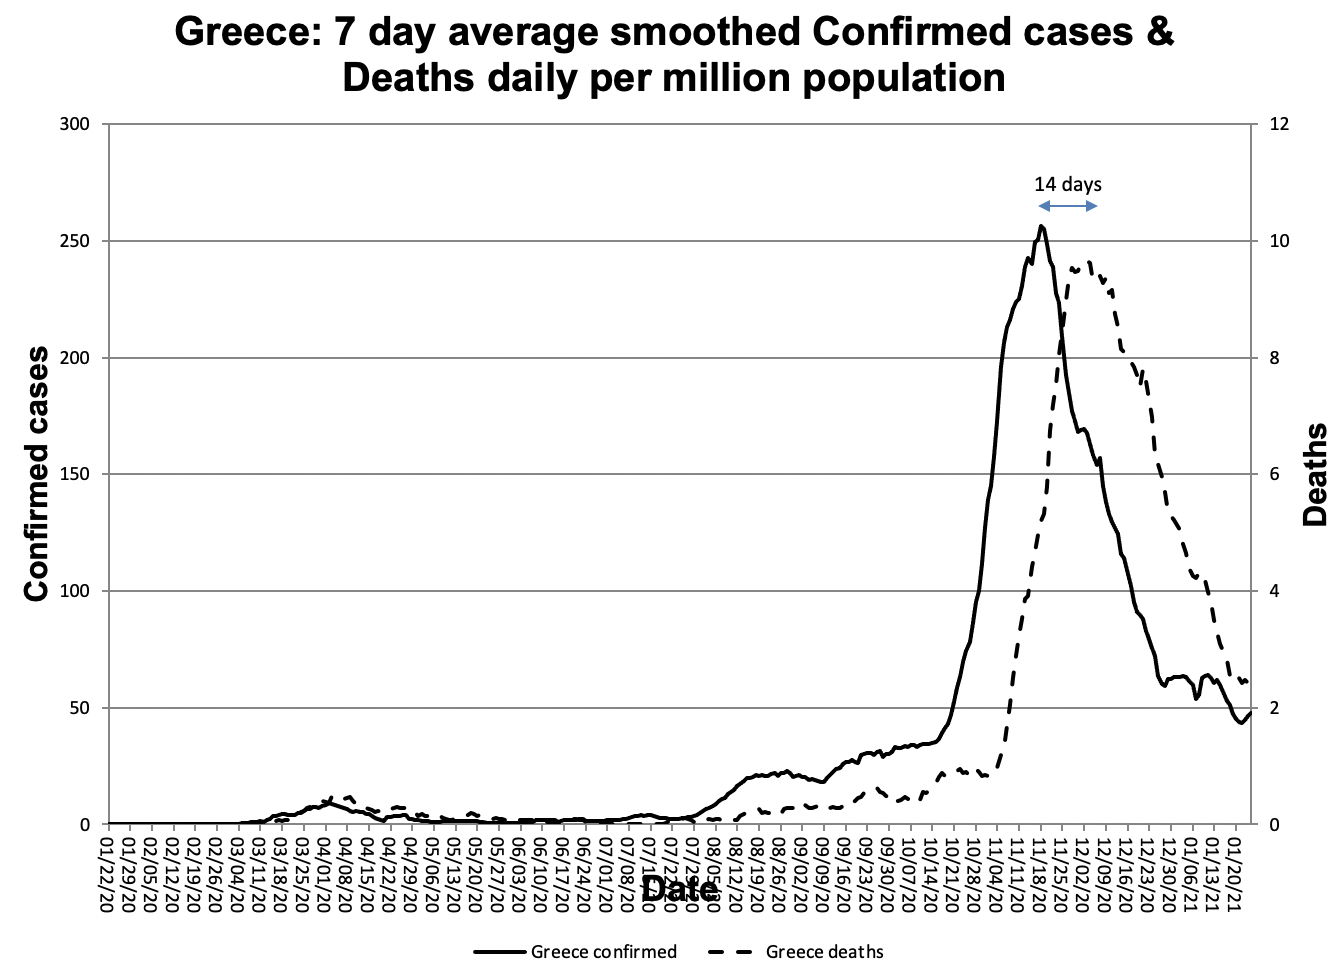
Page: Covid-19 Estimating delays between confirmed cases and deaths
|
|
PNG File Screen Shot 2021-01-26 at 5.26.44 PM.png |
405 kB |
Les Cottrell |
Jan 26, 2021 17:27 |
Jan 26, 2021 17:27 |
|
Page: Covid-19 Comparing the ratio of Deaths to Confirmed cases for representative countries
|
|
PNG File Screen Shot 2021-01-26 at 5.26.44 PM.png |
405 kB |
Les Cottrell |
Jan 30, 2021 13:31 |
Jan 30, 2021 13:31 |
|
Page: Covid-19 Estimating delays between confirmed cases and deaths
|
|
PNG File Screen Shot 2020-09-05 at 1.51.31 PM.png |
404 kB |
Les Cottrell |
Sep 05, 2020 13:52 |
Sep 05, 2020 13:52 |
|
Page: Covid-19 - Globally
|
|
PNG File Screen Shot 2020-09-20 at 6.36.57 PM.png |
404 kB |
Les Cottrell |
Sep 20, 2020 18:39 |
Sep 20, 2020 18:39 |
|
Page: Covid-19 - Visualizing the data with Motion Charts
|
|
PNG File Screen Shot 2020-09-20 at 6.36.57 PM.png |
404 kB |
Les Cottrell |
Sep 20, 2020 18:41 |
Sep 20, 2020 18:41 |
|
Page: Covid-19 US cases by counties following political rallies
|
|
PNG File Screen Shot 2021-01-26 at 10.01.38 PM.png |
404 kB |
Les Cottrell |
Jan 26, 2021 22:03 |
Jan 26, 2021 22:03 |
|
Page: Covid-19 Comparing the ratio of Deaths to Confirmed cases for representative countries
|
|
PNG File Screen Shot 2021-01-26 at 10.01.38 PM.png |
404 kB |
Les Cottrell |
Jan 30, 2021 13:31 |
Jan 30, 2021 13:31 |
|
Page: Covid-19 Estimating delays between confirmed cases and deaths
|
|
PNG File Screen Shot 2021-08-04 at 2.32.30 PM.png |
403 kB |
Les Cottrell |
Aug 04, 2021 14:33 |
Aug 04, 2021 14:33 |
|
Page: Covid-19 August 2, 2021
|
|
Microsoft Excel Spreadsheet ipdv-SLAC-country-last120days-weekdays-big.xlsx |
403 kB |
Les Cottrell |
May 20, 2020 12:24 |
May 20, 2020 12:24 |
|
Page: PingER and Covid-19 by Region
|
|
PNG File Screen Shot 2020-06-02 at 3.23.00 PM.png |
403 kB |
Les Cottrell |
Jun 02, 2020 15:24 |
Jun 02, 2020 15:24 |
|
Page: PingER and Covid-19 in East Africa
|
|
PNG File Screen Shot 2021-07-24 at 4.33.56 PM.png |
403 kB |
Les Cottrell |
Jul 24, 2021 16:34 |
Jul 24, 2021 16:34 |
|
Page: Covid-19 July 21, 2021
|
|
PNG File image2014-7-24 18:15:55.png |
402 kB |
Les Cottrell |
Jul 24, 2014 18:15 |
Jul 24, 2014 18:15 |
|
Page: Visual Traceroute (VTrace)
|
|
PNG File Screen Shot 2021-04-25 at 2.36.23 PM.png |
402 kB |
Les Cottrell |
May 09, 2021 14:48 |
May 10, 2021 17:52 |
|
Page: Covid-19: 2021-05-09 Comparison of badly affected countries by region
|
|
PNG File Screen Shot 2021-04-25 at 2.36.23 PM.png |
402 kB |
Les Cottrell |
Apr 25, 2021 14:38 |
Apr 25, 2021 14:38 |
|
Page: Covid-19 April 24 2021
|