Useful commands from Ric for looking at the history of DAQ Prometheus. Note that daqStats shows raw counts, while daqPipes shows percentages and also highlight (in red) detectors that are backed up (full buffer). daqPipes is more useful for understanding where bottlenecks are.
daqStats -p 0 --inst tmo --start '2020-11-11 13:50:00' daqPipes -p 0 --inst tmo --start '2020-11-11 13:50:00’ |
If you leave the —start off, then you get the live/current data.
Once either of these apps are running, hitting ‘h’ or '?' will give you help with the allowed keystrokes and what the columns mean.
See Riccardo's notes here: https://drive.google.com/file/d/19x52MNf_UyTjzZN1f7NkAQkqHTFE6mZy/view?usp=share_link
TMO: https://drive.google.com/file/d/1hbbaltB7rknWg3xtvNtaaMDYXDoRfjgj/view
A useful diagram of the pieces of a DRP node that should be monitored via prometheus is here: https://docs.google.com/presentation/d/1LvvUsV4A1F-7cao4t6mzr8z2qFFZEIwLKR4pXazU3HE/edit?usp=sharing
>for the pgp driver this parameter needs to be increased in /etc/sysctl.conf:
[root@drp-neh-cmp005 cpo]# grep vm /etc/sysctl.conf vm.max_map_count=1000000 [root@drp-neh-cmp005 cpo]# |
On May 20th 2022 we found that the RIX connect timeout was near the edge and it was caused by the PVA "andor vls" detector. Ric wrote about this:
Thanks for looking into this, Chris. The only thing I’ve been able to come up with on a quick look is that the time is maybe going into setting up the memory region for the DRP to share the event with the MEBs. I think this is mostly libfabric manipulating the MMU for this already allocated space (the pebble). Is the event buffer size maybe particularly large compared to the other DRPs? I’m guessing that since it’s an Andor, maybe 8 MB? Not sure what ‘vls’ does to it. If the trigger rate for this DRP isn’t high (10 Hz?), we could maybe speed this step up by lowering the number of DMA buffers so that fewer MMU entries are needed.
Default plan: high-rate detectors get L0Delay 100, low-rate detectors get L0Delay 0. Lower L0Delay numbers increase pressure on buffering which can result in deadtime and dropped Disable-phase2 transitions.
In general, this error message is a sign that the back pressure mechanism is not working correctly and buffers are being overwritten. We have also seen it when the buffer size allocated in tdetsim.service is smaller than the event data coming in the fiber. L0Delay being set too small is another possible cause, but other firmware "high water mark" buffer parameters listed in the next section can be another. See TriggerDelays for a discussion of L0Delay.
If you also see messages like *** corrupt EvtBatcherOutput: 4056 17039628, it may be due to the DMA buffer size being too small for the data coming from the detector. In this case, try increasing the cfgSize value found in the corresponding *.service file. A reduction in the cfgRxCount value may be needed to allow the entire block of DMA buffers to fit in memory.
Every detector should have XpmPauseThresh: was put in to protect a buffer of xpm messages. Get's or'd together with data pause threshold, can be difficult to disentangle in general.
We think the full signal to the XPM is the logical-OR of the following fifo high-water-mark settings:
May 19, 2023: working meeting monarin, melchior, valmar, cpo introduced deliberate misconfigurations in DAQ to understand behavior
Introduced sleep(10000) in piranha _event() method. Chaotic deadtime not from the piranha(!) but from epicsarch. daqpipes showed a backup in the pre-fex-worker piranha buffers, but we think the clearest indication of the source of the problem is a low "%BatchesInFlight" to the TEB. This perhaps makes sense, because the TEB is "eager" to receive the batches from the bottleneck detector.
Also see TEB crashes where it is unclear who is the bottleneck.
Did this by setting low thresholds in tmo hsd_3 when there was too much data saw a low "%BatchesInFlight" to the TEB which is perhaps the clearest indication of the problem. Can also get TEB crashes (where it is unclear who is responsible) and for hsd_5 with low threshold we saw DMA buffer-overflow crashes (where it is clear who is responsible).
To be done
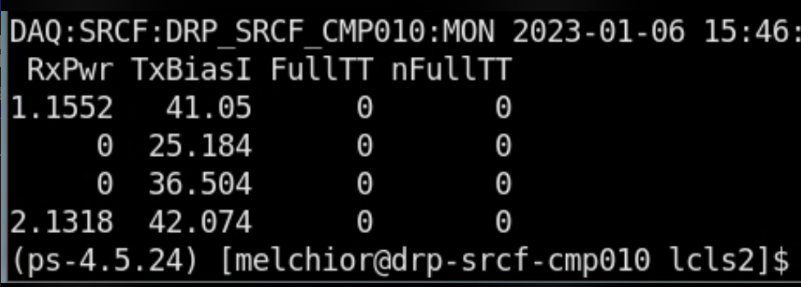
To see the optical powers Matt says we should run the software in psdaq/psdaq/pykcu (the second argument is a base name for exported epics vars). Same commands work for hsd kcu1500. NOTE: cpo thinks that we may have to use datadev_1 here. I tried with datadev_0 but received an epics timeout from pvget. NOTE: Fiber power readout only works with QSFP's not the "SFP converter" modules we typically use for tdetsim kcu's.
(ps-4.5.11) claus@drp-srcf-cmp005:srcf$ pykcu -d /dev/datadev_1 -P DAQ:SRCF & Start: Started zmqServer on ports 9103-9105 ClkRates: (0.0, 0.0) RTT: ((0, 0), (0, 0), (0, 0), (0, 0)) 2022-03-16T18:24:31.976 Using dynamically assigned TCP port 56828. Then run pvget to see optical powers: (ps-4.5.11) claus@drp-srcf-cmp005:srcf$ pvget DAQ:SRCF:DRP_SRCF_CMP005:MON DAQ:SRCF:DRP_SRCF_CMP005:MON 2022-03-16 18:24:31.983 RxPwr TxBiasI FullTT nFullTT 1.017 37.312 0 0 0.424 37.376 0 0 0.3964 38.272 0 0 0.3208 36.992 0 0 |
For a timing system node we would have only expected fiber power on the first, but Riccardo saw power on the first and fourth. Matt writes about this: "I agree with your observation and the conversion formula. In general, I'm finding the RxPwr number on lane 0 is inconsistent or suspicious.". (conversion formula is what we use for xpm: dBm=10*log(10)(val/1mW))
this is the correct firmware to program into the kcu:
drp-neh-cmp001:~$ ls -rtl ~weaver/mcs/*TDet*2020* -rw-r--r-- 1 weaver ec 31345008 Jun 12 2020 /cds/home/w/weaver/mcs/DrpTDet-20200612_primary.mcs -rw-r--r-- 1 weaver ec 31345008 Jun 12 2020 /cds/home/w/weaver/mcs/DrpTDet-20200612_secondary.mcs drp-neh-cmp001:~$ |
Running a register-reading devGui at the same time the daq is running. You may need to click "read all" to update the register values, and also update the port number with what your instance of the rogue software in the daq prints out:
python -m pyrogue gui --server='localhost:9103' |
A useful introduction to rogue: https://docs.google.com/presentation/d/1dyNqnSorvWl0j6kYO3NItaAnzBfNsMmWjGOJtaxrFaI/edit#slide=id.g172bb84825_0_48
NOTE: Some KCU firmware (notably the hsd image named DrpPgpIlv) is reprogrammed over /dev/datadev_1. If an attempt to update the firmware fails with updatePcieFpga.py throwing 'ValueError: Invalid promType', try again with '--dev /dev/datadev_1' added to the arguments. Also, some images don't automatically detect the prom type. A general KCU firmware reprogramming command would be:
python software/scripts/updatePcieFpga.py --path ~weaver/mcs --dev /dev/datadev_1 |
As of Jan. 20, 2021, Matt has production DrpTDet and DrpPgpIlv firmware here:
Riccardo's notes:
one can find the KCU firmware in https://github.com/slaclab/pgp-pcie-apps/releases
in this case provide with --path the folder where the firmware is stored
in case of promType error one can typically fix it by switching to the other datadev_N interface, otherwise can add "--type SPIx8"
An (updated) example kcu.service for HSDs:
drp-srcf-cmp005:~$ cat /lib/systemd/system/kcu.service [Unit] Description=KCU1500 Device Manager Requires=multi-user.target After=multi-user.target [Service] Type=forking ExecStartPre=-/sbin/rmmod datadev.ko ExecStart=/sbin/insmod /usr/local/sbin/datadev.ko cfgTxCount=4 cfgRxCount=1048572 cfgSize=8192 cfgMode=0x2 ExecStartPost=/usr/local/sbin/kcuStatus -I -d /dev/datadev_1 # To do: The irqbalance service will defeat the following unless it is disabled or the IRQs are banned in /etc/sysconfig/irqbalance ExecStartPost=-/usr/bin/sh -c "/usr/bin/echo 4 > /proc/irq/`grep datadev_0 /proc/interrupts | /usr/bin/cut -d : -f 1 | /usr/bin/tr -cd [:digit:]`/smp_affinity_list" ExecStartPost=-/usr/bin/sh -c "/usr/bin/echo 5 > /proc/irq/`grep datadev_1 /proc/interrupts | /usr/bin/cut -d : -f 1 | /usr/bin/tr -cd [:digit:]`/smp_affinity_list" KillMode=none IgnoreSIGPIPE=no StandardOutput=syslog StandardError=inherit [Install] WantedBy=multi-user.target |
Since 6/8/22, the DAQ code was updated to eliminate a separate buffer allocation mechanism (including the associated wait condition when the pool is empty) for the small input/result data buffers for/from the TEB. These buffers are now allocated using the same buffer index with which the pebble is allocated. Since this index is now shared with the TEB, this change has put constraints on its range (set by the cfgRxCount parameter in the tdetsim/kcu service file) across DRPs: a DRP in the common readout group must have the largest range and DRPs in subsidiary/slower readout groups must have smaller or the same range.
Roughly, if a DRP chain is stalled for some reason, the DMA buffers will be consummed at the trigger rate. So in the above example, the HSDs will start back pressuring into firmware after roughly 1 second given a trigger rate of 1 MHz. For a given trigger rate, there is no clear benefit to having one DRP have more or less DMA buffers than another. The first one to run out of buffers will cause backpressure and ultimately inhibit triggers, leaving additional buffers on other DRPs inaccessible. Thus, I suggest making the number of DMA buffers (cfgRxCount + cfgTxCount) the same for each DRP in a given readout group and to roughly keep the cfgRxCounts in the same ratio as the trigger rates of the groups (while still following the 2**N - cfgTxCount rule of above).
Ric does "taskset -c 4-63" for daq executables to avoid the cores where weka processes are running
We think this can help with errors like:
May 25 07:23:59 XXXXXXX kernel: [13445315.881356] BUG: soft lockup - CPU#16 stuck for 23s! [yyyyyyy:81602] |
From Matt:
The datadev driver parameter for interrupt coalescing is "cfgIrqHold". It is the number of 200 MHz clocks that an interrupt may be delayed to allow others to be serviced together. You can see its current setting with cat /proc/datadev_0. It looks like the current setting limits interrupts (per pcie device) to ~20 kHz.
[weaver@drp-srcf-cmp005 ~]$ cat /proc/datadev_0
-------------- Axi Version ----------------
Firmware Version : 0x6
ScratchPad : 0x0
Up Time Count : 71501
Device ID : 0x1
Git Hash : 0000000000000000000000000000000000000000
DNA Value : 0x00000000000000000000000000000000
Build String : DrpPgpIlv: Vivado v2019.1, rdsrv302 (x86_64), Built Sun 14 Jun 2020 05:50:49 PM PDT by weaver
-------------- General HW -----------------
Int Req Count : 0
Hw Dma Wr Index : 3634
Sw Dma Wr Index : 3634
Hw Dma Rd Index : 0
Sw Dma Rd Index : 0
Missed Wr Requests : 3530076280
Missed IRQ Count : 5846742
Continue Count : 0
Address Count : 4096
Hw Write Buff Count : 4095
Hw Read Buff Count : 0
Cache Config : 0x0
Desc 128 En : 1
Enable Ver : 0x2010101
Driver Load Count : 1
IRQ Hold : 10000
It appears that IRQ Hold / cfgIrqHold is a 16 bit value.
dmesg gives the IRQ number being used for a datadev device:
[Thu Feb 10 17:35:36 2022] datadev 0000:41:00.0: Init: IRQ 369
dstat can show the IRQ rate (interrupts/sec), here for an idle system with 2 datadev devices:
claus@drp-srcf-cmp005:~$ dstat -tiy -I 369,370 10----system---- -interrupts ---system-- time | 369 370 | int csw10-02 13:23:45| 101 101 |3699 598510-02 13:23:55| 100 100 |3807 6088
With IRQ Hold / cfgIrqHold set to 10000, the IRQ rate is seen to be around 22.4 KHz at a trigger rate of 71 KHz.
Note that the datadev driver can handle multiple buffers (O(1000)) per interrupt, so the IRQ rate tends to fall well below the rate set by the IRQ HOLD / cfgIrqHold value at high trigger rates. At 1 MHz trigger rate, the IRQ rate is a few hundred Hz.
If there is significant deadtime coming from a node hosting multiple DRPs at high trigger rate and kernel:NMI watchdog: BUG: soft lockup - CPU#0 stuck for 23s! [swapper/0:0] messages appear in dmesg, etc., it may be that the interrupts are being handled for both datadev devices by one core, usually CPU0. To avoid this, the interrupt handling can be moved to two different cores, e.g., CPU4 and 5 (to avoid the Weka cores in SRCF).
This can be done automatically in the tdetsim/kcu.service files with the lines:
ExecStartPost=-/usr/bin/sh -c "/usr/bin/echo 4 > /proc/irq/`grep datadev_0 /proc/interrupts | /usr/bin/cut -d : -f 1 | /usr/bin/tr -cd [:digit:]`/smp_affinity_list" ExecStartPost=-/usr/bin/sh -c "/usr/bin/echo 5 > /proc/irq/`grep datadev_1 /proc/interrupts | /usr/bin/cut -d : -f 1 | /usr/bin/tr -cd [:digit:]`/smp_affinity_list" |
The irqbalance service will override the above unless the service is disabled or it is told to avoid the datadev devices' IRQs. Unfortunately I haven't found a way to do that automatically, so for now we modify /etc/sysconfig/irqbalance:
IRQBALANCE_ARGS=--banirq=368 --banirq=369 --banirq=370
All 3 IRQs we typically see in SRCF are listed so that the irqbalance file can be used on all SRCF machines without modification. Note that if another device is added to the PCI bus, the IRQ values may be different.
Error messages may arise from rogue that look similar to:
1711665935.215109:pyrogue.axi.AxiStreamDma: AxiStreamDma::acceptReq: Timeout waiting for outbound buffer after 1.0 seconds! May be caused by outbound back pressure. |
These arise from a select which times out if no buffer is available. (Code is available here - as of 2024/04/23: https://github.com/slaclab/rogue/blob/de67a57927285d6df9f1a688a8187800ea80fcd8/src/rogue/hardware/axi/AxiStreamDma.cpp#L296C4-L297C4). There are (at least) a couple of scenarios where this may occur.
This led to the above error when trying to run the high-rate encoder (hrencoder). The Root rogue object could be instantiated but as soon as a register access was attempted (read or write) the software would enter a loop with continual timeout. The DAQ software would continue to run, printing the error every second.
Running cat /proc/datadev_0 showed that most Read buffers were in HW (desired situation); however, the write buffers were stuck in hardware (problematic). This was the case even with no process running. As a result, it was not possible to access registers.
-------------- Write Buffers ---------------
         Buffer Count : 4
          Buffer Size : 8192
          Buffer Mode : 2
      Buffers In User : 0
        Buffers In Hw : 4       # <-- THESE
  Buffers In Pre-Hw Q : 0
  Buffers In Sw Queue : 0       # <-- SHOULD BE HERE
      Missing Buffers : 0
       Min Buffer Use : 150982
       Max Buffer Use : 150983
       Avg Buffer Use : 150982
Tot Buffer Use : 603929 |
The solution was to restart the kcu.service service (sudo systemctl restart kcu.service ). Alternatively the kernel modules can be removed and reloaded directly.
sudo rmmod /usr/local/sbin/datadev.ko sudo insmod /usr/local/sbin/datadev.ko <Parameters...> |
Potential (Less Disruptive) Solution from Larry Ruckman: Sent via Slack (2024/04/22 17:32:22)
Can you increase increasing the write buffer count? I don’t think I have ever tested with anything less than 16
cpo will try increasing buffer count to see if this minimizes recurrences of the problem.
Matt's document showing the location of each hsd in the tmo chassis: https://docs.google.com/document/d/1SzPwrJsoJR0brlQG-mCNILPFh8njXYHGrQz7tl39Thw/edit?usp=sharing.
update on variables in hsdpva gui from Matt (06/05/2020):
On Nov. 18, 2020 saw a failure mode where hsd_4 did not respond on configure phase 2. Matt tracked this down to the fact that the kcu→hsd links weren't locked (visible with "kcuStatus" and "hsdpva"). Note that kcuStatus is currently not an installed binary: has to be run from the build area. This was caused by the fact that we were only running one-half of a pair of hsd's, and the other half is responsible for setting the clock frequencies on the kcu, which is required for link-lock. We set the clock frequencies by hand running "kcuStatus -I" (I for Initialize, I guess) on the drp node. Matt is thinking about a more robust solution.
On May 24, 2023 saw a failure where 3 out of 4 hsd's in rix failed configure phase2. The failing channels did not increment txcntsum in the pgp tab in hsdpva. The timing links looked OK, showing the usual 919kHz (should be 929?) of timing frames. Restarting hsdioc's didn't help. hsdpva timrxrst, timpllrst, reset didn't help either. xpmpva TxLinkReset didn't help. Eventually recovered by restarting hsdioc and waiting longer, so I think I didn't wait long enough in previous hsdioc restart attempts? May also be important to have the daq shutdown when restarting hsdioc. Also saw many errors like this in the hsdioc logs when it was broken:
DAQ:RIX:HSD:1_1A:A:MONTIMING putDone Error: Disconnect DAQ:RIX:HSD:1_1A:A:MONTIMING putDone Error: Disconnect DAQ:RIX:HSD:1_1A:A:MONTIMING putDone Error: Disconnect |
When we attempted to test the DAQ in SRCF with a couple of HSDs, we initially had trouble getting phase 2 of transitions through. The two "sides" 1_DA:A and B behaved differently with pgpread. Sometimes some events came through one side but not the other, but with significant delay from when the groupca Events tab Run box was checked and not when the transition buttons were clicked. Also some of the entries in hsdpva's tabs were odd (Buffers:raw:freesz reset to 65535 for one, 4094 for the other). Some work had been done on the PV gateway. hsdioc on daq-tmo-hsd-01 had been restarted and got into a bad state. Restarting it again cleared up the problem.
Changing the number of DMA buffers (cfgRxCount) in kcu.service can sometimes lead to the node hanging. In one case, after recovery from the hang using IPMI power cycling, the tdetsim service was started instead of the kcu service. After fixing that and starting the kcu service, the KCU was still unhappy. kcuStatus showed links unlocked and rx/txClkFreq values at 131.394 instead of the required 156.171. After power cycling again, kcuStatus reported normal values. We then found the hsdioc on daq-tmo-hsd-01 had become unresponsive. After restarting it, the HSD DAQ ran normally.
Matt measures both deadtime and deadfrac. The first is amount of time the system is unable to accept triggers, while the second is the fraction of events lost because of dead time. Deadfrac is, ultimately, more important. The HSD's can produce dead time, but still have deadfrac be small if all the dead time is between triggers. Matt writes about seeing 28% dead time at 10kHz with full waveforms while deadfrac was still zero: "I calculate 25% deadtime given the raw waveform size, trigger rate, and readout bandwidth. One raw waveform is 10us x 12 GB/s = 120 kB. That's enough to cross the threshold on the available buffer size. So, we are dead until that event is readout. The readout rate is 148M * 32B = 4.7 GB/s. So, it takes 120kB / 4.7 GB/s = 25 us to readout. That's 25% of the time between 10kHz triggers".
hsd cables can be plugged into the wrong place (e.g. "pairs" can be swapped). They must match the mapping documentation Matt has placed at the bottom of hsd.cnf (which is reflected in the lines in hsd.cnf that start up processes, making sure those are consistent is a manual process). Matt has the usual "remote link id" pattern that can be used to check this, by using "kcuStatus" on the KCU end and "hsdpva" on the other end. e.g.
psdev01:~$ ssh drp-neh-cmp020 ~/git/lcls2/psdaq/build/psdaq/pgp/kcu1500/app/kcuStatus | grep txLinkId
            txLinkId : fb009c33 fb019c33 fb029c33 fb039c33 fb049c33 fb059c33 fb069c33 fb079c33
psdev01:~$ |
NOTE: datadev_1 shows up first! You can see this by providing a -d argument to kcuStatus:
(ps-4.5.10) drp-neh-cmp024:lcls2$ ./psdaq/build/psdaq/pgp/kcu1500/app/kcuStatus -d 1 | grep -i linkid
            rxLinkId : fc000000 fc010000 fc020000 fc030000
            txLinkId : fb009c3b fb019c3b fb029c3b fb039c3b
(ps-4.5.10) drp-neh-cmp024:lcls2$ |
The lane number (0-7) is encoded in the 0xff0000 bits. The corresponding hsdpva is:
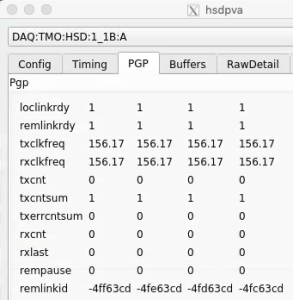
Unfortunately, the remlinkid is currently displayed as a signed integer, so to see the real value one has to calculate, for example, 0x100000000-0x4ff63cd=0xfb009c33 (see output of kcuStatus txLinkId above)
The clock speed is programmed via datadev_1, so if only a datadev_0 is included then the pgp link between KCU and HSD will not lock. It currently requires the corresponding datadev_1 to be in the cnf file.
Multi-opal can have this problem too. Can get dead time from an hsd that is not included the partition (or has been removed from the cnf). In the case, the "zombie" has a stuck "enable" bit in the hsdpva config tab. Options:
Remember to stop hsd processes before installing firmware:
Connect to tmo-daq as tmoopr and use the "procmgr stopall hsd.cnf" command
Also, remember to stopall hsd.cnf before making any changes in the hsd.cnf file itself since port numbering is incremental and order will change if one introduces new processes.
Some useful instructions from Matt:
High Speed Digitizer (HSD) Firmware Programming
Programming HSD Firmware in LCLS Hutches
Note that as of April 2024 firmware can also be programmed over pcie and Matt has moved to the standard datadev driver (although need to pick up the latest version from git to get support for the use of multiple hsd's in a crate .
Matt writes to Riccardo:
Riccardo: Hello Matt, I have some confusion regarding how to use the new firmware for the hsd.
The hsd.cnf file still uses /dev/datadev_3e (for example), but in the fee in cmp024 we only have datadev_0.
What do you need to change to switch to the datadev.ko?
Do you use a different kcu.service?
Thanks
Matt: You can either use the old driver with the device name datadev_0, or you can install the updated driver and load it with the argument cfgDevName=1 to get the bus ID tagged onto the device name. I'd recommend just staying with the old driver and changing the expected name to datadev_0.
See the pcie device numbers in with lspci:
daq-tmo-hsd-01:~$ lspci | grep -i slac 1a:00.0 Memory controller: SLAC National Accelerator Lab TID-AIR Device 2100 1b:00.0 Memory controller: SLAC National Accelerator Lab TID-AIR Device 2100 3d:00.0 Memory controller: SLAC National Accelerator Lab TID-AIR Device 2100 3e:00.0 Memory controller: SLAC National Accelerator Lab TID-AIR Device 2100 5e:00.0 Memory controller: SLAC National Accelerator Lab TID-AIR Device 2100 88:00.0 Memory controller: SLAC National Accelerator Lab TID-AIR Device 2100 89:00.0 Memory controller: SLAC National Accelerator Lab TID-AIR Device 2100 b1:00.0 Memory controller: SLAC National Accelerator Lab TID-AIR Device 2100 b2:00.0 Memory controller: SLAC National Accelerator Lab TID-AIR Device 2100 da:00.0 Memory controller: SLAC National Accelerator Lab TID-AIR Device 2100 |
2 hsd cards can talk to 1 data card, and each data card has 4 LR4 transceivers (2 per hsd-card). hsd card has a "mezzanine" component with analog input connectors, and a JESD connection through the usual xilinx MGT (serial connection) to a pcie carrier card. There is a cable (small coax cables that Matt says have failed in the past) that connects the hsd card(s) (up to two) to the data card. The FPGA is on the hsd pcie carrier card.
Then startup pv servers for both A&B (and potentially 2 cards hooked up to 1 data card) with: "hsdpvs -P DAQ:TMO:HSD:2_41:A" (currently these go on ct002).
Startup the hsdioc process like this: "hsd134PVs -P DAQ:TMO:HSD:2_41 -d /dev/pcie_adc_41". This also programs the right clock frequencies for the timing link to the XPM, so you can check XPM link lock with xpmpva at this point.
One can run kcuStatus on the drp node to set clock frequencies and look at link lock on that side.
Now we can bring up hsdpva like "hsdpva DAQ:TMO:HSD:2_41:A DAQ:TMO:HSD:2_41:B".
NOTE: check for A and B cable swaps as described above using the remote link id's shown in hsdpva and kcuStatus.
You can see optical powers on the kcu1500 with the pykcu command (and pvget), although see below for examples of problems so I have the impression this isn't reliable. See the timing-system section for an example of how to run pykcu. On the hsd's themselves it's not possible because the FPGA (on the hsd pcie carrier card) doesn't have access to the i2c bus (on the data card). Matt says that In principle the hsd card can see the optical power from the timing system, but that may require firmware changes.
Note: on the kcu1500 running "pykcu -d /dev/datadev_1 -P DAQ:CPO" this problem happens when I unplug the fiber farthest from the mini-usb connector:
(ps-4.5.10) drp-neh-cmp024:lcls2$ pvget DAQ:CPO:DRP_NEH_CMP024:MON DAQ:CPO:DRP_NEH_CMP024:MON 2022-03-21 16:41:49.139 RxPwr TxBiasI FullTT nFullTT 2.0993 41.806 0 0 0.0001 41.114 0 0 0.0001 41.008 0 0 0.0001 42.074 0 0 And the first number fluctuates dramatically: (ps-4.5.10) drp-neh-cmp024:lcls2$ pvget DAQ:CPO:DRP_NEH_CMP024:MON DAQ:CPO:DRP_NEH_CMP024:MON 2022-03-21 16:41:29.127 RxPwr TxBiasI FullTT nFullTT 3.3025 41.946 0 0 0.0001 41.198 0 0 0.0001 41.014 0 0 0.0001 42.21 0 0 (ps-4.5.10) drp-neh-cmp024:lcls2$ pvget DAQ:CPO:DRP_NEH_CMP024:MON DAQ:CPO:DRP_NEH_CMP024:MON 2022-03-21 16:41:39.129 RxPwr TxBiasI FullTT nFullTT 0.0001 41.872 0 0 0.0001 40.932 0 0 0.0001 40.968 0 0 0.0001 42.148 0 0 |
When I plug the fiber back in I see significant changes but the first number continues to fluctuate dramatically:
(ps-4.5.10) drp-neh-cmp024:lcls2$ pvget DAQ:CPO:DRP_NEH_CMP024:MON DAQ:CPO:DRP_NEH_CMP024:MON 2022-03-21 16:45:19.343 RxPwr TxBiasI FullTT nFullTT 1.1735 41.918 0 0 0.744 41.17 0 0 0.4544 41.008 0 0 0.6471 42.032 0 0 (ps-4.5.10) drp-neh-cmp024:lcls2$ pvget DAQ:CPO:DRP_NEH_CMP024:MON DAQ:CPO:DRP_NEH_CMP024:MON 2022-03-21 16:45:39.363 RxPwr TxBiasI FullTT nFullTT 0.4084 41.972 0 0 0.7434 41.126 0 0 0.4526 41.014 0 0 0.6434 42.014 0 0 |
Running pykcu with datadev_0 all powers read back as zero, unfortunately:
(ps-4.5.10) drp-neh-cmp024:lcls2$ pvget DAQ:CPO:DRP_NEH_CMP024:MON
DAQ:CPO:DRP_NEH_CMP024:MON 2022-03-21 16:47:40.762
RxPwr TxBiasI FullTT nFullTT
    0       0      0       0
    0       0      0       0
    0       0      0       0
0 0 0 0 |
There have been several instances of not being able to get phase 2 of Configure though an HSD DRP. At least some of these were traced to kcuStatus showing 131 MHz instead of the required 156 MHz. This can happen if the tdetsim service starts instead of kcu.service. Sometimes, no amount of kcuStatus -I or kcuStatus -R restores proper operation. In this case the KCU FPGA may be in a messed up state, so power cycle the node to get the FPGA to reload.
/reg/common/tools/bin/netconfig search ctl-kfe-cam-02-drp
ctl-kfe-cam-02-drp:
subnet: daq-drp-neh.pcdsn
Ethernet Address: b4:2e:99:ab:14:4f
IP: 172.21.156.96
Contact: uid=velmir,ou=People,dc=reg,o=slac
PC Number: 00000
Location: Same as ctl-kfe-cam-02
Description: DRP interface for ctl-kfe-cam-02
Puppet Classes:
Found 1 entries that match ctl-kfe-cam-02-drp.
From Chris Ford. See also ConfigDB and DAQ configdb CLI Notes. Supports ls/cat/cp. NOTE: when copying across hutches it's important to specify the user for the destination hutch. For example:
configdb cp --user rixopr --password <usual> --write tmo/BEAM/tmo_atmopal_0 rix/BEAM/atmopal_0 |
<det>_config_store.pyDetector records can be defined and then stored in the database using the <det>_config_store.py scripts. For a minimal model see the hrencoder_config_store.py which has just a couple additional entries beyond the defaults (which should be stored for every detector).
Once the record has been defined in the script, the script can be run with a few command-line arguments to store it in the database.
The following call should be appropriate for most use cases.
python <det>_config_store.py --name <unique_detector_name> [--segm 0] --inst <hutch> --user <usropr> --password <usual> [--prod] --alias BEAM |
Verify the following:
--inst) as defined in the cnf file for the specific configuration and include as --user <usr> . This is used for HTTP authentication. E.g., tmoopr, tstopr--prod if using the production database. This will need to match the entry in your cnf file as well, defined as cdb. https://pswww.slac.stanford.edu/ws-auth/configdb/ws is the production database.–sgem $SEGM in addition to –name $DETNAME python <det>_config_store.py --help is available and will display all arguments.
There are similar scripts that can be used to update entries. E.g.:
hsd_config_update.py i.e. changing the structure of an object while keeping existing values the same. An example from Ric: "Look at the __main__ part of epixm320_config_store.py. Then run it with --update. You don’t need the bit regarding args.dir. That’s for uploading .yml files into the configdb."
Here's an example from Matt: python /cds/home/opr/rixopr/git/lcls2_041224/psdaq/psdaq/configdb/hsd_config_update.py --prod --inst tmo --alias BEAM --name hsd --segm 0 --user tmoopr --password XXXX
Matt gave us a video tutorial on how to access the MCC epics archiver.
(conversation with Ric on 06/16/20 on TEB grafana page)
BypCt: number bypassing the TEB
BtWtg: boolean saying whether we're waiting to allocate a batch
TxPdg (MEB, TEB, DRP): boolean. libfabric saying try again to send to the designated destination (meb, teb, drp)
RxPdg (MEB, TEB, DRP): same as above but for Rx.
(T(eb)M(eb))CtbOInFlt: incremented on a send, decremented on a receive (hence "in flight")
In tables at the bottom: ToEvtCnt is number of events timed out by teb
WrtCnt MonCnt PsclCnt: the trigger decisions
TOEvtCnt TIEvtCnt: O is outbound from drp to teb, I is inbound from teb to drp
Look in teb log file for timeout messages. To get contributor id look for messages like this in drp:
/reg/neh/home/cpo/2020/06/16_18:19:24_drp-tst-dev010:tmohsd_0.log:Parameters of Contributor ID 8:
Conversation from Ric and Valerio on the opal file-writing problem (11/30/2020):
I was poking around with daqPipes just to familiarize myself with it and I was looking at the crash this morning at around 8.30. I noticed that at 8.25.00 the opal queue is at 100% nd teb0 is starting to give bad signs (again at ID0, from the bit mask) However, if I make steps of 1 second, I see that it seems to recover, with the queue occupancy dropping to 98, 73 then 0. However, a few seconds later the drp batch pool for all the hsd lists are blocked. I would like to ask you (answer when you have time, it is just for me to understand): is this the usual Opal problem that we see? Why does it seem to recover before the batch pool blocks? I see that the first batch pool to be exhausted is the opal one. Is this somehow related?
If a contribution is missing, the *EBs time it out (4 seconds, IIRR), then mark the event with DroppedContribution damage. The Result dgram (TEB only, and it contains the trigger decision) receives this damage and is sent to all contributors that the TEB heard from for that event. Sending it to contributors it didn’t hear from might cause problems because they might have crashed. Thus, if there’s damage raised by the TEB, it appears in all contributions that the DRPs write to disk and send to the monitoring. This is the way you can tell in the TEB Performance grafana plots whether the DRP or the TEB is raising the damage.
Ok thank you. But when you say: "If that contributor (sorry, DRP) tried to produce a contribution, it never gets an answer, which is needed to release the input batch and PGP DMA buffer". I guess you mean that the DRP tries to collect a contribution for a contributor that maybe is not there. But why would the DRP try to do that? It should know about the damage from the TEB's trigger decision, right? (Do not feel compelled to answer immediately, when you have time)
The TEB continues to receive contributions even when there’s an incomplete event in its buffers. Thus, if an event or series of events is incomplete, but a subsequent event does show up as complete, all those earlier incomplete events are marked with DroppedContribution and flushed, with the assumption they will never complete. This happens before the timeout time expires. If the missing contributions then show up anyway (the assumption was wrong), they’re out of time order, and thus dropped on the floor (rather than starting a new event which will have the originally found contributors in it missing (Aaah, my fingers have form knots!), causing a split event (don’t know if that’s universal terminology)). A split event is often indicative of the timeout being too short.
A thought from Ric on how shmem buffer sizes are calculated:
On 4/1/22 there was an unusual crash of the DAQ in SRCF. The system seemed to start up and run normally for a short while (according to grafana plots), but the AMI sources panel didn't fill in. Then many (all?) DRPs crashed (ProcStat Status window) due to not receiving a buffer in which to deposit their SlowUpdate contributions (log files). The ami-node_0 log file shows exceptions '*** Corrupt xtc: namesid 0x501 not found in NamesLookup' and similar messages. The issue was traced to there being 2 MEBs running on the same node. Both used the same 'tag' for the shared memory (the instrument name, 'tst'), which probably led to some internal confusion. Moving one of the MEBs to another node resolved the problem. Giving one of the MEBs a non-default tag (-t option) also solves the problem and allows both MEBs to run on the same node.
See Matt's information: Calient S320 ("The BOS")
curl --cookie PHPSESSID=ue5gks2db6optrkputhhov6ae1 -X POST --header "Content-Type: application/json" --header "Accept: application/json" -d "{\"in\": \"1.1.1\",\"out\": \"6.1.1\",\"dir\": \"bi\",\"band\": \"O\"}" --user admin:pxc*** "http://osw-daq-calients320.pcdsn/rest/crossconnects/?id=add"url --cookie PHPSESSID=ue5gks2db6optrkputhhov6ae1 -X POST --header "Content-Type: application/json" --header "Accept: application/json" --user admin:pxc*** "http://osw-daq-calients320.pcdsn/rest/crossconnects/?id=activate&conn=1.1.1-6.1.1&group=SYSTEM&name=1.1.1-6.1.1"411 - Length Required'curl --cookie PHPSESSID=ue5gks2db6optrkputhhov6ae1 -X GET --user admin:pxc*** 'http://osw-daq-calients320.pcdsn/rest/crossconnects/?id=list'Ports→SummaryExport CSV' in the upper left of the Port Summary tablelcls2/psdaq/psdaq/cnf/BOS-PortSummary.csvLooking at the eye diagram or bathtub curves gives really good image of the high speed links quality on the Rx side. The pyxpm_eyediagram.py tool provides a way to generate these plots for the SFPs while the XPM is receiving real data.
How to use (after loading conda env.)
python pyxpm_eyescan.py --ip {XPM_IP_ADDR} --link {AMC_LINK[0:13]} [--hseq {VALUE}] [--eye] [--bathtub] [--gui] [--forceLoopback] [--target {VALUE}] |
Where:
High speed repeater, located on the AMC cards, which repeat (clean) the link from/to SFP/FPGA, have to be configured. The equalizer default value does not provide a safe environment and link might not lock with this configuration.
How to use (after loading conda env.). Note that XPM_ID is the usual DAQ ID number (e.g. zero is the supervisor xpm in room 208). This allows Julian's software to talk to the right epics registers:
python pyxpm_hsrepeater.py --ip {XPM_IP_ADDR} --xpmid {XPM_ID} --link {AMC_LINK[0:13]} |
What:
See results here: Link quality and non-locking issue
An example for XPM 10, AMC 1, Link 3:
(ps-4.6.2) claus@drp-neh-ctl002:neh$ python ~/lclsii/daq/lcls2/psdaq/psdaq/pyxpm/pyxpm_hsrepeater.py --ip 10.0.5.102 --xpmid 10 --link 10
Rogue/pyrogue version v5.18.4. https://github.com/slaclab/rogue
Start: Started zmqServer on ports 9103-9105
    To start a gui: python -m pyrogue gui --server='localhost:9103'
    To use a virtual client: client = pyrogue.interfaces.VirtualClient(addr='localhost', port=9103)
Scan equalizer settings for link 10 / XPM 10
    Link[10] status (eq=00): Ready (Rec: 20635200 - Err: 0)
    Link[10] status (eq=01): Ready (Rec: 20635200 - Err: 0)
    Link[10] status (eq=02): Ready (Rec: 20635200 - Err: 0)
    Link[10] status (eq=03): Ready (Rec: 20635201 - Err: 0)
    Link[10] status (eq=07): Ready (Rec: 20635200 - Err: 0)
    Link[10] status (eq=15): Ready (Rec: 20635200 - Err: 0)
    Link[10] status (eq=0B): Ready (Rec: 20635201 - Err: 0)
    Link[10] status (eq=0F): Ready (Rec: 20635200 - Err: 0)
    Link[10] status (eq=55): Ready (Rec: 20635200 - Err: 0)
    Link[10] status (eq=1F): Ready (Rec: 20635200 - Err: 0)
    Link[10] status (eq=2F): Ready (Rec: 20635200 - Err: 0)
    Link[10] status (eq=3F): Ready (Rec: 20635200 - Err: 0)
    Link[10] status (eq=AA): Ready (Rec: 20635200 - Err: 0)
    Link[10] status (eq=7F): Ready (Rec: 20635200 - Err: 0)
    Link[10] status (eq=BF): Ready (Rec: 3155 - Err: 5702)
    Link[10] status (eq=FF): Not ready (Rec: 0 - Err: 9139)
    [Configured] Set eq = 0x00
^CException ignored in: <module 'threading' from '/cds/sw/ds/ana/conda2/inst/envs/ps-4.6.2/lib/python3.9/threading.py'>
Traceback (most recent call last):
  File "/cds/sw/ds/ana/conda2/inst/envs/ps-4.6.2/lib/python3.9/threading.py", line 1477, in _shutdown
    lock.acquire()
KeyboardInterrupt: |
Crate ID is 5 according to the table in Shelf Managers below, and slot is 2 according to the crate photos below. Ctrl-C must be given to terminate the program.
Before May 2021:
https://docs.google.com/drawings/d/1IX8qFco1tY_HJFdK-UTUKaaP_ZYb3hr3EPJJQS65Ffk/edit?usp=sharing
Now (May 2021):
https://docs.google.com/drawings/d/1clqPlpWZiohWoOaAN9_qr4o06H0OlCHBqAirVo9CXxo/edit?usp=sharing
Eventually:
https://docs.google.com/drawings/d/1alpt4nDkSdIxZRQdHMLxyvG5HsCrc7kImiwGUYAPHSE/edit?usp=sharing
XPM topology after recabling for SRCF (May 10, 2023):
globalTiming -> newxpm0 -> 2 (tmo) -> 4 (tmo)
                                   -> 6 (208) -> BOS
                        -> 3 (rix) -> 5 (208) -> BOS
                                   -> 1 (rix)
XPM0 (208) -> 10 (fee) -> 11(fee) |
NEH Connections
From xpmpva on Oct. 31, 2022.


Numbering
amc1 on left, amc0 on right
ports count 0-6 from right to left, matching labelling on xpm, but opposite the order in xpmpva which goes left to right
LEFTMOST PORT IS UNUSED (labelled 7 on panel)
in fee, xpm0 was lowest slot (above switch), xpm1 one up
pyxpm 2 is fee (currently the master), 4 is hutch, 3 unused
epics numbering of xpm 0 2 1
From Matt: The ATCA crate in the FEE has a crate number that must differ from the other crates on the network. That crate number comes from the shelf manager. So, when we get a shelf manager, we'll need to set its crate ID. That determines the third byte for all the IP addresses in the crate. 10.0.<crate>.<slot+100>. See LCLS-II: Generic IPMC Commands#HowtosetupATCAcrateID for setting the ATCA crate ID.
An example session from Matt:
[weaver@psdev02 ~]$ ssh root@shm-neh-daq02
key_load_public: invalid format
Warning: Permanently added 'shm-neh-daq02,172.21.156.127' (RSA) to the list of known hosts.
root@shm-neh-daq02's password:
sh: /usr/bin/X11/xauth: not found
# clia shelfaddress
Pigeon Point Shelf Manager Command Line Interpreter
Shelf Address Info: "L2SI_0002" |
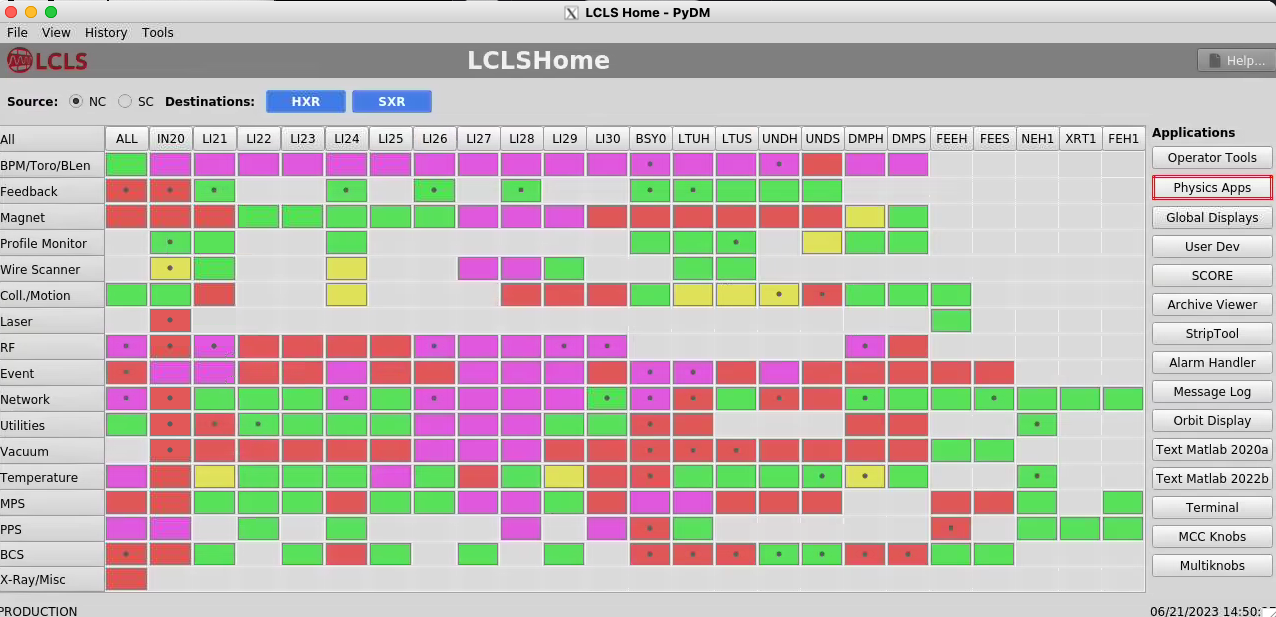
Matt writes that he logs in lcls-srv01 (see below) and launches "lclshome" to see that the LCLS1 timing is down. If you see an "xcb" error it means X-forwarding is broken, perhaps because of a bad key in .ssh/known_hosts.
Matt says to look at the "Event" row:
Debugging with Matt on March 12, 2024
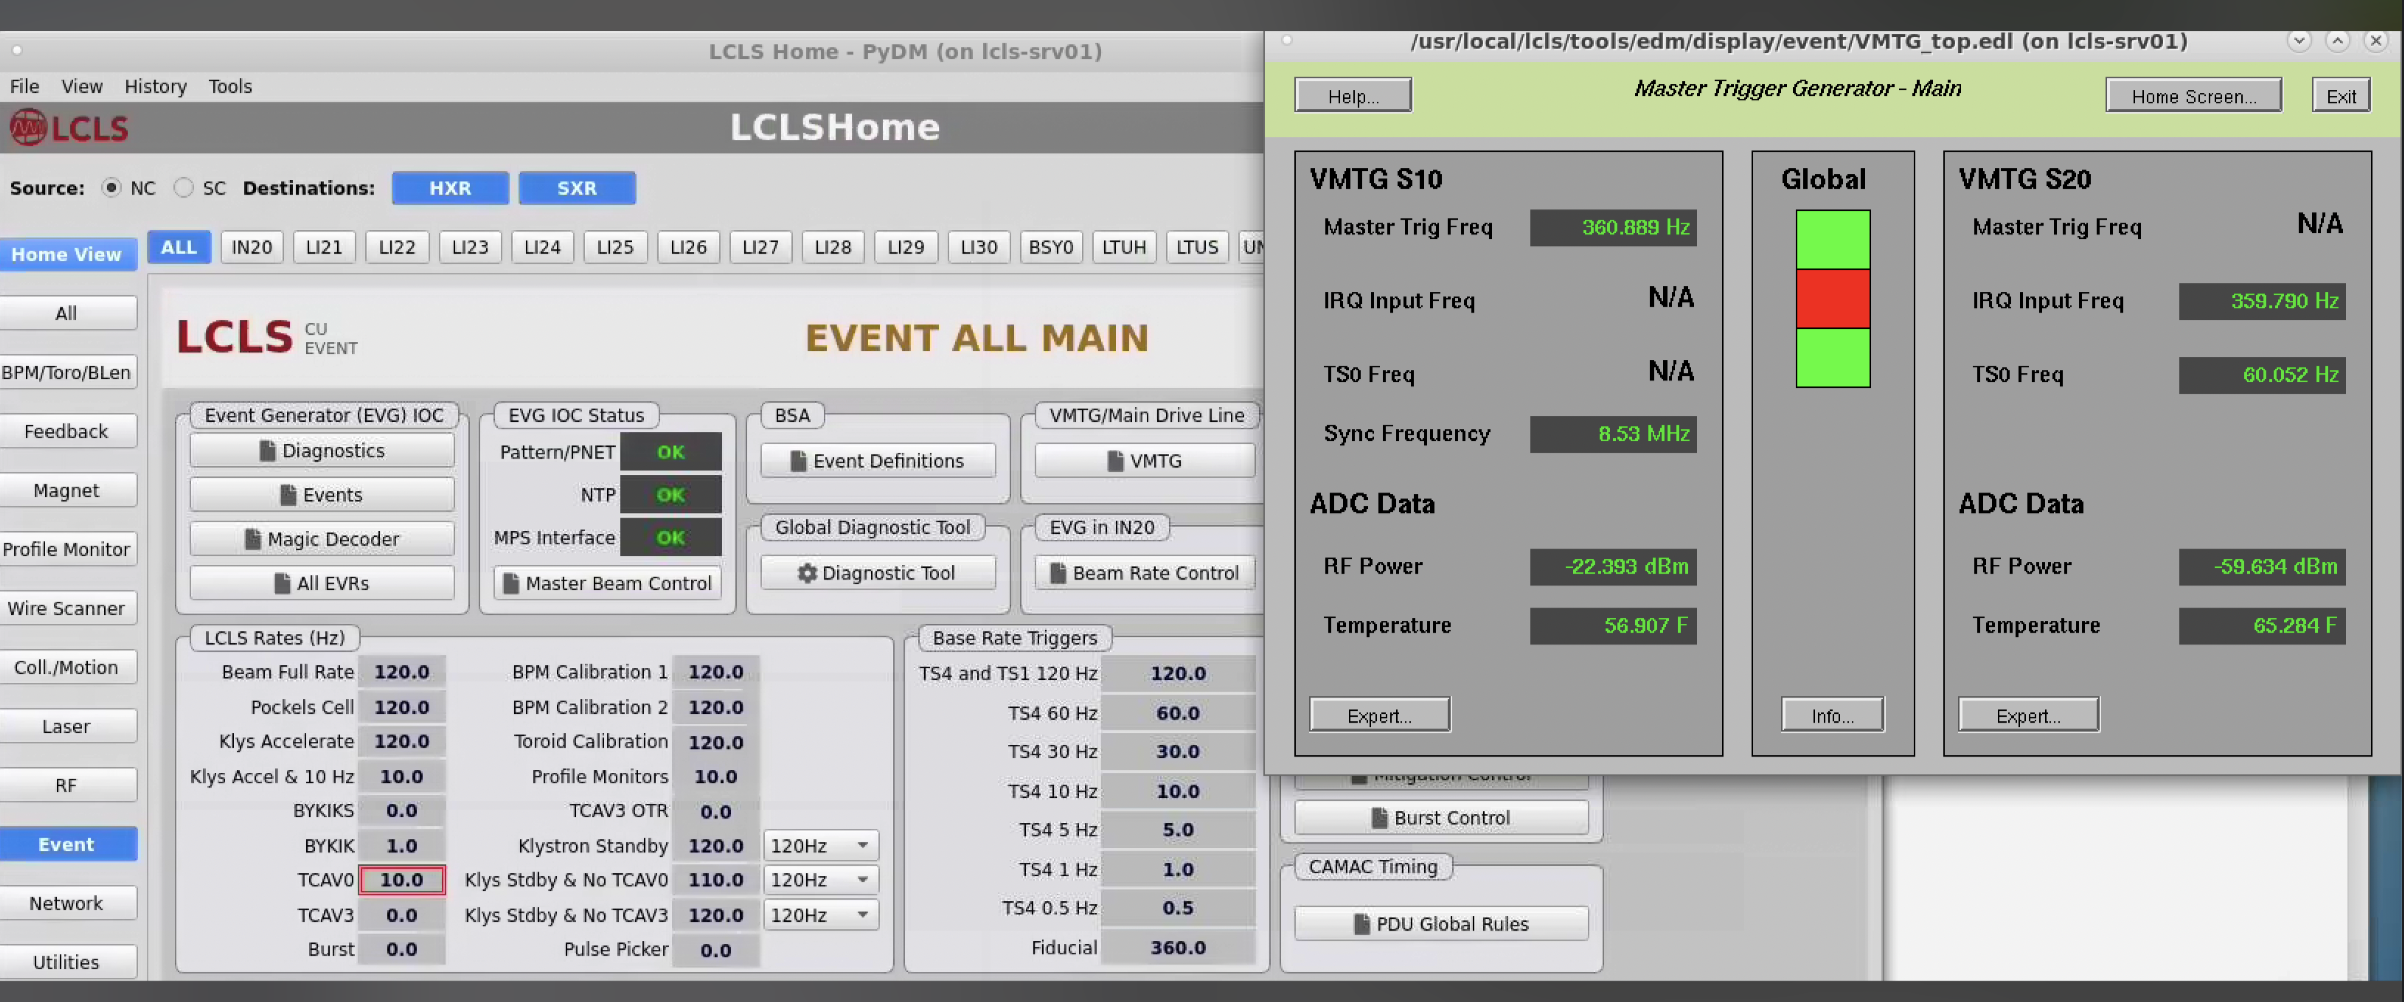
Matt says you can see this with epics on lcls-srv01:
[softegr@lcls-srv01 ~ ]$ caget IOC:GBL0:EV02:SyncFRQMHZ IOC:GBL0:EV02:SyncFRQMHZ 8.44444 |
Here's a screen shot from LCLS home that shows it. I'm just looking at it for the first time. Where it says 8.53 MHz should be 71 kHz.
My first clue was in xpmpva at the very bottom of this tab where it says Fiducial Err
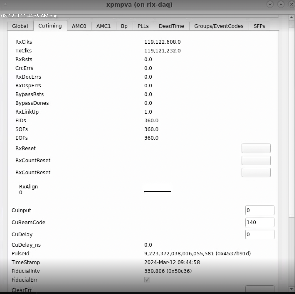
That's a check to make sure that the LCLS1 fiducials are arriving on boundaries of 71kHz (any multiple of 1666 - 119 MHz clocks).
This does not apply to LCLS1 timing, I believe.
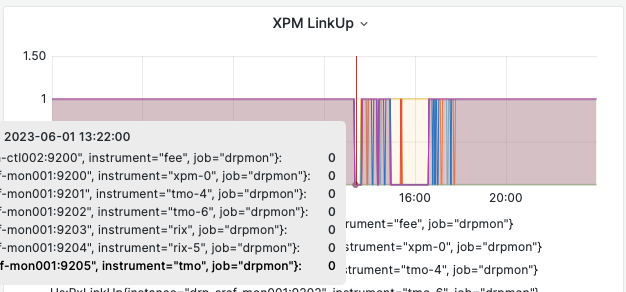
(ps-4.5.26) rix-daq:scripts> caget TPF:GUNB:1:RXLNKUP TPF:GUNB:1:RXLNKUP 1 (ps-4.5.26) rix-daq:scripts> caget TPF:IN20:1:RXLNKUP TPF:IN20:1:RXLNKUP 1 (ps-4.5.26) rix-daq:scripts> caget TPF:LTU0:1:RXLNKUP TPF:LTU0:1:RXLNKUP 1 (ps-4.5.26) rix-daq:scripts> caget TPG:SYS0:1:COUNTBRT TPG:SYS0:1:COUNTBRT 910000 (ps-4.5.26) rix-daq:scripts> |
Can also look for errors from lclshome: select "SC" (top left) "Global" (left of top row) and "Event" (middle of left column) then "Expert Display" on upper right:
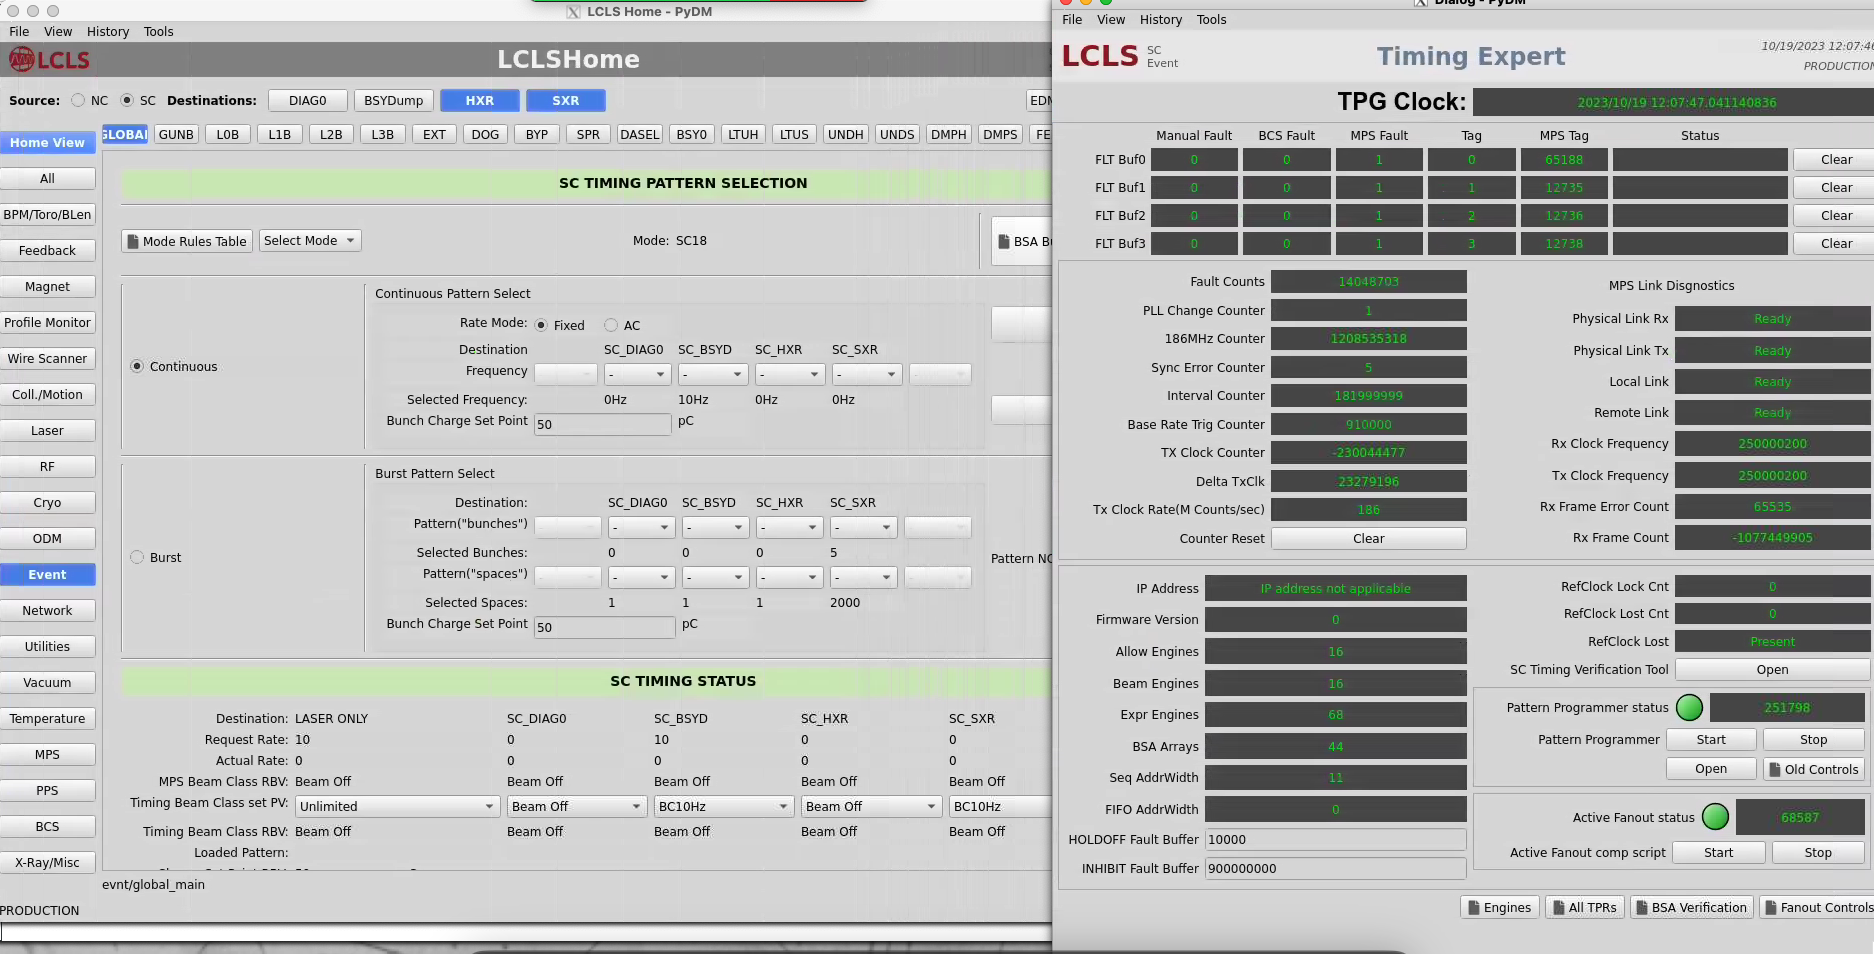
Click on "fanout controls" in lower right. Select "TPF:LTU0:1", on the "Timing Status" tab expect to see 929kHz of "fiducials". This shows an error condition:

The "Link Status" tab rxErrCnts value should be zero (especially for the "In" at the bottom line). This shows an error condition.
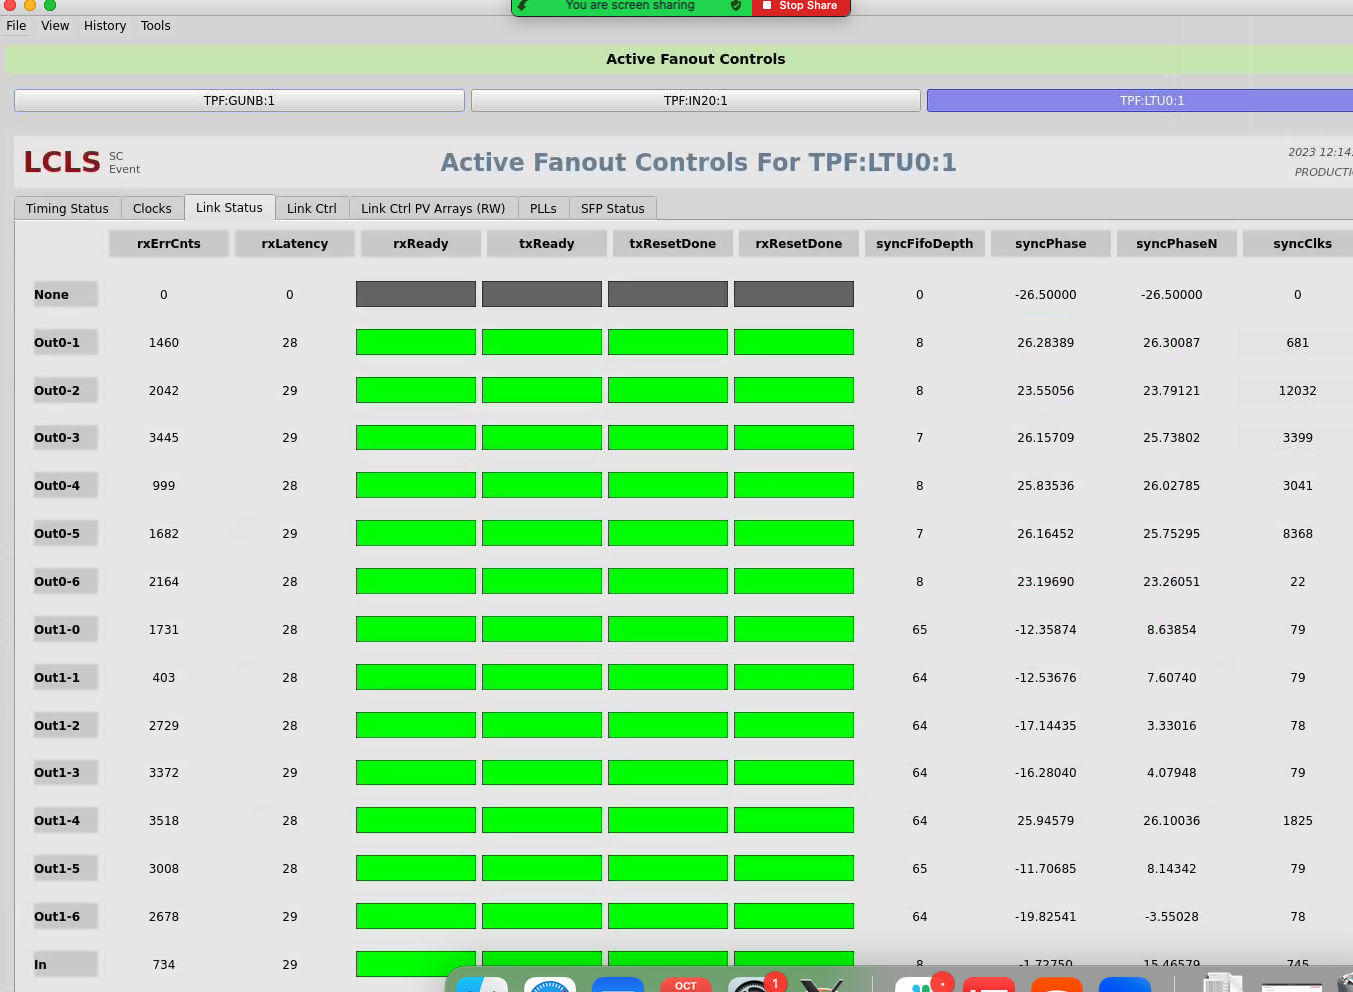
One of these "outs" goes to a local fanout in 208, which then drives xpm0.
See also Matt's timing diagram on this page: Bypass Events
Ric asks: Does XPM:0 govern L0Delay or does XPM:2 for TMO and XPM:3 for RIX do it for each, individually? Matt replies: Whichever is the master of the readout group determines the L0Delay. The other XPMs don't play a part in L0Delay. Only fast detectors (hsd's, wave8's, timing, should have large L0Delay)
(ps-4.3.2) psbuild-rhel7-01:lcls2$ configdb ls tmo/XPM DAQ:NEH:XPM:0 DAQ:NEH:XPM:2 DAQ:NEH:XPM:3 |
To see the names of the shelf managers use this command:
(ps-4.5.17) tmo-daq:scripts> /reg/common/tools/bin/netconfig search shm\* | grep shm shm-tst-lab2-atca02: shm-tst-hp01: shm-tmo-daq01: shm-neh-daq01: shm-rix-daq01: shm-daq-drp01: shm-las-vme-testcrate: shm-daq-asc01: shm-hpl-atca01: shm-las-ftl-sp01: shm-las-lhn-sp01: shm-neh-daq02: shm-fee-daq01: |
On Nov. 16, 2022: "rix" and "tmo" ones are in the hutches. "fee" one is in the FEE alcove (test stand) and the two "neh" ones are in room 208 of bldg 950. daq01 is for the master crate with xpm's, and daq02 is the secondary crate housing fanout module(s).
| name | IP | crate_ID |
|---|---|---|
| shm-tst-hp01 | 172.21.148.89 | no connection |
| shm-tmo-daq01 | 172.21.132.74 | L2SI_0003 |
| shm-neh-daq01 | 172.21.156.26 | 0001 |
| shm-rix-daq01 | 172.21.140.40 | L2SI_0002 |
| shm-daq-drp01 | 172.21.88.94 | no connection |
| shm-las-vme-testcrate | 172.21.160.133 | no connection |
| shm-daq-asc01 | 172.21.58.46 | L2SI_0000 |
| shm-hpl-atca01 | 172.21.64.109 | cpu-b34-bp01_000 |
| shm-las-ftl-sp01 | 172.21.160.60 | needs password to connect |
| shm-las-lhn-sp01 | 172.21.160.117 | needs password to connect |
| shm-neh-daq02 | 172.21.156.127 | L2SI_0002 (should be L2SI_0004) |
| shm-fee-daq01 | 172.21.156.129 | L2SI_0005 |
ATCA SLOT NUMBERING: Matt says they count from 1, with the switch being in slot 1.
Matt says for the NEH system: For slot 2 (this is XPM:0, according to Matt),
source /cds/sw/package/IPMC/env.sh (used to be "source /afs/slac/g/reseng/IPMC/env.sh")fru_deactivate shm-daq-drp01/2fru_activate shm-daq-drp01/2
The following was fixed on 12/6/22:This produces an error which can be ignored, according to Matt:
fru_deactivate shm-daq-drp01/2
ATCA_deactivate: ERROR: CBA_ipmb_cmd failed: rc = 0x9e, 0x10
ERROR - Couldn't connect to IPMC shm-daq-drp01/2
(later: we now think this should work For TMO since "amcc_dump_bsi --all shm-tmo-daq01" seems to work. (old: This doesn't work for the new crate in TMO (don't know why yet), so we have to do):
ssh root@shm-tmo-daq01clia deactivate board 2clia activate board 2
This crate has 2 xpm's at the moment (boards 2 and 3). Can see this with "clia fruinfo board 2".
Then have to restart the base processes so that the timing system can reload it's default constants from the database (e.g. msgdelays which protect the buffering)
For XPMs, AMC-0 is on the right and AMC-1 is on the left. Ports count from right to left as well, I think.
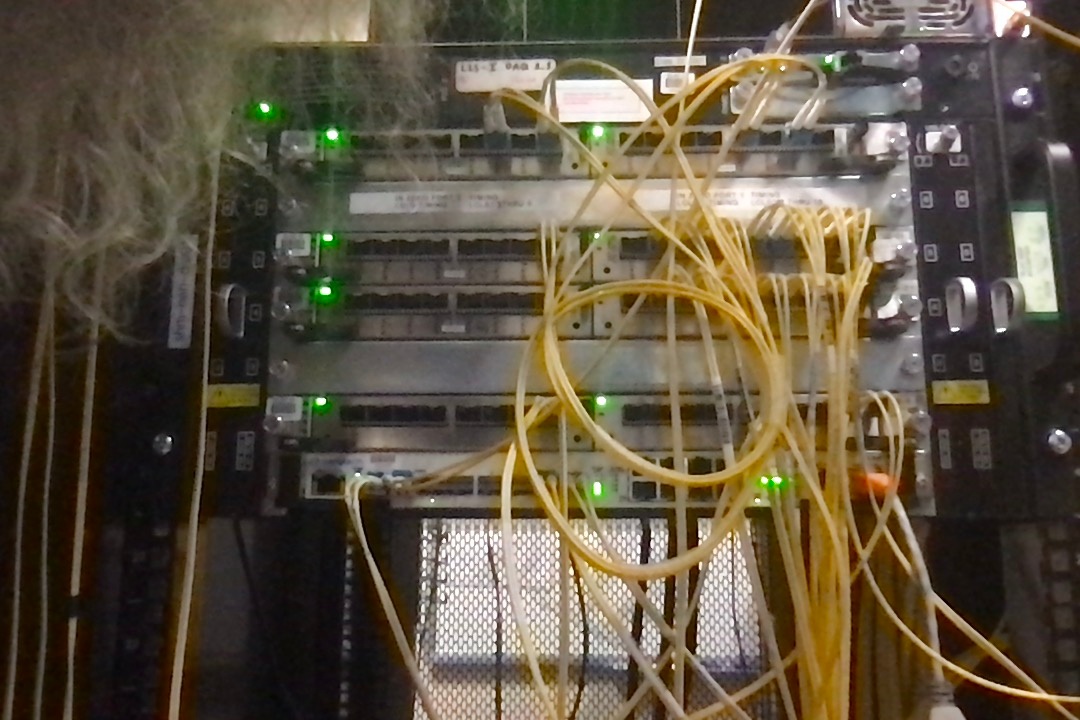
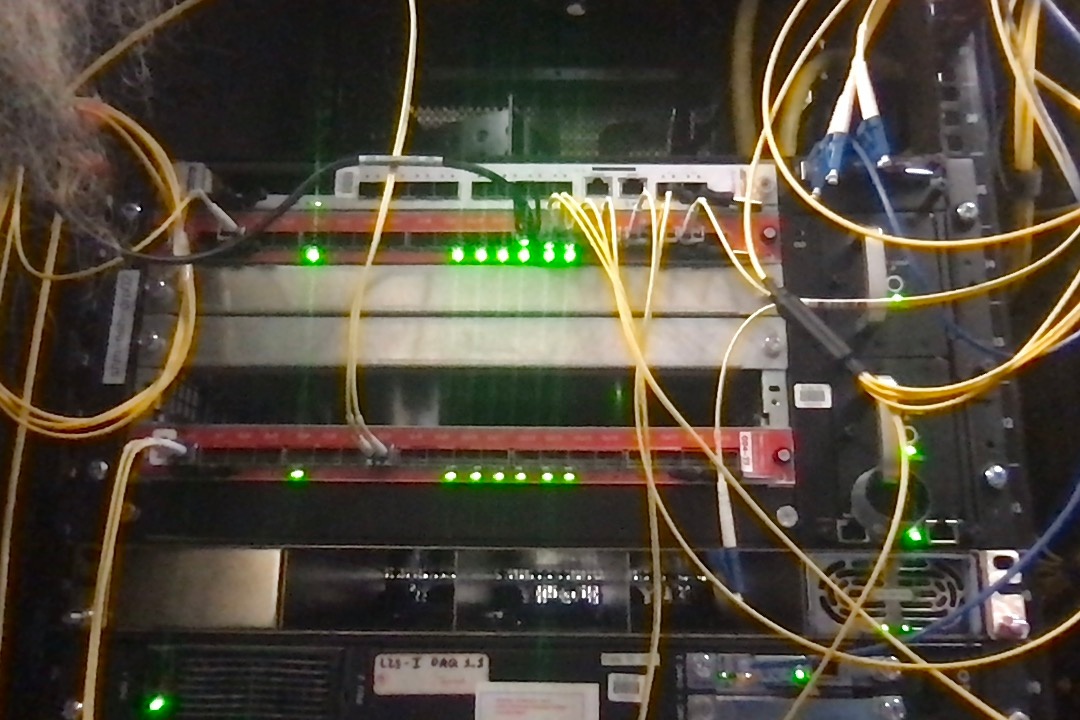
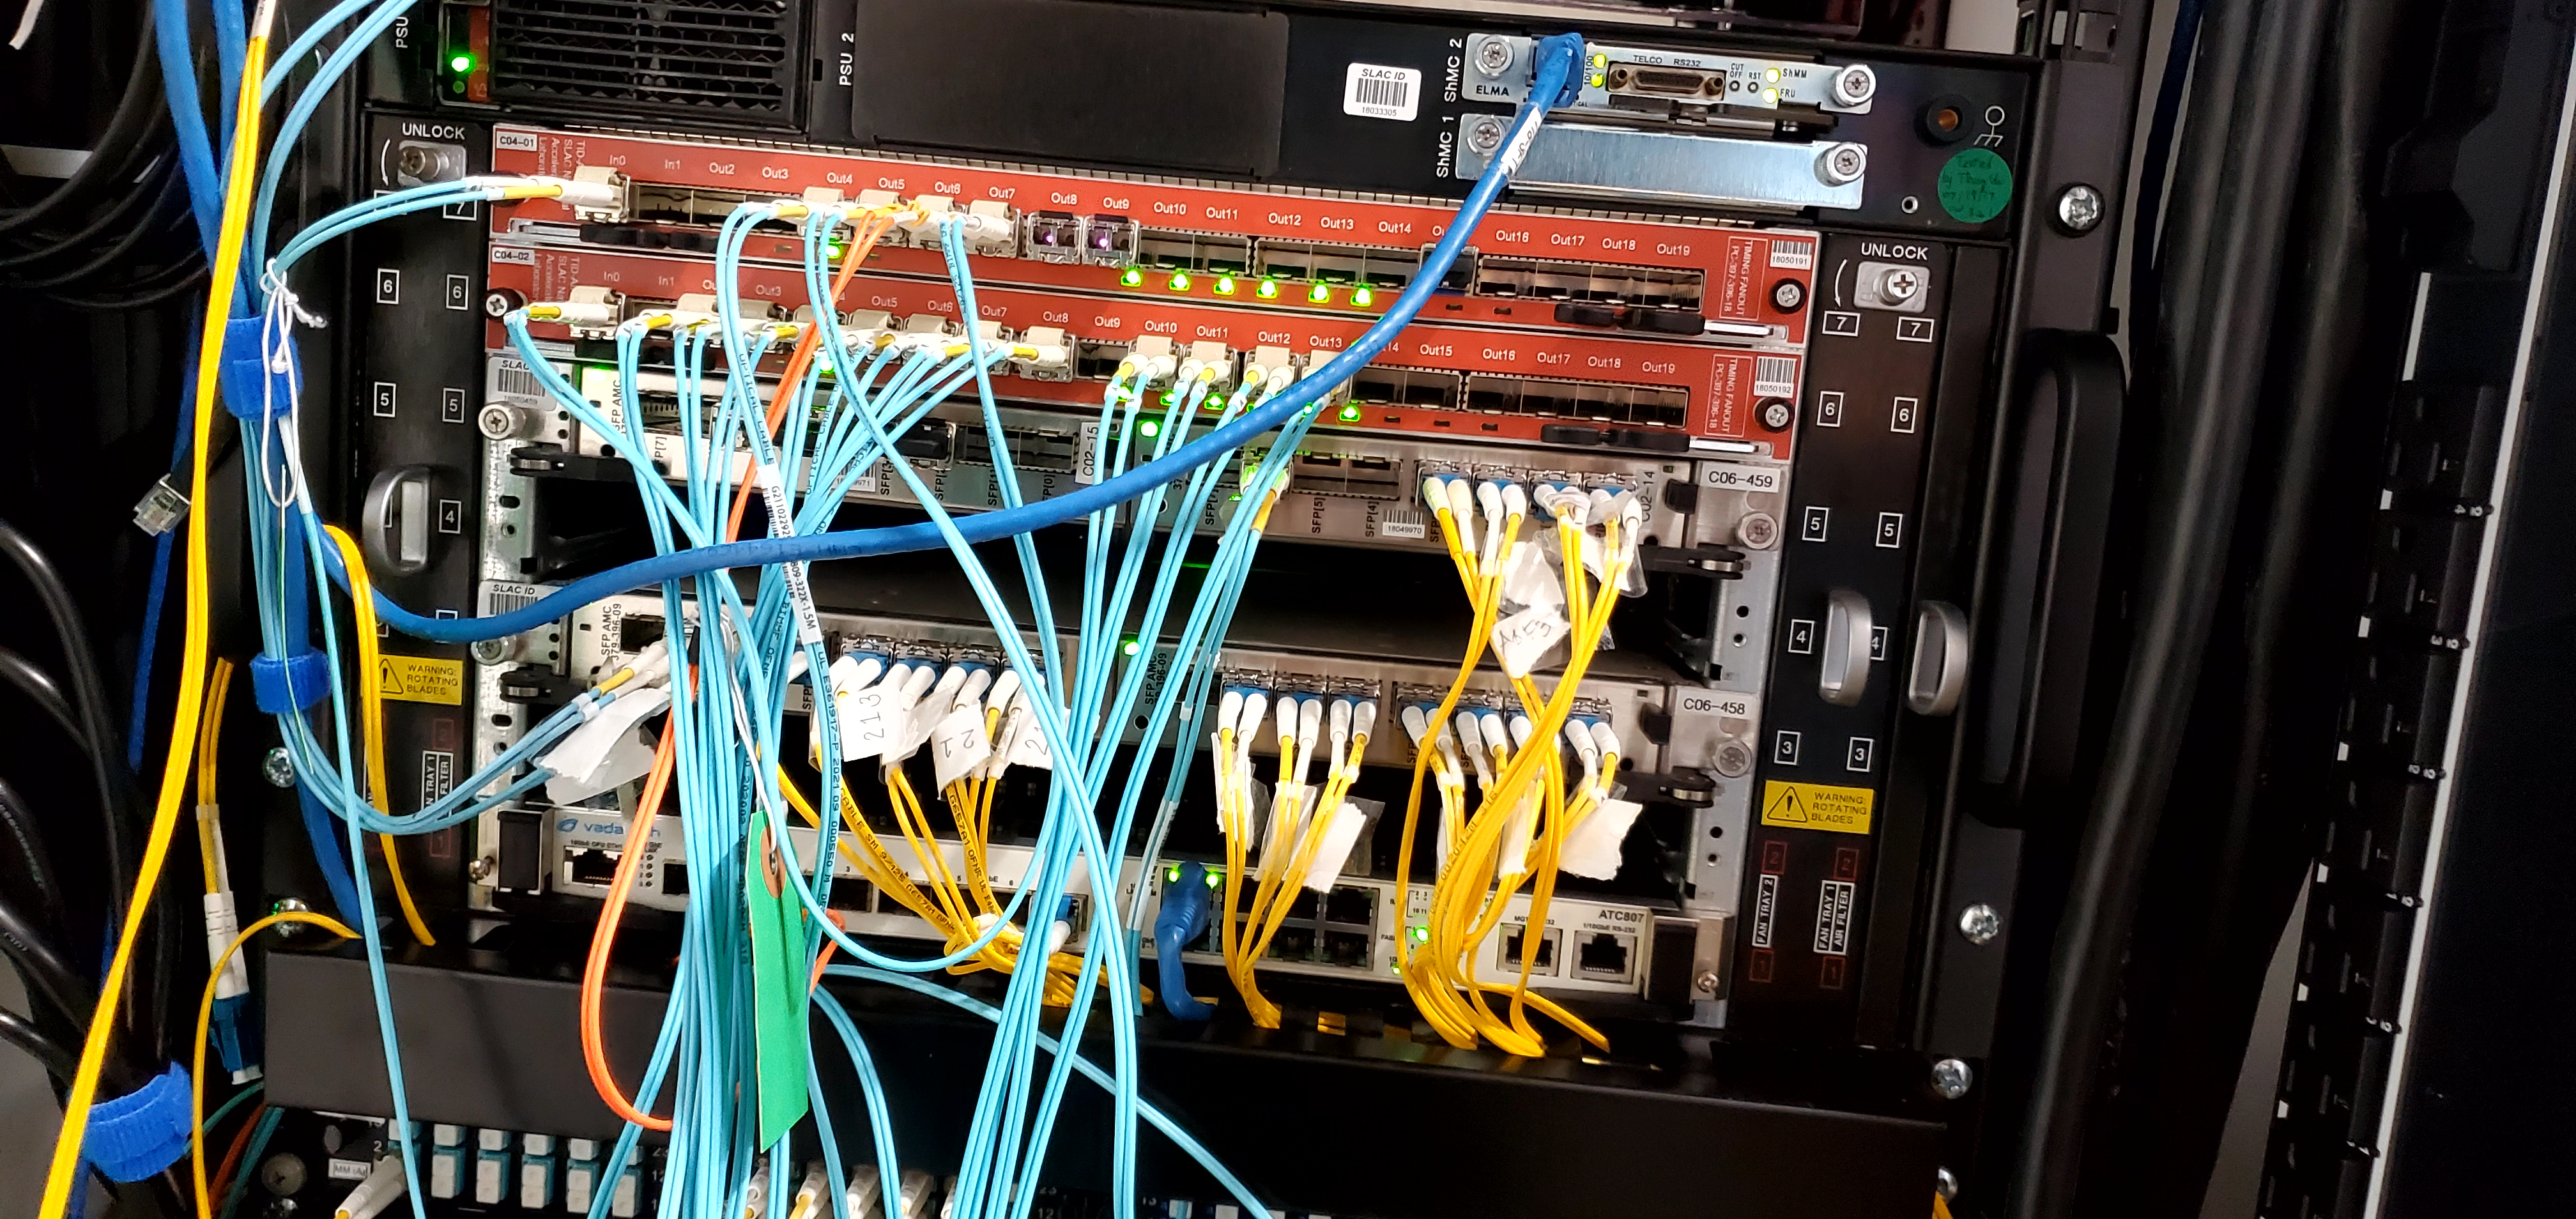
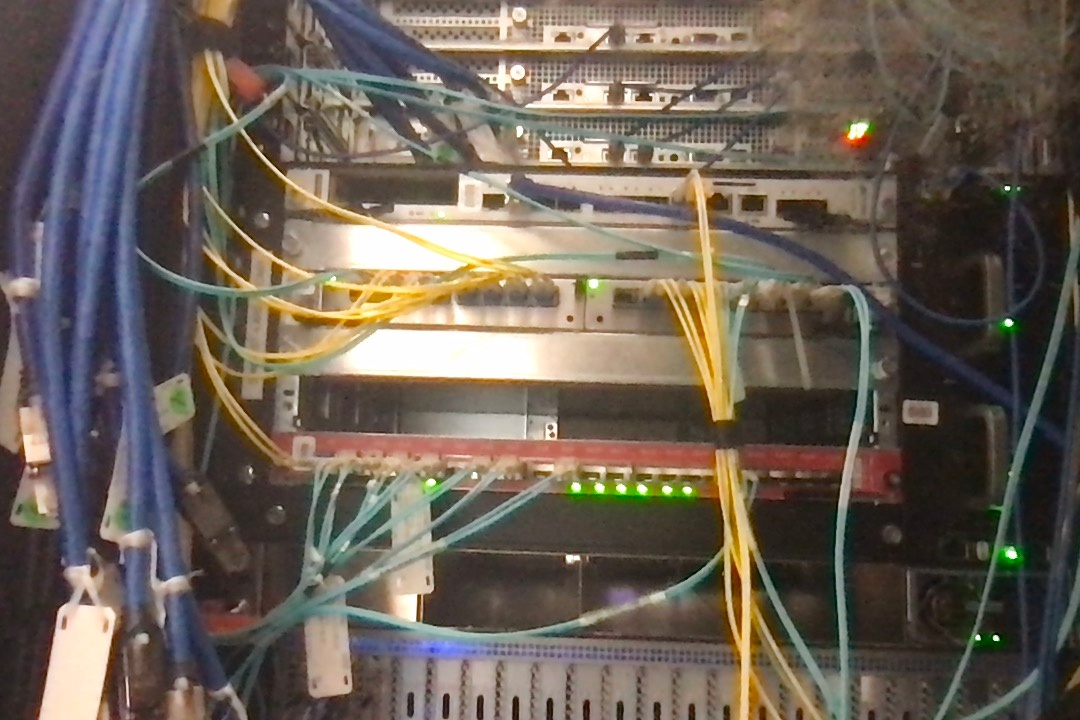
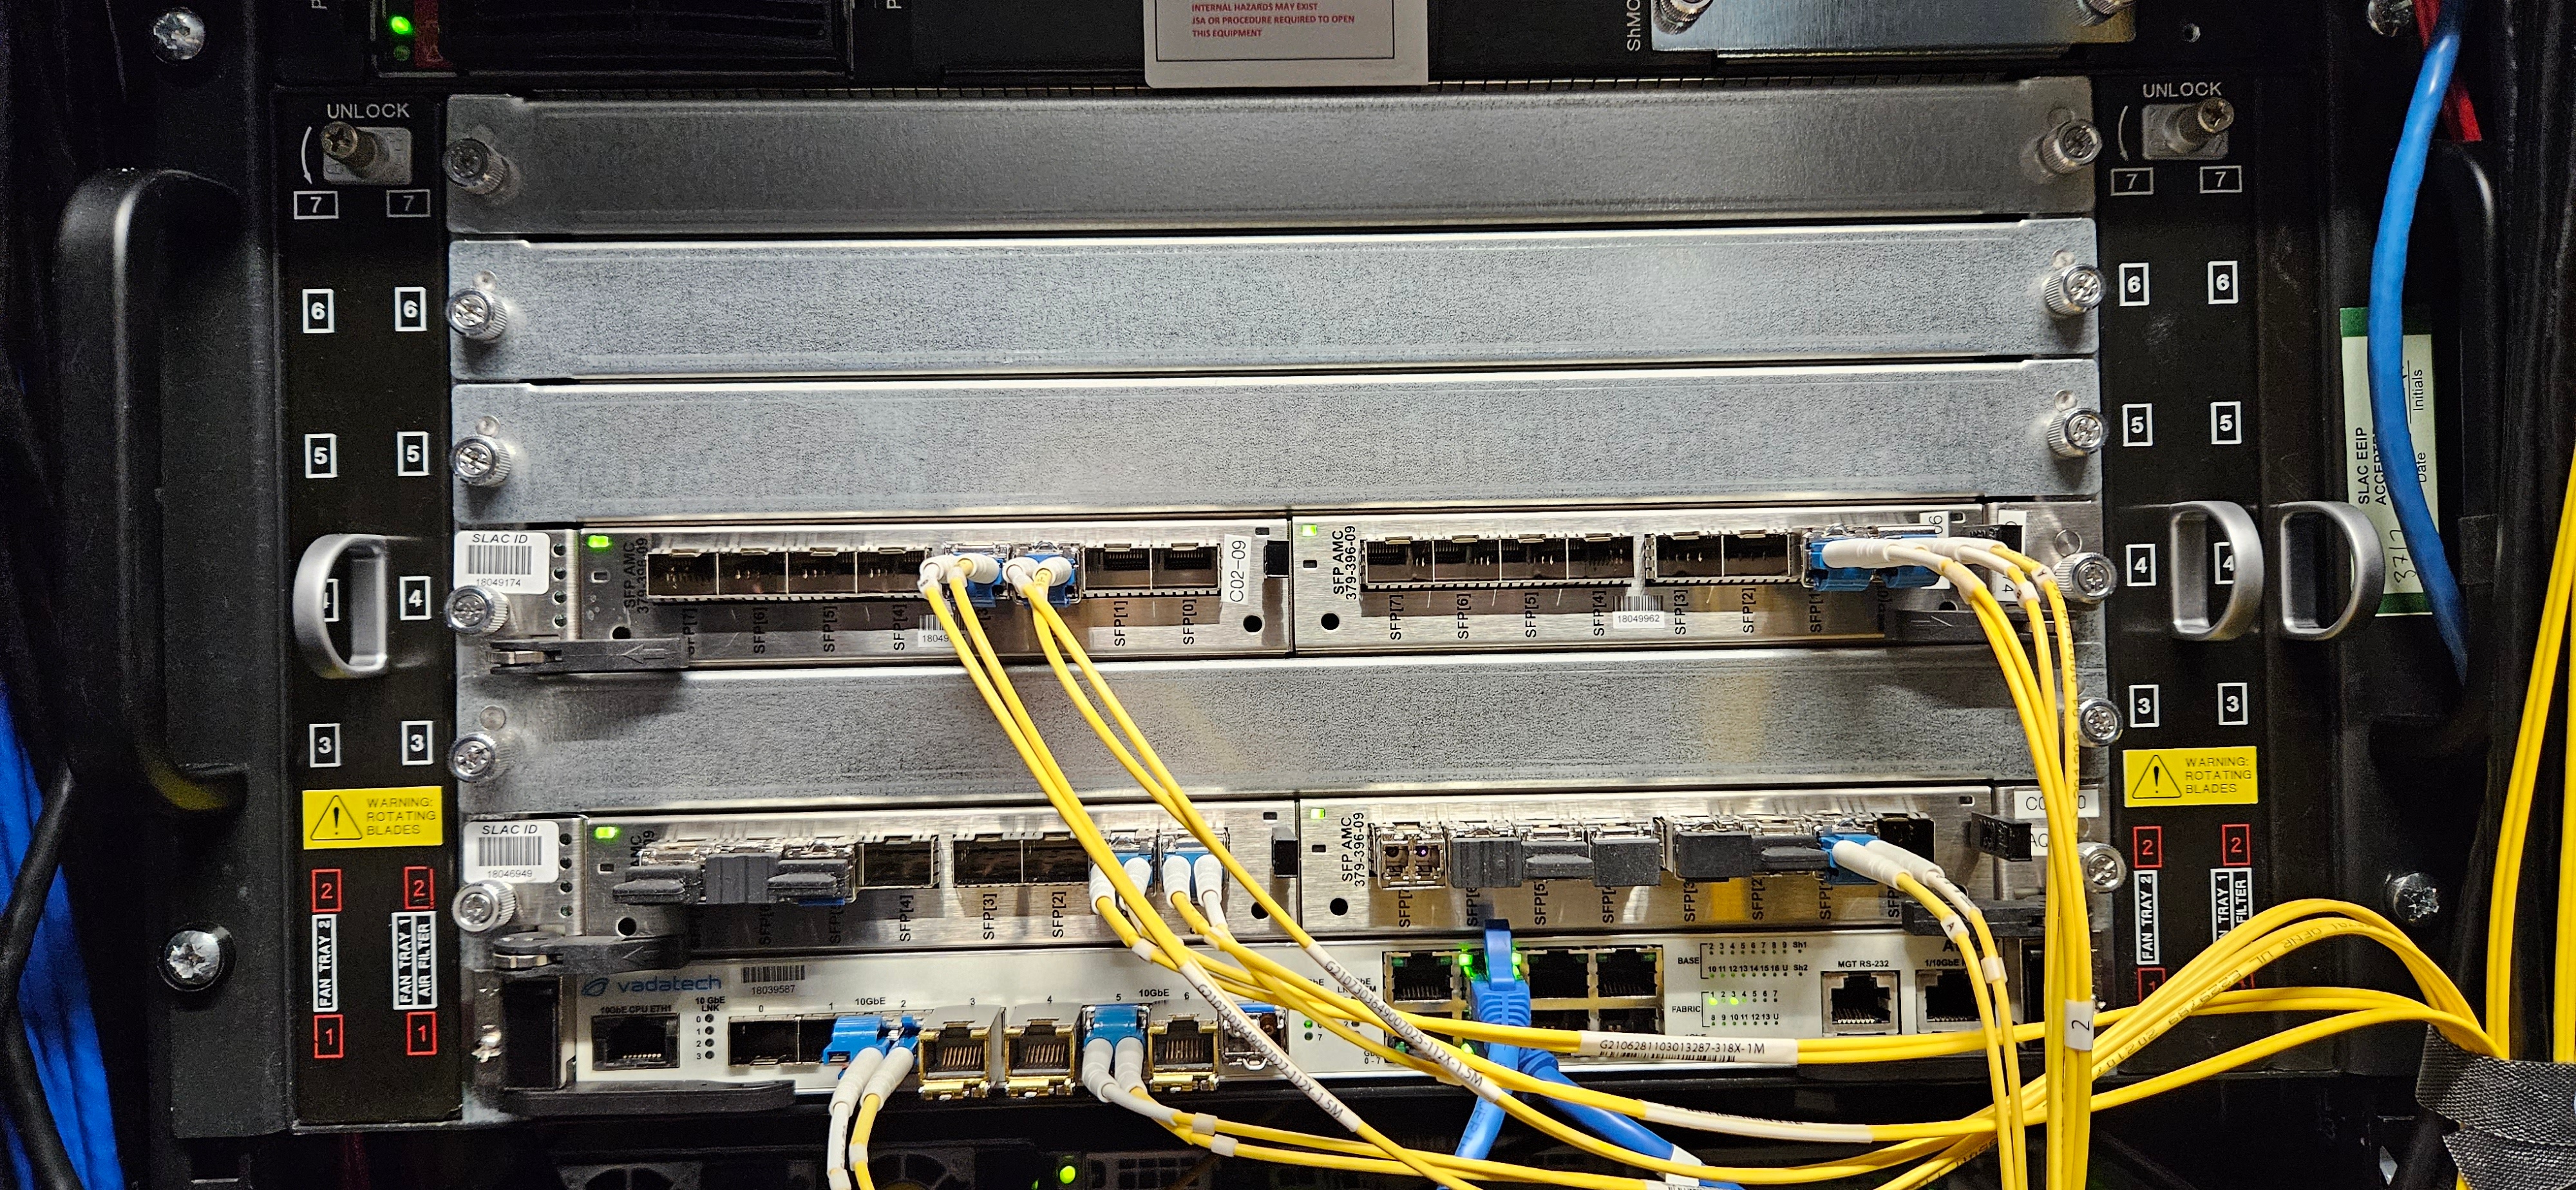
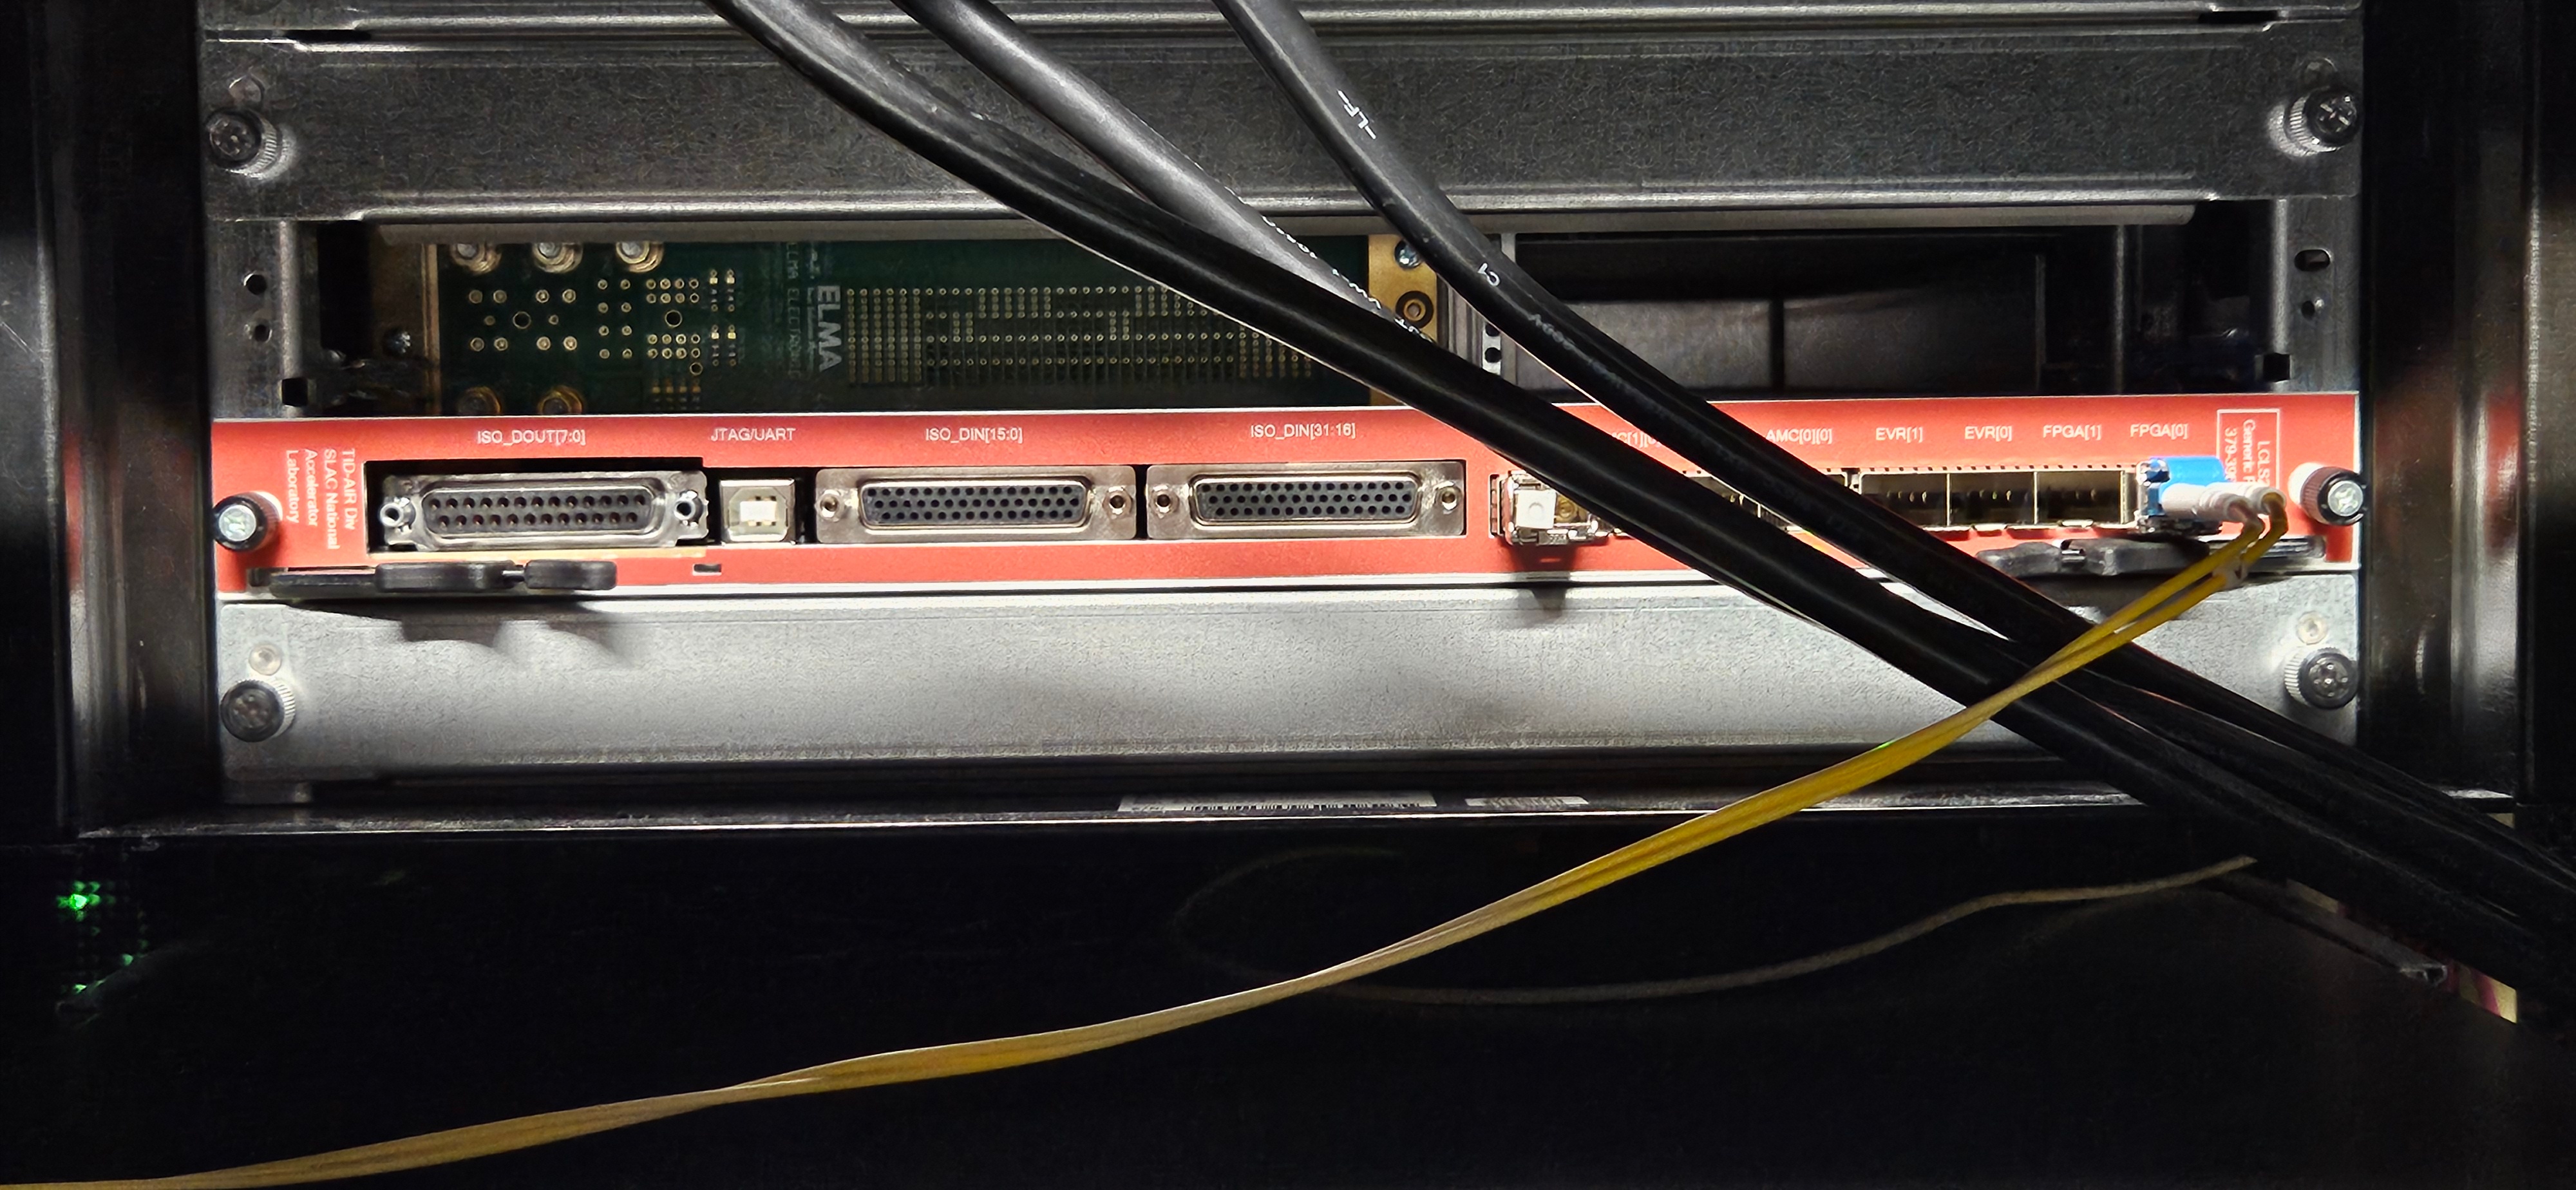
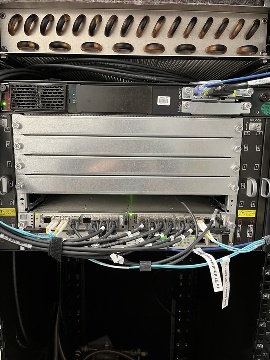
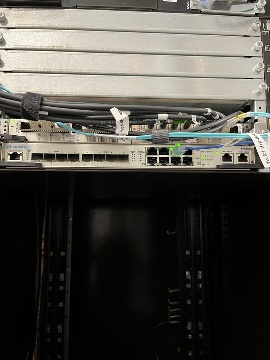
Larry thinks that these are in the raw units read out from the device (mW) and says that to convert to dBm use the following formula: 10*log(10)(val/1mW). For example, 0.6 corresponds to -2.2dBm. The same information is now displayed with xpmpva in the "SFPs" tab.
(ps-4.1.2) tmo-daq:scripts> pvget DAQ:NEH:XPM:0:SFPSTATUS
DAQ:NEH:XPM:0:SFPSTATUS 2021-01-13 14:36:15.450
LossOfSignal ModuleAbsent TxPower RxPower
           0            0  6.5535  6.5535
           1            0  0.5701  0.0001
           0            0  0.5883  0.7572
           0            0  0.5746  0.5679
           0            0  0.8134   0.738
           0            0  0.6844    0.88
           0            0  0.5942  0.4925
           0            0  0.5218  0.7779
           1            0   0.608  0.0001
           0            0  0.5419  0.3033
           1            0  0.6652  0.0001
           0            0  0.5177  0.8751
           1            1       0       0
0 0 0.7723 0.201 |
From Matt. He says the current production version (which still suffers from xpm-link-glitch storms) is 0x030504. The git repo with firmware is here:
https://github.com/slaclab/l2si-xpm
Please remember to stop the pyxpm process associated with the xpm before proceeding.
Connect to tmo-daq as tmoopr and use procmgr stop neh_base.cnf pyxpm-xx.
ssh drp-neh-ctl01. (with ethernet access to ATCA switch: or drp-srcf-mon001 for production hutches) ~weaver/FirmwareLoader/rhel6/FirmwareLoader -a <XPM_IPADDR> <MCS_FILE>. (binary copied from afs) ssh psdev source /cds/sw/package/IPMC/env.sh fru_deactivate shm-fee-daq01/<SLOT> fru_activate shm-fee-daq01/<SLOT> The MCS_FILE can be found at: /cds/home/w/weaver/mcs/xpm/xpm-0x03060000-20231009210826-weaver-a0031eb.mcs /cds/home/w/weaver/mcs/xpm/xpm_noRTM-0x03060000-20231010072209-weaver-a0031eb.mcs |
In Jan. 2023 Matt saw a failure mode where xpmpva showed 2kHz fiducial rate instead of the expected 930kHz. This was traced to an upstream accelerator timing distribution module being uninitialized.
In April 2023, DAQs run on SRCF machines had 'PGPReader: Jump in complete l1Count' errors. Matt found XPM:0 receiving 929kHz of fiducials but only transmitting 22.5kHz, which he thought was due to CRC errors on its input. Also XPM:0's FbClk seemed frozen. Matt said:
I could see the outbound fiducials were 22.5kHz by clicking one of the outbound ports LinkLoopback on. The received rate on that outbound link is then the outbound fiducial rate.
At least now we know this error state is somewhere within the XPM and not upstream.
The issue was cleared up by resetting XPM:0 with fru_deactivate/activate to clear up a bad state.
Note that when the XPMs are in a good state, the following values should be seen:
If RxRcv/RxErr frames are stuck in xpmpva it may be that the network interface to the ATCA crate is not set up for jumbo frames.
If XPM links don't lock, here are some past causes:
Saw this error on Nov. 2 2021 in lab3 over and over:
WARNING:pyrogue.Device.UdpRssiPack.rudpReg:host=10.0.2.102, port=8193 -> Establishing link ... |
Matt writes:
That error could mean that some other pyxpm process is connected to it. Using ping should show if the device is really off the network, which seems to be the case. You can also use "amcc_dump_bsi --all shm-tst-lab2-atca02" to see the status of the ATCA boards from the shelf manager's view. (source /afs/slac/g/reseng/IPMC/env.sh[csh] or source /cds/sw/package/IPMC/env.sh[csh]) It looks like the boards in slots 2 and 4 had lost ethernet connectivity (with the ATCA switch) but should be good now. None of the boards respond to ping, so I'm guessing its the ATCA switch that's failed. The power on that board can also be cycled with "fru_deactivate, fru_activate". I did that, and now they all respond to ping.
NOTE: these instructions only apply for XPM boards running "xtpg" firmware. This is the only version that supports internal timing for the official XPM boards. It has a software-selectable internal/external timing using the "CuInput" variable. KCU1500's running the xpm firmware have a different image for internal timing with "Gen" in the name (see /cds/home/w/weaver/mcs/xpm/*Gen*, which currently contains only a KCU1500 internal-timing version).
If the xpm board is in external mode in the database we believe we have to reinitialize the database by running:
python pyxpm_db.py --inst tmo --name DAQ:NEH:XPM:10 --prod --user tmoopr --password pcds --alias XPM
CuInput flag (DAQ:NEH:XPM:0:XTPG:CuInput) is set to 1 (for internal timing) instead of 0 (external timing with first RTM SFP input, presumably labelled "EVR[0]" on the RTM, but we are not certain) or 3 (second RTM SFP timing input labelled "EVR[1]" on the RTM).
Matt says there are three types of XPM firmware: (1) an XTPG version which requires an RTM input (2) a standard XPM version which requires RTM input (3) a version which gets its timing input from AMC0 port 0 (with "noRTM" in the name). The xtpg version can take lcls1 input timing and convert to lcls2 or can generate internal lcls2 timing. Now that we have switched the tmo/rix systems to lcls2 timing this version is not needed anymore: the "xpm" firmware version should be used. The one exception is the detector group running in MFX from LCLS1 timing which currently uses xpm7 running xtpg firmware.
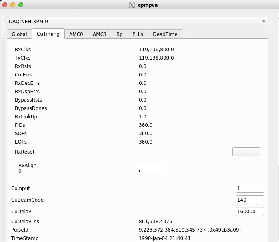
This file puts xpm-0 in internal timing mode: https://github.com/slac-lcls/lcls2/blob/master/psdaq/psdaq/cnf/internal-neh-base.cnf. Note that in internal timing mode the L0Delay (per-readout-group) seems to default to 90. Fix it with pvput DAQ:NEH:XPM:0:PART:0:L0Delay 80".
One should switch back to external mode by setting CuInput to 0 in xpmpva CuTiming tab. Still want to switch to external-timing cnf file after this is done. Check that the FiducialErr box is not checked (try ClearErr to see if it fixes). If this doesn't clear it can be a sign that ACR has put it "wrong divisor" on their end.
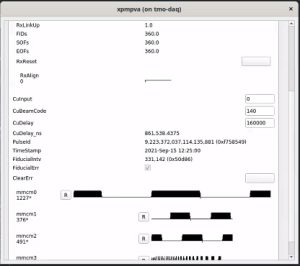
For now (09/20/21) this procedure should also be used to start the system in external timing mode. To summarize, from Matt:
There are at least two varieties of RTM: one with many lemo connectors and one with multipin connectors. The order of the timing fiber inputs on the two is reversed. In both cases for lcls2 timing the fiber should be plugged into the input labelled FPGA[0] for firmware images that get timing from the RTM (see above xpm firmware section).
NOTE: We believe we can't make coupled-deadtime work in an ideal way as described here: Bypass Events
Matt has implemented "coupled" readout-group dead time behavior on the XPMs (can be enabled/disabled with register settings). This behavior is done this way to ensure that Ric's TEB is always guaranteed to get a highest-rate readout group in every event, which dramatically simplifies his TEB system design. The trigger decision ("Tr") works like this for 3 readout groups, highlighting the cases when (a) the highest-rate readout group is full and (b) one of the lower rate readout groups is full, both when that group wants to readout and doesn't want to readout.
1 RRRRRRRRFRRR 2 R R FfR R 3 R R R Tr TTTTtTTTDTTT Time goes to the right 1-3: readout groups Tr: the trigger decision R = Readout group can readout F = Readout group is full and wants to readout f = Readout group is full but doesn't want to readout T = Trigger all readout groups that want to readout t = Trigger subset of readout groups that are not full D = No trigger generated (Dead) |
This behavior is accomplished in the current XPM implementation by setting the following (child group) PVS : $master:PART:2:L0Groups = (1<<$parent), $master:PART:3:L0Groups = (1<<$parent), $master is XPM:NEH:XPM:2 and $parent is group 1 for instance. This can be done in control.py or Timing segment level.
Update: Support for the above was added to control.py and pushed to the git repo on 3/10/22.
NOTE: If we couple all readout-group deadtime then we don't learn how many high-rate shots we drop with integrating detectors, but Matt suggests putting in a counter in the timing stream that counts the number of deadtimed-events and attaches that counter to the data stream when it can readout: the counter will often be zero, but will be non-zero in the case where we have deadtime. Matt points out that MPS can effectively change the rate of beam, so we can't depend on a fixed-rate beam.
PROPOSAL: Couple all readout deadtime which is conservative (like BaBar) and see how we do. LATER: Matt thought about this and we can't make it work as described here: Bypass Events.
The XPM may be instructed to require a transition to obey deadtime by including bit 7 (OR 1<<7) when writing to the "MsgHeader" PV. Ordinarily, just the TransitionId is written to this PV.
Also see Matt's page on Sequence Programming and the LCLS2 Timing page for users.
The XPM may be configured to insert event codes 256-287 into the timing stream. Four event codes are generated by each sequence engine within the XPM. The XPM has 4 sequence engines allowing 16 event codes total.
| Engine | Event Codes |
|---|---|
| 0 | 256-259 |
| 1 | 260-263 |
| 2 | 264-267 |
| 3 | 268-271 |
| 4 | 272-275 |
| 5 | 276-279 |
| 6 | 280-283 |
| 7 | 284-287 |
A current example for doing this is done by executing:
(ps-4.5.24) bash-4.2$ python psdaq/psdaq/seq/seqprogram.py -h
usage: seqprogram.py [-h] --pv PV --seq SEQ [SEQ ...] [--start] [--verbose]sequence pva programming
optional arguments:
-h, --help show this help message and exit
--pv PV sequence engine pv; e.g. DAQ:NEH:XPM:0
--seq SEQ [SEQ ...] sequence engine:script pairs; e.g. 0:train.py
--start start the sequences
--verbose verbose output(ps-4.5.24) bash-4.2$ python psdaq/psdaq/seq/seqprogram.py --seq 4:psdaq/psdaq/seq/33k_35k.py --pv DAQ:NEH:XPM:2
The event codes generation by an XPM may be queried via a status PV.
(ps-4.5.24) bash-4.2$ pvget DAQ:NEH:XPM:6:SEQCODES
DAQ:NEH:XPM:6:SEQCODES 2023-01-19 10:35:20.971
EventCode Description Rate
272 "33kHz base" 33164
273 "35kHz base" 35715
274 0
275 0
276 0
277 0
278 0
279 0
280 0
281 0
282 0
283 0
284 0
285 0
286 0
287 0
This information is now displayed with xpmpva in the Groups/EventCodes tab. In this display, the upstream XPMs are also queried to find the source of the event codes visible to the displayed XPM.
In xpmpva one can sometimes see unusual numerical (vs. string) ID's. Matt thinks 10080 is a fanout, and eeee0000 might be a tpr.
NOTE: when setting up an opal, the LCLS2 timing comes in on lane 1 (counting from zero) on the second QSFP, as described here: https://github.com/slaclab/cameralink-gateway.
NOTE: we have an intermittent power-on deadlock: when powering on the opal/feb-box (front-end-board) the LED on the FEB box will stay red until the DAQ has configured it, when it will turn green. Sometimes it affects the "@ID?" and "@BS?" registers and the DAQ will crash (hence the deadlock). We should tolerate ID/BS registers not working when drp executable starts. This lack of configuration is fixable by loading a rogue yaml config file included in the cameralink-gateway git repo by going to the software directory and running with enableConfig=1 like this: "python scripts/devGui --pgp4 0 --laneConfig 0=Opal1000 --pcieBoardType Kcu1500 --enLclsII 1 --enableConfig 1 --startupMode 1"
NOTE: qsfp0 is "away" from the usb jtag connector while qsfp1 is "close" to the usb jtag connector.
Larry's instructions are here:
https://github.com/slaclab/cameralink-gateway#example-of-starting-up-opal1000
running standalone rogue gui (NOTE: remove --enVcMask 0 if you want to talk to the FEB):
python scripts/devGui --pgp4 0 --laneConfig 0=Opal1000 --pcieBoardType Kcu1500 --enLclsII 1 --enableConfig 0 --startupMode 1 --enVcMask 0
NOTE: it can be very useful to check ClinkPcie.AxiPcieCore.AxiVersion (kcu1500) and ClinkFeb[0].AxiVersion (cameralink converter box) to see if the kcu can talk to the front-end-board (FEB).
programming KCU:
python software/scripts/updatePcieFpga.py --path /reg/neh/home/cpo/junk/
warnings reprogramming FEB fpga:
(note it looks like we use the "1ch" firmware for opal since it's base camlink?)
(rogue_pre-release) [cpo@lcls-pc83236 software]$ python software/scripts/updateFebFpga.py --mcs ~/ClinkFebPgp2b_1ch-0x02000000-20191210103130-ruckman-d6618cc.mcs --lane 0 --pgp4 0
https://github.com/slaclab/rogue
Top LED: Red: no PGP link, Green: good PGP2 link, Blue: good PGP4 link
Bottom LED: Green: good camlink, Red: bad camlink
If you see failed register reads from the FEB like this, it could be that the FEB firmware is out of date, since register maps change between firmware versions:
rogue.GeneralError: Block::checkTransaction: General Error: Transaction error for block ClinkDevRoot.ClinkFeb[0].ClinkTop.Ch[0].FrameSize with address 0x0010012c. Error Non zero status message returned on fpga register bus in hardware: 0x3 |
See the notes on this page: Two Phase Transitions
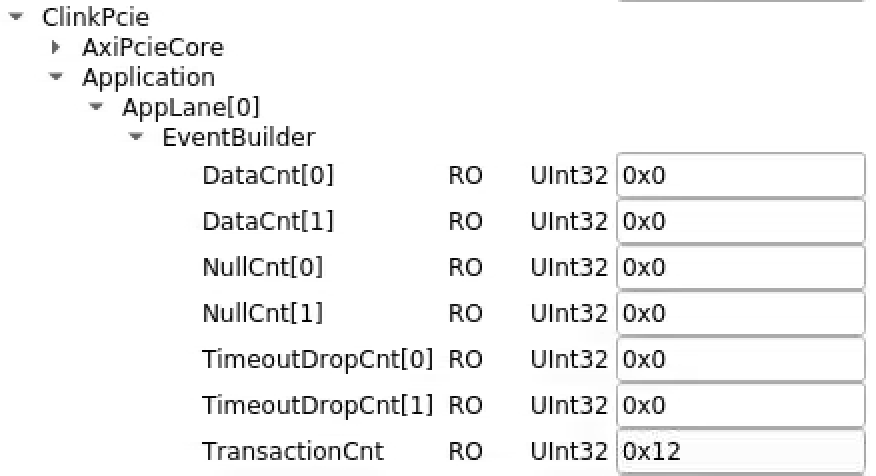
In groupca window "transitions" tab send configure transitions. In rogue devGui see ClinkPcie->Application->AppLane[0]->EventBuilder→TransactionCnt increase with each one.
After turning off ClinkDevRoot→PollEn in devGui, sending two configure transitions can see the following change in "cat /proc/datadev_0" (output of "diff"):
< Hw Dma Wr Index : 3560 < Sw Dma Wr Index : 3560 --- > Hw Dma Wr Index : 3562 > Sw Dma Wr Index : 3562 43c43 < Tot Buffer Use : 105960 --- > Tot Buffer Use : 105962 |
Run pgpread and send transitions with groupca. For configure transitions should see something like this:
(ps-4.5.0) drp-tst-dev004:lcls2$ psdaq/build/drp/pgpread -d /dev/datadev_0 -c 1 -r device /dev/datadev_0 dmaCount 1028 dmaSize 16384 EventBatcherHeader: vers 1 seq 14 width 2 sfsize 32 Size 48 B | Dest 0 | Transition id 2 | pulse id 9026296791400 | event counter 16 | index 143 env 02200010 EventBatcherHeader: vers 1 seq 15 width 2 sfsize 32 Size 48 B | Dest 0 | Transition id 2 | pulse id 9026298152624 | event counter 17 | index 144 env 02220010 |
In one case Matt looked and found that the TimingRx counters were all stuck. He also noticed that the TimingPhyMonitor.RxRstStatus was reading 1, so the reset on the timing receiver was not clearing. He was able to get it to clear by enabling miniTpg mode (and then disabling to get back to normal operation). In the past, this was instead solved by switching to LCLS-I timing and then back to LCLS-II
https://github.com/slaclab/cameralink-gateway#pgp-channel-mapping
Look in Hsio->PgpRxAxisMon[0]->Ch[1]->FrameCnt to see frames from FEB.
Ch[0] is register for FEB
Ch[2] is the UART
ClinkPcie->Application->AppLane[0]->EventBuilder->DataCnt[0] increments with EITHER a trigger message or a transition message
DataCnt[1] increments when we have camera data. Should be equivalent to the PGP FrameCnt above
Above only increment after the event-builder has done its job
Setting Bypass to 1 turns off the event builder (bit mask, per-lane):
bit 0 to 1 bypasses timing
bit 1 to 1 bypasses the camera
tdest lane mapping:
https://github.com/slaclab/cameralink-gateway/blob/master/firmware/common/rtl/AppLane.vhd#L109-L111
Tried hitting
Commands->ClinkDevRoot->ClinkPcie->Application->Applane[0]->Eventbuilder->CntRst
didn't help
NOTE: to see the XpmPause register below it is important to startup devGui as shown above (so the right XPM registers get enabled).
When we get struck
TriggerEventBuffer[0]=>FifoPause goes True
TriggerEventBuffer[0]=>XpmPause goes True
setting EventBuilder->Blowoff True resets
Using groupca to send a transition causes these under Hsio->TimingRx->TriggerEventManager:
TriggerEventBuffer[0]=>TransitionCount to increment, and
TriggerEventBuffer[0]=>FifoWrCount to increment
XpmOverflow=True is latched version of FifoOverflow. Need ClearReadout to reset.
Check that TrigerEventBuffer[0]->Partition is set to right readout group
Try toggling between XpmMini and LCLS2 timing: I think this fixed the kcu1500→XPM link not locking one time.
Check TimingRx->RimingFrameRx->RxLinkUp is 0x1 (link to XPM)
Check Hsio->PgpMon[0]→RemLinkReady=True (link to FEB, I think)
Check ClinkTop→LinkLockedA=True (link to opal)
Check ClkInFreq and ClinkClkFreq are 80Mhz (camlink frequencies)
ClinkTop->Ch[0]:
LinkMode Base
DataMode 12Bit
FrameMode Frame
TapCount 0x2
DataEn True
BaudRate 57600
FrameCount increments with L1Accepts, but not if deadtime.
ClinkTop→TrigCtrl[0]:
TrigCnt counts, but not if dead time.
Tried hitting all the resets on the rogue GUI's "commands" tab (CntRst, TimerRst, HardRst, SoftRst) but didn't help with 100% deadtime. Powercycling the KCU1500 node. After that the XPM link wouldn't lock at all. Was able to get it to re-lock by hitting the resets here ... wasn't watching the right column on xpmpva, so I don't know which one did the trick (but a second power-cycle later on suggests tat it was the TxPhyReset):
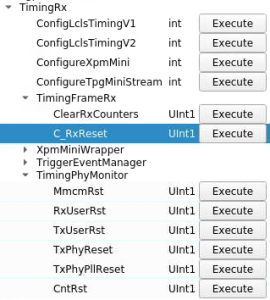
Run pgpread like this (-c 1 says to use virtual-channel 1, for camera images, I think, and -r tells it to use rogue mode since it's getting an EventBatcherHeader not a TimingSystemHeader):
psdaq/build/drp/pgpread -d /dev/datadev_0 -c 1 -r
REMEMBER: can run DAQ (or at least pgpread) and rogue GUI at the same time since rogue disables opening data stream virtual channel with this line: https://github.com/slaclab/lcls2-pgp-fw-lib/blob/d57de0f1da359b3f1ab8d899968c022f92b58a28/python/lcls2_pgp_fw_lib/hardware/shared/_Root.py#L22. LATER: the drp couldn't seem to open /dev/datadev_0 VC 0 with this error when rogue GUI was running, but maybe the data (VC 1?) is OK:
rogue.GeneralError: AxiStreamDma::AxiStreamDma: General Error: Failed to open device file /dev/datadev_0 with dest 0x0! Another process may already have it open! |
See 1Hz of SlowUpdates going through (transition id 10). The SlowUpdates cause TransactionCnt to increment at 1Hz (zero'd by toggling blowoff):
Disabled slow updates, but didn't help with 100% dead time. Do blowoff (to empty queues) and clear readout (to clear latched XpmOverflow which in turn latches deadtime?). Then pgpread sees transitions and some l1accepts (although haltingly?) before deadtime kicks in.
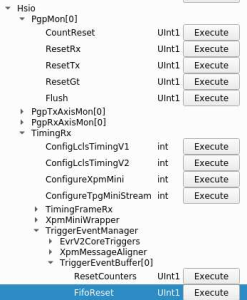
Tried the FifoReset here in addition to blowoff and clearreadout but don't see any l1accepts in pgpread:
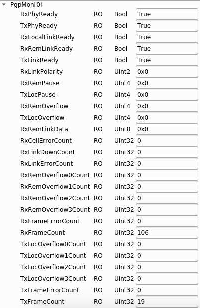
Do see these registers counting (RxFrameCount, TxFrameCount). Perhaps the rogue register reads?
Tried this UserRst with blowoff/clearreadout, but doesn't help:

Also tried FpgaReload above and running the DAQ (including configure, since presumably the FEB lost its configuration) but still 100% deadtime.
Tried power cycling camera. Camlink converter box LED was GREEN after power cycling, but still 100% deadtime.
Power cycled the camlink converter box. LED was RED after power cycling. Failed to configure. Power cycling the camera. Camlink converter box LED stayed RED. After configuring went to GREEN. Makes it feel like there might be a power-ordering issue: after cycling camlink converter box need to cycle the camera and reconfigure. Still get deadtime. Checked camlink cables: screws needed tightening, but felt ok.
Now can't even get a transition through.
Measure light levels:
Powercycled cmp011 again. After resetting the XPM link (toggled XpmMiniTiming/ConfigLCLS2Timing and hit TxPhyReset) I can configure. Back in the mode where we get 100% deadtime, but I can get transitions and a few events through by doing Blowoff/ClearReadout.
Tried increasing the TriggerPulseWidth to 100us (was 0.092us?) but doesn't help with deadtime:

This TxOpCodeCount under Hsio→PgpMon[0] seems to only increase with L1Accepts. We are getting far fewer of these than the L1Accept rate says we should. Suggests we're dropping camera frames?

Possible breakthrough: if I power cycle the camera and run without reconfiguring then L1Accepts show up in pgpreader at the correct rate. Feels like our configuration is breaking the camera? Compared the power-on defaults (https://www.slac.stanford.edu/exp/npa/manuals/opal1000man.pdf) to our config. Don't see an obvious difference in UART settings except we have VR=1 (vertical remap) and OVL=1 (overlay frame counter and integration time on early pixel data)?. Other differences (BL(black level), DPE (defect pixel correction) OFS (output offset)) feel like they don't matter. Tried setting VR=0 and OVL=0 but it didn't help. Set them back to 1.
Horrible workaround: if I configure the camera, then powercycle, it appears to run.
The XPM link went bad again, and recovered with TxPhyReset.
Ben pointed out that in the case of failure, these L0Count/L1AcceptCount counters increment at the right rate, but TxOpCodeCount doesn't, so not all L1's are getting translated into TxOpCode's (!), so it's a problem in the KCU. Appears to contradict the camera-powercycle approach above, but perhaps that is caused by the exposure time getting set smaller so it can handle messed up delays? (see L0Delay solution below):
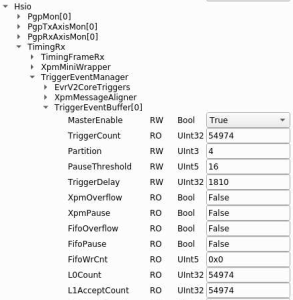
Questions for Larry/Ben:
Note for the delay solution below: please do not change the values without talking to Matt. These values are important and influence the whole partition. See also the Trigger Delays section
Note: PART:4 below is the read out group. This example is for read out group 4
Try moving back to old timing values. Current settings:
(ps-3.1.16) tmo-daq:lcls2$ pvget DAQ:NEH:XPM:0:XTPG:CuDelay DAQ:NEH:XPM:0:XTPG:CuDelay 2020-10-21 09:33:26.010 134682 (ps-3.1.16) tmo-daq:lcls2$ pvget DAQ:NEH:XPM:0:PART:4:L0Delay DAQ:NEH:XPM:0:PART:4:L0Delay 2020-10-21 09:33:26.334 10 |
Matt writes that the pre-Oct.-15 values were:
These were the values prior to 10/15 pvput DAQ:NEH:XPM:0:PART:3:L0Delay 90 (readout group 3) pvput DAQ:NEH:XPM:0:XTPG:CuDelay 160000 Changes after that are in the tmoc00118 logbook. |
This appeared to fix the problem!:
(ps-3.1.16) tmo-daq:lcls2$ pvput DAQ:NEH:XPM:0:PART:4:L0Delay 90 Old : 2020-10-21 09:33:26.334 10 New : 2020-10-21 12:48:30.590 90 (ps-3.1.16) tmo-daq:lcls2$ pvput DAQ:NEH:XPM:0:XTPG:CuDelay 160000 Old : 2020-10-21 09:33:26.010 134682 New : 2020-10-21 12:48:58.977 160000 |
It turns out the CuTiming didn't mater, only the L0Delay change fixed it. From the opal log file:
I guess this is output from the logfile when it fails: triggerDelay 17810 And when it succeeds: triggerDelay 1810 (after changing L0Delay to 90) |
Made it feel like we're running out of bits in firmware for triggerDelay, but (a) rogue reads back the register correctly (b) Matt says he thinks we have 32-bits.
Addendum on May 18, 2021: Matt found a bug in the Ben's trigger module (in cameralink gateway firmware, hsd, epix, kcu). There is a delay 32-deep fifo where triggers go, and firmware was queueing every MHz slot and filling it up. We couldn't set a large "user delay" (e.g. hsd "raw_start").
Note by Valerio (9/7/21): Lane 01 (Marked as "2" on the breakout cable) seem not to work on cmp011. As a workaround, Lane 02 (marked as 3 on the cable) has been used
python scripts/devGui --pgp4 0 --laneConfig 0=Piranha4 --pcieBoardType Kcu1500 --enableConfig 1 --startupMode 1 --standAloneMode 1
Run this script on the same node (I think it might need to be in the software/scripts/ subdirectory under the cameralink-gateway git checkout): https://github.com/slaclab/cameralink-gateway/blob/master/software/scripts/debugImageViewer.py with a command like "python scripts/junk.py --lane 0 --xDim 1 --yDim 1024 --bytePerPix 1" (rogue seems to default to 1024 samples with 8-bits per sample in camlink "full" mode). NOTE: there is a "RateDrop" object in that script which limits the number of events shown in the display so back pressure doesn't happen. The constructor should be initialized with "False" to get higher rates.
Toggle "StartRun" in devGui
NOTE: when switching between rogue-daq and lcls-daq we saw 100% deadtime which we could only fix by power cycling the node. Saw XpmPause=1 on unused lanes (1,2,3 counting from zero). While we toggle the global BlowOff register, I think this is also a per-lane BlowOff. Perhaps we needed to do that?
Edit the _acceptFrame method in the above script to dump out received data
It is sometimes useful to look at a rogue device's registers while the DAQ is running. When the DAQ instantiates the device's Root class, some lines are printed that indicate that a zmqserver has been started on a port range. Running a command like the following on the node hosting the device brings up a devGui-like interface:
Use configuration memory part number s25fl128sxxxxxx0-spi-x1_x2-x4 in Vivado.
An example old mcs file: ClinkFebPgp2b_1ch-0x00000025-20190315182526-ruckman-af9cde50.mcs
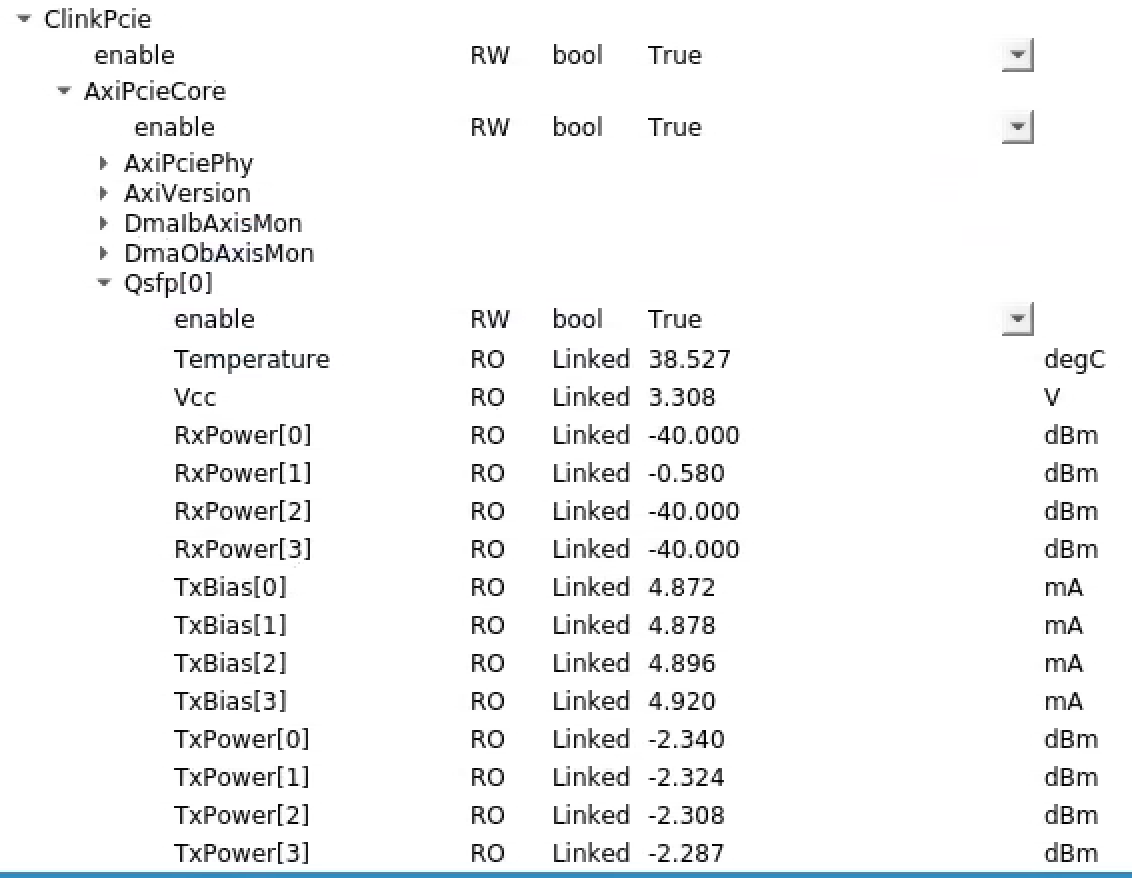
NOTE: Reading of fiber-optic powers is off by default: need to set "enable" to True (both on KCU and FEB) and the click the "Read All" registers button at the bottom of the GUI. To see the KCU side one has to tell devGui what the board type is:
python scripts/devGui --pgp4 1 --laneConfig 1=Opal1000 --pcieBoardType Kcu1500
Note that reading the optical powers on the KCU is slow (16 seconds?). Larry has a plan to improve that speed. It's faster on the FEB.
Who manages the server for the feedback epics variable? It's a notepad-pv server that is managed by Silke/POCs.
Why does det.raw.image not work when we enable fex? Need to set fex→prescale = 1 to get image on every shot, 0 to disable images. det.raw.image() should still work, but doesn't. Need to debug. det.ttfex.image() might be an ROI for the background events (no beam). det.ttfex.proj_ref() is a projection of that ROI. det.ttfex.proj_sig() for every event beam. Not sure what det.ttfex.raw() is.
BatchingEventBuilder subframes. Not all of these are present, index into subframe array is defined by the "tdest" (like a lane number) defined in the subframe tail (AxiStream Batcher Protocol Version 1):
NOTE: the indexes above are sparse (0,2,3) but I believe in rogue the batcher event-builder BYPASS register is dense, so 0x4 masks the EventInfo data, for example.
This can happen if the caput to the feedback EPICS variable defined in the cnf file fails (e.g. if no write permission). The exception that is thrown by caput is trapped by the batcheriterator:
(ps-4.5.26) rix-daq:scripts> caput RIX:TIMETOOL:TTALL 267.829 -0.439507 0.00723276 0.00330652 36174.5 102.814
Old : RIX:TIMETOOL:TTALL 6 267.829 -0.439507 0.00723276 0.00330652 36174.5 102.914
CA.Client.Exception...............................................
    Warning: "Channel write request failed"
    Context: "op=1, channel=RIX:TIMETOOL:TTALL, type=DBR_STRING, count=1, ctx="RIX:TIMETOOL:TTALL""
    Source File: ../oldChannelNotify.cpp line 159
    Current Time: Fri Mar 03 2023 16:31:35.992164597
..................................................................
New : RIX:TIMETOOL:TTALL 6 267.829 -0.439507 0.00723276 0.00330652 36174.5 102.914
(ps-4.5.26) rix-daq:scripts> |
Be sure to scan the Opal section for experiences that may be relevant to the Piranha, e.g. FEB LEDs, fiber powers, etc.
The Piranha has an LED:
GCP' command lists the Built-in Self Test (BiST) value, which can be looked up in Appendix C of a recent version of the User's Manual. 'GCP' is executed by the cameralink class at start-up, so both devGui and the DRP will show its results.RC') command or power cycle it. The LED will also turn red if the camera's internals get above 80 ºC. For reference, normal operating temperature seems to be around 53 ºC.I have found that in some cases the camera responds to its Three Letter Commands (TLCs) very slowly (upwards of 2 seconds per command) with respect to normal (50 - 70 ms per command). This seems to be associated with being in External Exposure Mode ('sem 1' having been issued). Putting the camera in Internal Exposure Mode ('sem 0') restores the fast behavior. In the slow state, the DRP's Configure is on the edge of timing out, so I've arranged Configure's command sequence to be mostly exectued while the camera is in Internal Exposure Mode and left the switch to External Exposure Mode for last (if we want to operate in that mode).
The User's Manual has several warnings about not allowing the line rate to exceed 1 / (exposure time + 1 µs). I have found that the camera gets into a bad state when this is violated. All its parameters and the output of 'GCP' will look correct and normal, but readout will be accompanied with high deadtime. For example, with a 71 KHz L0InpRate (as per groupca), L0AccRate will be 17856 Hz (1/4 the input rate). The camera persists in this state until it is power cycled, reset ('RC', which takes 20-30 seconds), or the command sequence 'sem 0', 'set 4000', 'stm 0', 'stm 1' is issued. The DRP does the latter during Configure in piranha4_config().
Matt recommends configuring the AxiStreamBatcherEventBuilder with a timeout value near what you expect the latency to be. If something in the triggering is causing you to drop images, you'll likely see it in the batcher event builder statistics (dropCounts, labelled TimeoutDropCnt in devGui, which you only see if you set the batcher event-builder timeout value non-zero (units are 156MHz)). If you are dropping images, then eventually those FIFOs will fill up waiting for image data, and then deadtime will be asserted. This should not be confused with "DropCount" in the FEB. Larry Ruckman writes about the latter: "Caused by either software back pressure reaching FEB receiver (and need to drop the data) or clink framing error. Always if this condition happens, the the data and timing message will get out out sync because data has dropped before event builder. You will need to execute a "StopRun" to flush out the buffers then "StartRun" to re-synchronize the data/timingMsg alignment". cpo saw Hsio->PgpMon[1]→RxFrameErrorCount non-zero in conjunction with the FEB DropCount. I think this is likely the sign of a hardware problem (dirty fiber? bad kcu?).
devGui is often helpful for seeing the state of the system and testing/debugging. Unfortunately, it currently issues 'spf 0' at startup, which puts the camera in 8-bit/pixel mode while leaving the FEB's DataMode alone. Giacamo has requested that image acquisition be done with 12-bit/pixel mode. Just be sure to have a consistent state before starting to run with devGui.
CamExpert is software from Teledyne Dalsa that runs on Windows with their framegrabber (currently an Xtium-CL_MX4).
TriggerEventBuffer.TriggerDelay is an additional trigger seen by the encoderSet TriggerEventBuffer.TriggerSource to XPM (0) - Evr is the other option (LCLSI)EventBuilder.Partition to groupEventBuilder.Bypass to 0x4 to bypass full timing stream which has no buffer and is not needed for the high-rate encoder.This information also available at the firmware repository.
Data is on SFP[0], VC[1] Subframe 2, counting from 0.
The data message is:
BIT[31:00] = Encoder position BIT[39:32] = Encoder Error Counter BIT[47:40] = Missed Trigger Counter BIT[48] = "E" latch BIT[49] = "P" latch BIT[50] = "Q" latch BIT[63:51] = Reserved (zeros) |
The high-rate encoder firmware is located at high-rate-encoder-dev, the devGui is included in the repository. To clone it:
GIT_LFS_SKIP_SMUDGE=1 git clone git@github.com:slaclab/high-rate-encoder-dev --recursive |
The devGui can then be run from high-rate-encoder-dev/software as:
python scripts/devGui.py --lane <lane> [--standAloneMode] |
config/defaults.yml .lane not the lane mask . As of 2024/03/29, the high-rate encoder is drp-srcf-cmp004 lane 7.--standAloneMode is for running off of internal timing.It is possible to run the full devGui (not the "Spy-mode" described above) alongside the DAQ with a bit of hack. This works fairly well with the hrencoder because the hrencoder_config.py is fairly simple. It may be of use if you can transition to configure but not beyond. To run the DAQ alongside the devGui , you can:
Configure transition.hrencoder_config.py (or other equivalent detector) - remove the Root object and all register accesses from the file.devGui . Swich to the System tab and browse to and load the YAML file you saved previously.(courtesy of Tyler Johnson)
First would be to look at the rix iocmanager config file which should be in a directory like /cds/group/pcds/pyps/config/rix/iocmanager.cfg.
In that file there will be a line listing the wave8 ioc, the host it's running on, and a port. You can telnet to that host at that port to get to the ioc shell. From there you can ctl+x to kill the ioc. If it doesn't reboot automatically on its own, you can restart it with ctl+r.
Tyler also uses this command to find IOC's: grep <string_related_to_ioc> /reg/g/pcds/pyps/config/*/iocmanager.cfg
An example of <string_related_to_ioc> would be "fim" for various sims.
Run caget -S on the PV root value (often found in the .cnf files) appended with :LAUNCH_EDM:
caget -S MR3K2:FIM:W8:01:LAUNCH_EDM MR3K2:FIM:W8:01:LAUNCH_EDM /cds/home/t/tjohnson/trunk/common/pgpWave8/children/build/iocBoot/ioc-rix-pgpw8-01/edm-ioc-rix-pgpw8-01.cmd |
The resulting string can be run from the command line to bring up the EDM screens.
Also see Wave8/FIM Information for users.
The RIX controls machine that talks to the FIMs is ctl-rix-fim-01.
The new kcu firmware from https://github.com/slaclab/pgp-pcie-apps should be used, although rogue software lives in https://github.com/slaclab/wave8.
Running 8 FIMs on the same cmp node requires at least the KCu firmware that comes with version v1.5.0 of pgp-pcie-apps
Updating the firmware is very similar to the Opal case:
cd pgp-pcie-apps
python scripts/updatePcieFpga.py --path <PATH TO FIRMWARE DIR>
The firmware can be downloaded off GitHub for every release
Path to the IOC panel startup files:
Run the rogue gui's from the wave8/software directory (e.g. ~cpo/git/wave8_2.4.2/) like this:
In the wave8DAQ.py gui, sfp[0] is daq data (labelled pgp1 on the box) sfp[2] is the lcls2 timing (labelled evr1 on the box).
Start the 3 RIX ioc's like this (this example is for number 3), but see Bringing up IOC screens above. Read the .cmd file to see the epics prefix for fim's 1,2,3:
(from Bruce) RIX FIM Top launcher which gives access to HV and wave8 lanes 0 and 1 is:
I think one can check that IOC's are up with commands like this (see rix.cnf for EPICS prefixes):
TMO: Counting from zero: 1,2 (0 is bad, see above)
RIX: cmp007 PGP lanes counting from zero: 4 (chemrix), 5 (KB: mr4k2), 7 (KB: mr3k2) (was 6, but fiber 6 was bad?),. Data Patch panel: in RIX rack01 the order of patch fibers in the top left corner of the cassette is (left to right): mr4k2, mr3k2, chemrix. XPM:3 Timing: AMC0 (right most one) ports 2,3,4 (counting right to left, starting from 0): mr4k2, mr3k2, chemrix.
RIX: cmp007 lane 4 counting from 0 (chemrix) is connected to xpm:3 AMC0 port 4 counting from 0. Similarly lane 5 (mr4k2) is port 2, and lane 7 (mr3k2) is port 3.
RIX: on Dec. 9 2021, mr3 is serial number 10, mr4 is sn 12, chemrix is sn 6
lower-right: EVR0 (controls)
lower-left: EVR1 (daq)
upper-right: PGP0 (controls)
upper-left: PGP1 (daq)
cpo saw this error showing up in rix fim1 (MR4K2) on 10/16/21:
rix-drp[27981]: <C> PGPReader: Jump in complete l1Count 225 -> 227 | difference 2, tid L1Accept |
By swapping fibers I determined the problem was on the FIM side (not DAQ/DRP node) or in the fiber transport to the DAQ (receiving power measured -10dBm at the DRP). In the end power cycling fim1 seemed to solve the problem. Much later (Jan 31, 2023) I have a feeling the solution for this problem might have been fixing a ground loop by using an AC-coupled power supply instead of a DC-coupled supply, but I could be wrong -cpo.
Crashes
If you see this crash at startup it is an indication that the fim IOC that writes these registers is not up and running:
rix-drp[225759]: <C> XPM Remote link id register illegal value: 0xffffffff. Try XPM TxLink reset. |
The xpm remote-id bits (also called rxid in some devGui's). First two lines come from psdaq/drp/BEBDetector.cc:
To program fim firmware via JTAG use a machine like pslab04, setup Vivado with:
source /afs/slac/g/reseng/xilinx/2020.2/Vivado/2020.2/settings64.sh
The startup Vivado with the command "vivado". Select the "hardware manager".
When right-clicking on the Xilinx device in the hardware manager, for "configuration memory device" select mt25ql256-spi-x1_x2_x4 as shown here on slide 7 from Larry:
https://docs.google.com/presentation/d/1e6CD5VV5nUxqJFbEky0XWcoWPtA20_VZGqTkRjJDnDk/edit#slide=id.p4
Using the wave8 repo https://github.com/slaclab/wave8:
python scripts/wave8LoadFpga.py --l 5 --mcs /cds/home/c/cpo/junk/Wave8DigitizerPgp4_6Gbps-0x02020000-20211210145222-ruckman-4592987.mcs
For initial testing in SRCF, wave8_config.py was modified to avoid the need for an IOC. PV interactions were commented out. Rogue interactions were added to modulate the BlowOff bit and set some register values.
Initially we couldn't get any timing frames to come through (phase2s). Matt determined that this was due to the wave8 Rogue Top object instantiation "stealing" the datastream VC away from the DAQ. Since there is no vcMask parameter to Top() yet, we modified the code to replace the datadev VC1 with the one for simulation. After this, we saw timing frames go through the DAQ.
Matt notes, "All the buffering is in the Wave8. The KCU does no timing for wave8. You do have to consider how the wave8 is configured. By default, it has 8 raw waveforms with 256 samples at 2 bytes per sample plus some processed data (about 100 bytes). That is >4kB per event. At 1MHz , that's 4GB/second, while the PGP link is only 6Gb/s."
Running the wave8 DRP with some ADCs disabled causes it to seg fault.
With RawBuffers.BuffLen set to 32 samples, a 1 MHz run with zero deadtime succeeded. Also Disable went through. At 71 kHz, a BuffLen value of 255 is fine for deadtime-less running.
In the latest wave8 front-end-board firmware (2.4.x) there is a new DataPathCtrl register. This has two bits that enable deadtime to the XPM. It defaults to 0x3 (both controls and DAQ data paths can cause backpressure). It should be set to 0x2 (only DAQ path can cause backpressure). We believe the controls-side will drop in units of “entire events” so 0x2 should be fine for controls.
If deadtime issues persist, bring up the IOC screen and verify that the trigger is set up correctly. There is a TriggerDelay setting on the main IOC screen on the Acquisition Settings panel. Large values cause deadtime, but values < ~20000 are fine. This value is calculated from EvrV2:TriggerDelay setting that can be found on the PyRogue Wave8Diag screen on the EvrV2CoreTriggers panel. Its value is in units of 185 MHz/5.4 ns ticks, not ns.
See Chris Ford's page here: UDP Encoder Interface (rix Mono Encoder)
Currently the mono encoder readout node goes to an extra network interface on drp-srcf-cmp002 (Nov. 5, 2022).
Zach's PLC is at address 192.168.0.3.
In particular, the "loopback mode" described there and the netcat command can be useful for debugging whether the problem is on the DAQ end or on the controls PLC end.
Zach's PLC has another pingable interface that can be used to check that it is alive. You can't ssh to it since it's not linux:
drp-srcf-cmp002:~$ ping plc-rixs-optics PING plc-rixs-optics.pcdsn (172.21.140.71) 56(84) bytes of data. 64 bytes from plc-rixs-optics.pcdsn (172.21.140.71): icmp_seq=1 ttl=127 time=0.236 ms 64 bytes from plc-rixs-optics.pcdsn (172.21.140.71): icmp_seq=2 ttl=127 time=0.424 ms |
Zach writes: there are some EPICS PVs now for checking what the RIXS optics plc thinks it's doing for these:
$ caget SP1K1:MONO:DAQ:{TRIG_RATE,FRAME_COUNT,ENC_COUNT,TRIG_WIDTH}_RBV
SP1K1:MONO:DAQ:TRIG_RATE_RBV   10.2042
SP1K1:MONO:DAQ:FRAME_COUNT_RBV 10045
SP1K1:MONO:DAQ:ENC_COUNT_RBV   22484597
SP1K1:MONO:DAQ:TRIG_WIDTH_RBV 0 |
Fixing "Operation Not Permitted" Error
After time, "tprtrig" process can generate this error, because the tpr driver on drp-neh-ctl002 keeps using up file descriptors and runs out eventually:
Configuring channel 0 outputs 0x1 for Partition 2^M
 Version          PulseID        TimeStamp  Markers  BeamReq          BsaInit  \
       BsaActiv          BsaAvgD          BsaDone^M
Could not open sh: Operation not permitted^M
terminate called after throwing an instance of 'std::__cxx11::basic_string<char\
, std::char_traits<char>, std::allocator<char> >'^M |
This can be fixed in a kludgy way by restarting the tpr driver like this (on drp-neh-ctl002). One time cpo had to stop the service and start it again ("lsmod | grep tpr" didn't show the "tpr" driver).
sudo rmmod tpr sudo systemctl start tpr.service |
You should be able to see the driver like this:
(ps-4.5.16) drp-neh-ctl002:lcls2$ lsmod | grep tpr tpr 185417 0 (ps-4.5.16) drp-neh-ctl002:lcls2$ |
On Nov. 10 found that above "systemctl start" didn't work, complaining about a problem with avahi-daemon. Matt did "sudo modprobe tpr" and this worked?
Saw this on Dec. 14, 2023
Configuring channel 0 outputs 0x1 for Partition 2
 Version          PulseID        TimeStamp  Markers  BeamReq          BsaInit
      BsaActiv          BsaAvgD          BsaDone
Failed to map slave: Invalid argument
terminate called after throwing an instance of 'std::__cxx11::basic_string<char,
std::char_traits<char>, std::allocator<char> >' |
This was from Ric's new collection-aware tpr process and it didn't break until a later transition. Was able to reproduce more easily by running the old standalone non-collection tprtrig process:
tprtrig -t a -c 0 -o 1 -d 2 -w 10 -z -p 2 |
From Ric's notes: "Matt determined that there was a change in the memory map of the kernel module and loaded a newer version (?)' for that error". Talked to Matt: he thinks the tpr.ko may need to be recompiled. Github for this appears to be here: https://github.com/slaclab/evr-card-g2. tpr.ko seems to be built with "cd software/kernel/" and then "make". After that did "sudo mv tpr.ko /usr/lib/modules/3.10.0-957.21.2.el7.x86_64/extra/" and "sudo systemctl restart tpr.service" and then tptrig started working (I also tried some by-hand insmod commands, but I think that didn't help)..
Documentation: https://slaclab.github.io/rogue/
Event Batcher (a.k.a. EventBatcher) Format: AxiStream Batcher Protocol Version 1
From Matt:
We can also use servers with JTAG/USB in the hutch to run a remote hw_server process for connecting to the vivado tools. I've used this on rix-daq-hsd-01, for instance. You need to run /reg/common/package/xilinx/Vivado_2018.3/HWSRVR/2018.3/bin/hw_server on that node (or any other with USB and access to that directory), run vivado on an AFS machine like pslab04, and start an ssh tunnel from pslab04 to the remote server for port 3121.
This might also work on machine psbuild-rhel7 in bldg 950 room 208, since it has access to vivado via afs?
Some of the various "plumbing" message queues (that the users don't see) create queues with the full number of buffers (set with the -n option). This can easily exceed the default linux system limit (currently 10) set in /proc/sys/fs/mqueue/msg_max. This can create an mq_open error because the mq_maxmsg value of the mq_attr struct is too large. The system limit needs to be set appropriately. An example of the error:
mq_open output: Invalid argument
name: '/PdsToMonitorEvQueue_tmo_6'
mq_attr:
        mq_flags 0x800
        mq_maxmsg 0xc
        mq_msgsize 0x10
        mq_curmsgs 0x0
|
sudo sysctl -w fs.mqueue.msg_max=32/etc/sysctl.d/99-sysctl.conf.-n parameter value must be <= the fs.mqueue.msg_max value.-n parameter value divided by the -q parameter value must be > 0.epicsArch can segfault on configure if the number of variables gets large because the configure transition can exceed the dgram transition buffer size (see: https://github.com/slac-lcls/lcls2/blob/18401ef85dda5f7027e9321119a82410a00bad1e/psdaq/epicsArch/epicsArch.cc#L609). There are checks done afterwords, but the segfault can happen earlier than the checks. The transition buffer size can be specified on the epicsArch command line with the "-T" option (currently 1MB).
Right answer might be to have a "safe" Xtc::alloc method that would prevent the dgram from going past the end of the buffer, but that's a significant change.
Logfiles can be found, for example, in /cds/group/pcds/pyps/apps/hutch-python/rix/logs
$ procmgr status rix-hsd.cnf Host UniqueID Status PID PORT Command+Args daq-rix-hsd-01 hsdioc_1a RUNNING 140606 28076 hsd134PVs -P DAQ:RIX:HSD:1_1A -d /dev/pcie_adc_1a daq-rix-hsd-01 hsdioc_1b RUNNING 141684 28075 hsd134PVs -P DAQ:RIX:HSD:1_1B -d /dev/pcie_adc_1b drp-neh-ctl002 hsdpvs_1a_a RUNNING 63077 28073 hsdpvs -P DAQ:RIX:HSD:1_1A:A drp-neh-ctl002 hsdpvs_1a_b RUNNING 63118 28074 hsdpvs -P DAQ:RIX:HSD:1_1A:B drp-neh-ctl002 hsdpvs_1b_a RUNNING 63069 28071 hsdpvs -P DAQ:RIX:HSD:1_1B:A drp-neh-ctl002 hsdpvs_1b_b RUNNING 63070 28072 hsdpvs -P DAQ:RIX:HSD:1_1B:B |
We have seen errors like this when connecting boxes:

In both cases this was due to a problem with the type checking in mypy (in principle using the mypyd daemon spawned by ami). The two cases that caused this error:
Seshu wrote about debugging mypy problems:
i usually dump the file its trying to type check. it saves to a temporary file, so i just replace this line
https://github.com/slac-lcls/ami/blob/master/ami/flowchart/Terminal.py#L585
with tempfile.NamedTemporaryFile(mode='w') as f:
then you can just run mypy by hand and play with it
UED is the ultrafast electron diffraction facility which uses a small accelerator and instrument housed in building 40. The timing system is LCLS2 style with the following exceptions:

The ATCA shelf manager for the timing crate is accessed via testfac-srv01. Also, drp-ued-cmp001 has a private ethernet interface connected to the ATCA ethernet switch for the purpose of running the XPM software. The ePix 10ka quad is hosted by the Kcu1500 card in drp-ued-cmp001. The timing segment level is hosted by the Kcu1500 in drp-ued-cmp002. Because the timing clocks and frame rates are different than LCLS2, the software requires special flags to configure the timing receivers with LCLS1 clock frequency and LCLS2 protocol decoding.
360 Hz capable EpixQuad
Kcu1500 on drp-ued-cmp001 with firmware image
Build String : Lcls2XilinxKcu1500Pgp4_6Gbps_ddr: Vivado v2021.2, rdsrv300 (Ubuntu 20.04.1 LTS), Built Fri 18 Mar 2022 11:26:34 AM PDT by weaver
Epix MPOD Gui launched via ~xshen/ePix/MPOD/ePix_MPOD.cmd
Access to accelerators controls IOCs is through testfac-srv01. Timing runs on cpu-as01-sp01 (and sp02?). Shelf manager is shm-as01-sp01-1.
Github repo for small epixhr prototype: https://github.com/slaclab/epix-hr-single-10k
devGui: python scripts/ePixHr10kTDaqLCLSII.py --asicVersion 2 --dev /dev/datadev_0
The small epixHR prototype has 2 fibers of data (lanes 0 and 1) coming from a QSFP. Timing is on lane 3.
The KCU1500 is the "generic" kcu1500 also used for the wave8, so can use the rogue GUI from that to look at the KCU registers.
See also Matt's page of information here: ePixHR Beam Test DAQ
See EpixM.
This section is included for background knowledge on how to configure LCLS2 BLD from an accelerator IOC.
Taking the GMD (PV base = EM1K0:GMD:HPS) as an example:
Configuration of SuperConducting Soft x-ray BLD:
(ps-4.5.24) bash-4.2$ caget EM1K0:GMD:HPS:SCSBR:ENB
EM1K0:GMD:HPS:SCSBR:ENB Enable
(ps-4.5.24) bash-4.2$ caget EM1K0:GMD:HPS:SCSBR:MULT_ADDR
EM1K0:GMD:HPS:SCSBR:MULT_ADDR 239.255.25.2
(ps-4.5.24) bash-4.2$ caget EM1K0:GMD:HPS:SCSBR:MULT_PORT
EM1K0:GMD:HPS:SCSBR:MULT_PORT 10148
To configure the rate for 71kHz testing:
[weaver@drp-srcf-cmp001 ~/lcls2-new]$ caget EM1K0:GMD:HPS:SCSBR:RATEMODE
EM1K0:GMD:HPS:SCSBR:RATEMODE Fixed Rate
[weaver@drp-srcf-cmp001 ~/lcls2-new]$ caget EM1K0:GMD:HPS:SCSBR:FIXEDRATE
EM1K0:GMD:HPS:SCSBR:FIXEDRATE 71.5kHz
[weaver@drp-srcf-cmp001 ~/lcls2-new]$ caget EM1K0:GMD:HPS:SCSBR:DESTMODE
EM1K0:GMD:HPS:SCSBR:DESTMODE Disable
Production configuration should look like this:
[weaver@drp-srcf-cmp001 ~/lcls2-new]$ caget EM1K0:GMD:HPS:SCSBR:RATEMODE
EM1K0:GMD:HPS:SCSBR:RATEMODE Fixed Rate
[weaver@drp-srcf-cmp001 ~/lcls2-new]$ caget EM1K0:GMD:HPS:SCSBR:FIXEDRATE
EM1K0:GMD:HPS:SCSBR:FIXEDRATE 1MHz
[weaver@drp-srcf-cmp001 ~/lcls2-new]$ caget EM1K0:GMD:HPS:SCSBR:DESTMODE
EM1K0:GMD:HPS:SCSBR:DESTMODE Inclusive
[weaver@drp-srcf-cmp001 ~/lcls2-new]$ caget EM1K0:GMD:HPS:SCSBR:DESTMASK
EM1K0:GMD:HPS:SCSBR:DESTMASK 16
For SuperConducting Hard x-ray BLD (LCLS2-HE) replace SCS with SCH.
The supporting PVs are described here (BLD PVs). More detailed IOC setup instructions are found in the README file of the bsaDriver /afs/slac/g/cd/swe/git/repos/package/epics/modules/bsaDriver.git.
The LCLS2 DAQ release has tools analogous to the LCLS1 DAQ for debugging BLD reception issues. The application in the LCLS2 DAQ release can be run as
(ps-4.5.16) bash-4.2$ xcasttest -i eno1 -a 239.255.25.0 -p 10148 -r
Using interface eno1 (172.21.156.23)
dst[0] : efff1900.10148
Joined efff1900 on if ac159c17
received from 172.27.28.14:31111
Packets 117.98 Pkts: Bytes 26.43 kB
Packets 119.98 Pkts: Bytes 26.87 kB
Packets 119.98 Pkts: Bytes 26.87 kB
The application should be run on a DRP node like drp-neh-cmp002. Address 239.255.25.0 is SXR EBEAM and port 10148 is the standard port for NC BLD sources. The addresses for other BLD sources is found in the table below.
| Source | Address/Group | Port |
|---|---|---|
| SXR EBEAM | 239.255.25.0 | 10148 |
| SXR PCAV | 239.255.25.1 | 10148 |
| SXR GMD | 239.255.25.2 | 10148 |
| SXR XGMD | 239.255.25.3 | 10148 |
| HXR EBEAM | 239.255.24.0 | 10148 |
| HXR PCAV | 239.255.24.1 | 10148 |
| HXR GDET | 239.255.24.2 | 10148 |
Note that the EBEAM BLD is a concatenation of several data sources. As such, there may be problems with one of the sources that contributes. That is evident in the "damageMask" field of the EBEAM BLD. This can be seen in AMI or for extreme experts in the raw dump of the multicast reception (argument -d of xcasttest).
A common problem in the EBEAM BLD source is that the L3Energy calculation often fails after the accelerator changes beam energy and does not update their internal alarm limits to the calculation.
(from Matt Weaver)
Slides 4 and 9 of https://docs.google.com/presentation/d/1EwJTx_L5JNZF0mURIhxflpmzJ8p5ey6uIXqwth3gPBc/edit#slide=id.g47d26c62e9_0_29. Kukhee has a collection of documentation here (https://confluence.slac.stanford.edu/pages/viewpage.action?pageId=285114775). There are also EPICS PVA records from the server that provide "static" information about the packet contents - like the field names and data types: https://github.com/slac-lcls/lcls2/blob/a9886a2768fb83028317ba854664bd424d94e386/psdaq/psdaq/app/hpsBldServer.cc#L2-L11
hpsBldServer.cc represents exactly what the IOC needs to do - receive the UDP unicasts from the ATCA board and transmit the data as UDP multicast.
The first thing is that IT has to make the directory writeable. You can test if it's writeable with "sudo touch junk.txt" in the appropriate directory. It should look like this, and not have "root" at the end:
daq-tmo-hsd-02:~$ df -h /etc/modules-load.d/ Filesystem Size Used Avail Use% Mounted on 172.21.32.61:/nfsexport/diskless/rhel7/x86_64-rhel79-daq/clientstate/daq-tmo-hsd-02/etc/modules-load.d 3.6T 3.7G 3.6T 1% /etc/modules-load.d daq-tmo-hsd-02:~$ |
This is a non-writeable directory ("root" at the end):
(ps-4.5.10) daq-tmo-hsd-02:modules-load.d$ df -h /etc/modules-load.d/ Filesystem Size Used Avail Use% Mounted on 172.21.32.61:/nfsexport/diskless/rhel7/x86_64-rhel79-daq/root 3.6T 3.0G 3.6T 1% / (ps-4.5.10) daq-tmo-hsd-02:modules-load.d$ jobs |
Create a file like this as root (note that module parameters can also go on this line):
bash-4.2# more /etc/modules-load.d/pcie_adc.conf pcie_adc bash-4.2# |
Copy the kernel module into the globally visible module area: /cds/sw/package/daq/modules/<kernel-ver> (<kernel-ver> can be obtained from "uname -r").
Do "systemctl daemon -reload" to pick up the changed .conf file above. Omar needs to find out how to tell RHEL7 to find the .ko files in /cds/sw/package/daq/modules/. (i.e. this is still a work-in-progress).
Libfabric supplies a program called fi_info to list the available providers for transferring data between nodes and processes. The results list is sorted from highest to lowest performing. Options can be given to filter according to various features or capabilities. On systems with infiniband, the verbs provider is returned as the most performant interface. On our systems without infiniband, the tcp provider is listed as the most performant.
Our code follows this same pattern, so absent constraining parameters, libfabric chooses the highest performing interface it has access to. The following kwargs exist to be able to narrow the selection:
ep_domain: Forces the use of a particular domain (physical network interface)ep_fabric: Forces the use of a particular fabricp_provider: Forces the use of a particular providerThe valid kwarg values are those listed by the fi_info command. More information about the various providers can be found on the libfabric github site in the Readme and the Provider Feature Matrix on the Wiki tab. These are updated with each release.
Recently, there was a problem in UED that turned out to be due to the provider libfabric chose to use. The symptom was the intermittent silent failure of transferring a large (O(1 MB)) buffer from the EPIX DRP to the MEB and seemed to be affected by whether recording was enabled or not. This occurred whether these two processes were running on the same node or on different nodes. The DRP indicated that the transfer was successful, but the MEB never received a completion signal (CQ) and consequently timed out building the event.
The highest performing network hardware on the UED machines use 100 Gbit/sec mlx5 interfaces from Mellanox. Although these are capable of running infiniband, we run ethernet over them. Libfabric by default chooses to use the verbs provider with these, so the above parameters were created to be able to force the tcp provider to be selected. This was done in ued.cnf with the line:
kwargs = 'ep_fabric="172.21.36.0/24",ep_domain=enp129s0' |
The tcp provider is a partial replacement for the deprecated sockets provider (the other is udp) that was originally used to commission running the DAQ over ethernet. sockets behaves similarly to verbs but differently from tcp. To get UED going again, I switched to using sockets, which appears to solve the problem:
kwargs = 'ep_provider=sockets,ep_domain=enp129s0' |
(I now think the ep_fabric specification was redundant.) A fair bit of development has occurred on the tcp provider since the libfabric release that we use (1.10.1) appeared. I need to further investigate the differences between tcp and sockets to understand the cause of the problem.
We have some evidence that running this can fix the problem with teb to drp DrpEbReceiver process (the "383" (counting from zero) or "384" event problem) but maybe have to run eblf_pingpong in the "right direction" ("-S" maybe has to be on the broken node?). The reason for this number is that libfabric by default has 384 buffers in the "completion queue", and somehow the completion queue is getting stuck.
Ric theorizes that perhaps IB driver is holding onto resources that get flushed out by this?
Run this on two different nodes:
psdaq/build/psdaq/eb/eblf_pingpong -A 172.21.164.139 172.21.164.142 (start first, local address first) psdaq/build/psdaq/eb/eblf_pingpong -S -A 172.21.164.142 172.21.164.139 |
Recently "psipmi power cycle" doesn't work on some nodes, with the ipmi interface become unpingable. A workaround discovered by Ric Claus: bring up firefox on psnxserv, go to https://drp-srcf-cmp010-ipmi.pcdsn (for example), skip past the security warning messages in the browser, find login information in a file like /cds/group/pcds/admin/ipmicreds/drp-srcf-cmp010-ipmi.ini (these files are read-protected to members of the ps-ipmi group, you may have to "newgrp ps-ipmi"). If you don't find a file for a node, then it uses the default in /cds/group/pcds/admin/ipmicreds/default.ini. Then there's a menu for "Remote Control", and under there, an option to powercycle. Takes longer, but Ric’s workaround is reliable in my experience.
NOTE: the web interface can report the operation as "failed" but it seems to work anyhow. See bottom of this image:
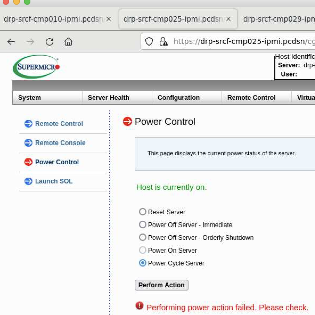
On June 30th 2022 cpo notices that a new 4.5.16 release in TMO was picking up parts of the 4.5.13 release (which was creating an error). The issue lasted about 18 hours until it was "fixed". I could find no trace of 4.5.13 in any environment variable. The same release 4.5.16 release worked in RIX. In the end the problem was "fixed" by copying the tmo.cnf file to junk.cnf and editing the "cmd" field (in this case ami-client) to some other line. After a start and stop of junk.cnf with this changed line tmo.cnf started working correctly. Perhaps the remote procmgrd was caching the old 4.5.13 release since the "cmd" field hadn't changed? Or, less likely, some the p0.cnf.last (or p0.cnf.running) was caching the old 4.5.13 release somehow? I don't understand. Or, said vaguely, there was some longterm nfs caching issue that remembered 4.5.13?
I was having this problem as well. I think it may have something to do with dmypy processes that hang around. If one can get this guy to restart, the problem goes away. For me, there were a bunch:
(ps-4.5.16) claus@drp-neh-ctl001:srcf$ ps -ef | grep dmypy
claus 61073 1 0 Jan07 ? 00:00:05 /cds/sw/ds/ana/conda2/inst/envs/ps-4.5.5/bin/python /cds/sw/ds/ana/conda2/inst/envs/ps-4.5.5/bin dmypy start
claus 61608 1 0 Apr01 ? 00:00:04 /cds/sw/ds/ana/conda2/inst/envs/ps-4.5.11/bin/python /cds/sw/ds/ana/conda2/inst/envs/ps-4.5.11/bin/dmypy start
claus 285627 222348 0 19:32 pts/9 00:00:00 grep dmypy
claus 353768 1 0 Jun09 ? 00:00:59 /cds/sw/ds/ana/conda2/inst/envs/ps-4.5.13/bin/python /cds/sw/ds/ana/conda2/inst/envs/ps-4.5.13/bin/dmypy start
claus 360001 1 0 Jun09 ? 00:01:02 /cds/sw/ds/ana/conda2/inst/envs/ps-4.5.13/bin/python /cds/sw/ds/ana/conda2/inst/envs/ps-4.5.13/bin/dmypy start
I tried running ami-client on a different machine, which didn’t have an issue. It also printed 'Daemon started’ whereas on the usual machine I run it on it printed 'Daemon is still alive’. When I switched back to running on the usual machine, a new daemon was started and ami-client ran cleanly.
I found on https://mypy.readthedocs.io/en/stable/mypy_daemon.html that there is a ‘dmypy stop’ command, but it doesn’t seem to stop the existing daemons, so I killed ‘em.
to see gui's to control lcls2-timing trigger inputs:
ssh kfe-console
$ cd /cds/group/pcds/epics/ioc/kfe/gmd/R3.1.0/gmdScreens
$ ./launch_gmd_main_pcds.sh
$ ./launch_xgmd_main_pcds.sh
or go to lcls-srv01 and run "lclshome"
for lcls1-timing (outdated) can find it in "kfe" gmd/xgmd tabs and goto
waveforms and then "timing" button.
To control the BLD rate: (from Marcio)
Press the Acq. Services on the main screen. Then click on the BLD tab. Then Rate Control. And, finally, on th
e BLD1 row, click on the button with a “…”.
Make sure to hit "enter" as each field is changed (will be "purple"
until enter is hit).
Note: the "rate limit" buttons don't affect anything for BLD
**********************************************************************
if someone puts gmd/xgmd in NC mode:
kfe-console:gmdScreens$ source /reg/g/pcds/pyps/conda/dev_conda
(pcds-5.7.3) kfe-console:gmdScreens$ caget TPR:FEES:MP01:0:TCRB:MODECTRL
TPR:FEES:MP01:0:TCRB:MODECTRL Crate=SC; LN=NC
(pcds-5.7.3) kfe-console:gmdScreens$
$ caget TPR:FEES:MP01:0:TCRB:MODECTRL
TPR:FEES:MP01:0:TCRB:MODECTRL Entire Crate=NC
$ caput TPR:FEES:MP01:0:TCRB:MODECTRL 3
Old : TPR:FEES:MP01:0:TCRB:MODECTRL Entire Crate=NC
New : TPR:FEES:MP01:0:TCRB:MODECTRL Crate=SC; LN=NC
(pcds-5.7.2) marcio@kfe-console ((no branch)) $ caput EM2K0:XGMD:HPS:SCSBR:FIXEDRATE 100Hz
Old : EM2K0:XGMD:HPS:SCSBR:FIXEDRATE 71.5kHz
New : EM2K0:XGMD:HPS:SCSBR:FIXEDRATE 100Hz
This is what Marcio wrote to Jeremy about someone switching timing
back to NC timing (lcls1):
Chris is talking about the crossbar control on shm-fees-sp01-1. We set SC timing to the backplane and sometim
es someone switches it back to NC.
**********************************************************************
to get pv with info about bld payload on drp-srcf-cmp*:
export EPICS_PVA_SERVER_PORT=5181
export EPICS_PVA_BROADCAST_PORT=5180
export EPICS_PVA_ADDR_LIST=172.27.224.220
export EPICS_PVA_AUTO_ADDR_LIST=NO
(pcds-5.7.3) marcio@drp-srcf-cmp001 $ pvinfo EM1K0:GMD:HPS:BLD_PAYLOAD
EM1K0:GMD:HPS:BLD_PAYLOAD
Server: 172.27.224.220:5181
Type:
epics:nt/NTScalar:1.0
structure BldPayload
float milliJoulesPerPulse
float RMS_E1
(pcds-5.7.3) marcio@drp-srcf-cmp001 $ pvinfo EM2K0:XGMD:HPS:BLD_PAYLOAD
EM2K0:XGMD:HPS:BLD_PAYLOAD
Server: 172.27.224.220:5181
Type:
epics:nt/NTScalar:1.0
structure BldPayload
float milliJoulesPerPulse
float POSY
float RMS_E1
float RMS_E2
**********************************************************************
bypassing the gateways:
(ps-4.6.0) drp-srcf-cmp025:lcls2$ cainfo EM1K0:GMD:HPS:STR0:STREAM_DOUBLE0
EM1K0:GMD:HPS:STR0:STREAM_DOUBLE0
State: connected
Host: pscag01-daq-drp.pcdsn:35892
Access: read, write
Native data type: DBF_DOUBLE
Request type: DBR_DOUBLE
Element count: 4096
(ps-4.6.0) drp-srcf-cmp025:lcls2$ export EPICS_CA_AUTO_ADDR_LIST=NO
(ps-4.6.0) drp-srcf-cmp025:lcls2$ export EPICS_CA_ADDR_LIST=172.27.131.255:5068
(ps-4.6.0) drp-srcf-cmp025:lcls2$ cainfo EM1K0:GMD:HPS:STR0:STREAM_DOUBLE0
EM1K0:GMD:HPS:STR0:STREAM_DOUBLE0
State: connected
Host: 172.27.128.162:34555
Access: read, write
Native data type: DBF_DOUBLE
Request type: DBR_DOUBLE
Element count: 4096
(ps-4.6.0) drp-srcf-cmp025:lcls2$ export EPICS_CA_ADDR_LIST=172.27.128.162:5068
(ps-4.6.0) drp-srcf-cmp025:lcls2$ cainfo EM1K0:GMD:HPS:STR0:STREAM_DOUBLE0
EM1K0:GMD:HPS:STR0:STREAM_DOUBLE0
State: connected
Host: 172.27.128.162:34555
Access: read, write
Native data type: DBF_DOUBLE
Request type: DBR_DOUBLE
Element count: 4096
(ps-4.6.0) drp-srcf-cmp025:lcls2$ ifconfig | grep "inet "
Infiniband hardware address can be incorrect! Please read BUGS section in ifconfig(8).
inet 172.21.152.46 netmask 255.255.252.0 broadcast 172.21.155.255
inet 172.21.164.46 netmask 255.255.252.0 broadcast 172.21.167.255
inet 127.0.0.1 netmask 255.0.0.0