Introduction
As reported in the Sep-Oct 2010 HEC report, path from SEECS to UET Taxila is seeing high round trip times.
Analysis
Looking at the pingtable.pl data from SEECS to UETTaxila results for September and October one sees:
- The monthly average RTTs are typically 100ms.
- The min_RTTs are under 10ms.
- The IPDV are typically quite large (> 20ms)
- Also the unreachability is high measured to UETAXILa from Pakistan
- The losses from SEECS to UET Taxila are between 2.5% and 7%, which is high
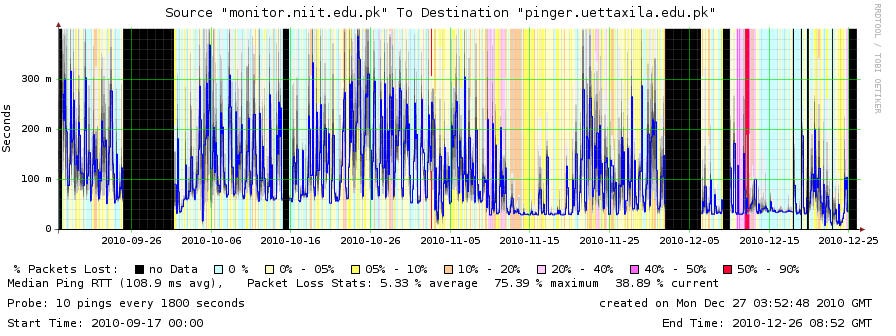
Looking at the smokeping plot above, one sees min_rtts < 50ms and very large differences in min and max. If one looks in more detail especially at the region between Nov 18 and Dec 1 it is seen there is much variability. At nights the RTTs are low. This is typically when the load is low since people go to bed. Thus what we may be seeing is RTTs increasing as load goes up and some links in the path getting congested, heavy queuing ensues with attendant losses and extended RTTs.
We decided to look at the data in more detail using http://pinger.fnal.gov/cgi-bin/graph_pings.pl?src_regexp=monitor.niit.edu.pk&dest_regexp=pinger.uettaxila.edu.pk and with the file format of csv. The format of the CSV output is:
monitor.niit.edu.pk,pinger.uettaxila.edu.pk,100,10,10,60.117,86.823,138.175,3.4,22.6889,54.9,1,1602314766
i.e.
Mon-name,remote-name,ping_size,sent,rcvd,min_RTT,avg_RTT,max_RTT,min_IPV,IPDV,max_IPV,Dups,unix_time+10years(GMT)
This was imported into Excel, the Unix time converted to Excel time day using Excel=Unix/(60*60*24)+"1/1/1970"
and then we plotedt time of day versus average RTT, ipdv, max RTT. We also looked for correlations with day of the week. The results show little correlation with time of day or day of week.
This may be patrially caused by the large bins being used by graph_pings.pl. To eliminate this we will look at the half hourly data gathered into files of the form:
/nfs/slac/g/net/pinger/pingerdata/hep/data/monitor.niit.edu.pk/ping-2010-12-26.txt.gz
Still the most likely suggestion is congestion/queuing at some point along the path. The number of packets that would cause queuing of 200ms depend on the link speeds. Assuming 1500Byte packets the number of packets is as follows
Link Mbps	Pkts queued up
1000		16,667
100		1,667
10		167
1		17
It would be interesting to know the speeds of the links. I would be most suspicious of the last mile at the UETTAXILA end.
Another, less likely possibility is dynamic routing such that sometimes the traffic takes one route and at others a different one. You might set up a cronjob to gather traceroutes every 10 mins for a few days and look if you can see anything that could cause large changes. On the other hand I would expect these to be step changes.
The poor reachability of UETTAXILA makes the problem harder to diagnose.
The reduced RTT seen between 2010-11-12 thru 2010-11-20 corresponds with Eids holiday in Pakistan when people are not using their work Internet. Thus this is indicative of the inflated RTTs elsewhere being due to congestion.
Change in minimum RTT
On the other hand looking at the smokeping plot above there is an obvious reduction in minimum RTT on or about November 10th. Prior to that date it is about 60ms, after that date it drops to about 35ms.