Introduction
As reported in the Sep-Oct 2010 HEC report, path from SEECS to UET Taxila is seeing high round trip times. 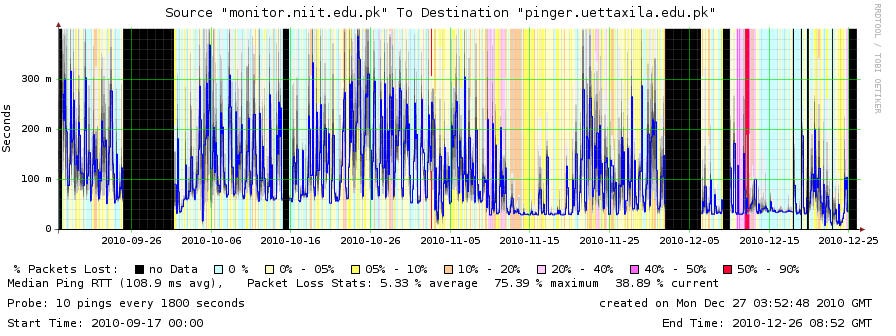
Analysis
Looking at the pingtable.pl data from SEECS to UETTaxila results for September and October one sees:
- The monthly average RTTs are typically 100ms.
- The min_RTTs are under 10ms.
- The IPDV are typically quite large (> 20ms)
- Also the unreachability is high measured to UETTAXILA from Pakistan
- The losses from SEECS to UET Taxila are between 2.5% and 7%, which is high
Congestion
Looking at the smokeping plot above, one sees min_rtts < 50ms and very large differences in min and max. If one looks in more detail especially at the region between Nov 18 and Dec 1 it is seen there is much variability. At nights the RTTs are low. This is typically when the load is low since people go to bed. Thus what we may be seeing is RTTs increasing as load goes up and some links in the path getting congested, heavy queuing ensues with attendant losses and extended RTTs.
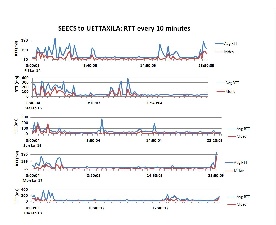
We decided to look at the data in more detail using http://pinger.fnal.gov/cgi-bin/graph_pings.pl?src_regexp=monitor.niit.edu.pk&dest_regexp=pinger.uettaxila.edu.pk and with the file format of csv. The format of the CSV output is:
monitor.niit.edu.pk,pinger.uettaxila.edu.pk,100,10,10,60.117,86.823,138.175,3.4,22.6889,54.9,1,1602314766
i.e.
Mon-name,remote-name,ping_size,sent,rcvd,min_RTT,avg_RTT,max_RTT,min_IPV,IPDV,max_IPV,Dups,unix_time+10years(GMT)
This was imported into Excel, the Unix time converted to Excel time day using Excel=Unix/(60*60*24)+"1/1/1970"
and then we plotedt time of day versus average RTT, ipdv, max RTT. We also looked for correlations with day of the week. The results show little correlation with time of day or day of week.
This may be partially caused by the large bins being used by graph_pings.pl. To eliminate this we will look at the half hourly data gathered into files of the form:
/nfs/slac/g/net/pinger/pingerdata/hep/data/monitor.niit.edu.pk/ping-2010-12-26.txt.gz
Still the most likely suggestion is congestion/queuing at some point along the path. The number of packets in a buffer that would cause queuing of 200ms depend on the link speeds. Assuming 1500 byte packets the number of packets is as follows
Link Mbits/s	Pkts queued up
1000		16,667
100		1,667
10		167
1		17
It would be interesting to know the speeds of the links. I would be most suspicious of the last mile at the UETTAXILA end. By the way if we know the link speed then we can estimate the buffer size, again assuming packet size.
The buffer size in the transmitter in Linux is defined by txqueuelen and this is typically set to 1000 packets. To flush a buffer of 1000 packets each say 100Bytes long (typical packet size used by PingER) would take 800msec for a 1Mbit/sec link or 80ms for a 10Mbits/sec link. This assumes all packets to be flushed are the same size. The typical Internet packet size distribution is tri-modal. Typically 80% of the traffic is TCP. There is a peak around 64 bytes for ACKs, a second peak around 570 bytes (for older stacks this was the limit) and a third peak at ~1530 bytes the maximum for most modern TCP stacks.
Linux 2.4 and later versions implemented a sender-side autotuning mechanism, so that setting the optimal buffer size on the sender is not needed (see here). This assumes you have set large buffers on the receive side, as the sending buffer will not grow beyond the size of the receive buffer.
There is an interesting [discussion on the effects of buffering on RTTs.
The poor reachability of UETTAXILA makes the problem harder to diagnose.
The reduced RTT seen between 2010-11-12 thru 2010-11-20 corresponds with Eids holiday in Pakistan when people are not using their work Internet. Thus this is indicative of the inflated RTTs elsewhere being due to congestion.
Another possibility for the high peaks in the UETTaxila-Islamabad regions might be that UETTaxial is exchanging large files with another site in Islamabad, for example NCP. Congestion may be occuring during these file transfers.
Routing
Another, less likely possibility is dynamic routing such that sometimes the traffic takes one route and at others a different one. You might set up a cronjob to gather traceroutes every 10 mins for a few days and look if you can see anything that could cause large changes. On the other hand I would expect these to be step changes.
Traceroutes from NUST to UETTaxila and from PCTL to UETTaxila were taken.
The traceroute from NUST to UETTaxila is shown below:
[16:38:09 pinger]$ /usr/sbin/traceroute pinger.uettaxila.edu.pk traceroute to pinger.uettaxila.edu.pk (121.52.150.164), 30 hops max, 40 byte packets
 1  115-186-131-65.nayatel.pk (115.186.131.65)  0.729 ms   0.546 ms   0.695 ms
 2  115-186-128-177.nayatel.pk (115.186.128.177)  0.835 ms   0.703 ms   0.707 ms
 3  static.khi77.pie.net.pk (221.120.202.13)  23.949 ms   23.940 ms   23.903 ms
 4  static-10GE-KHI275-P01-SwA.pie.net.pk (202.125.128.173)  23.655 ms   23.651 ms   23.899 ms
 5  rwp44.pie.net.pk (221.120.254.13)  23.714 ms   23.640 ms   23.440 ms
 6  rwp44.pie.net.pk (202.125.148.136)  23.825 ms   23.813 ms   23.720 ms
 7  rwp44.pie.net.pk (221.120.236.106)  56.231 ms rwp44.pie.net.pk (221.120.236.110)  56.437 ms rwp44.pie.net
 8  * * *
We verified that the routers labelled KHI or khi are located in Rawalpindi and not not in Karachi.
There is a long delay between hops 2 and 3 as one moves from Nayatel to PIE. Since we believe both of these routers are relatively close to one another (i.e. < 20km) the delay caused by link distances should be ~ 1ms (1ms ~ 100km is roughly the RTT time for light in fibre or electrons in copper). Thus the delay of ~ 24ms is likely caused by congestion on the link that in turn causes queuing/buffering. A queuing delay of say 20ms on a 100Mbits/s link corresponds to a buffer length of ~ 330* 1500 Byte packets or a buffer space of ~ 500KBytes. The fact that the router interfaces at hops 5,6,and 7 all have the same name even though they have different addresses does not give a lot of confidence in where they are located. If they are all colocated, then the delay between hops 6 and 7 of ~ 32ms must be due to queuing. Unfortunately the traceroute appears to terminate in Rawalpindi before it reaches UETTaxila.
The traceroute from PCTL to UETTaxila is shown below:
C:\Users\zafar>tracert pinger.uettaxila.edu.pk
Tracing route to pinger.uettaxila.edu.pk [121.52.150.164] over a maximum of 30 hops:
  1    <1 ms     1 ms     1 ms  ZXDSL831II.home [192.168.1.1]
  2    33 ms    29 ms    30 ms  119.153.31.1
  3    19 ms    20 ms    18 ms  203.99.170.26
  4    19 ms    22 ms    18 ms  rwp44.pie.net.pk [221.120.253.9]
  5    20 ms    19 ms    20 ms  rwp44.pie.net.pk [202.125.148.136]
  6    55 ms    53 ms    45 ms  rwp44.pie.net.pk [221.120.236.106]
  7    42 ms    27 ms    24 ms  121.52.150.164.pern.pk [121.52.150.164]
Trace complete.
Again the route goes through the 3 router interfaces with the name rwp44.pie.net.pk. There is also a long delay between hops 1 and 20 suggesting congestion on the link since PERN and Rawalpindi are within 20km of one another\, in fact they may even be colocated.
Change in minimum RTT
On the other hand looking at the smokeping plot above there is an obvious reduction in minimum RTT on or about November 10th. Prior to that date it is about 60ms, after that date it drops to about 35ms.
Further Analysis: Jan 14 to Jan 27, 2011
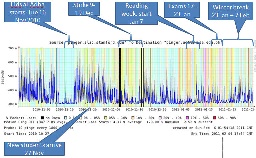
Analysis for Jan 14 to Jan 27 didn't reveal any patterns apart from heavy network utilization from midnight to 4am (Pakistan Daylight Time) in the morning. Possible reason could be data transfer between NCP and UETTAXILA. This is part of their research collaboration. Below is the strip graph from Jan 14 to Jan 27. Spreadsheet attached here.
Activity details
The details are:
- Fresh batch came in on 27th Nov
- Strike was on 9th Dec
- The university was shut down 9-19 Dec
- University was back on schedule 20th Dec 2010
- Holidays (Reading week) started 7th Jan
- Exams 17-23 Jan
- Winter break 23rd Jan - 7th Feb
|
|---|
The Smokeping plot from SLAC to UETTaxila for this period with associated events (powerpoint ) |
Misc:
- Available bandwidth: 16 Mbps.
- Throttled to 8Mbps --- for unknown reasons.
- All multimedia access (e.g., youtube) is blocked
- During daytime until 3:30pm when the classes are on, internet access is blocked to the hostels. After 3:30pm it is enabled thus RTT increases.
Bandwidth distributed between 5 buildings. (CS is consuming 4Mbps at the moment, while the other departments share the rest).
- Electrical and Electronics
- Mechanical and Mechatronics
- T&IE (CS & Telecomm.)
- Civil and Transportation
- Administration block
In addition to access control (using ACLs) each user's browsing activity is logged.
Analysis from the above data and activity details
Our set of analyzed dates consists of 24th to 30th December and then from 4th Jan to 27th Jan.
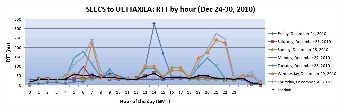
24th to 30th December was when university was back to normal routine after strike holidays. In that case, the analysis is at the correct data. The important observations at this data were that high RTTs were observed from 12am to 4am and at 10am to 1pm PST (PST= GMT + 5). This is the second last week before final exams and students are busy in final projects and submissions because of which network utilization is expected to be high. During daytime until 3:30pm PST when the classes are on, internet access is blocked to the hostels. After 3:30pm PST it is enabled in the hostels as well which results in an increased number of users. An increase in RTT is therefore observed at times around 5.30 pm PST (12.30 pm GMT) and remains so till early morning of the following day. This can be seen in the hourly graph shown below.
|
From 7th Jan to 17th Jan there were pre-exam holidays. From 7th to 13th Jan average RTT was higher than previous days of 4th Jan to 6th Jan. This is because of students using internet for multiple purposes in their holidays. This might include social networking when youtube is blocked. From 14th Jan onwards high average RTTs are observed after midnight till early morning. This is possibly because students have now started preparing for exams and they study at night.
Normal RTT behavior was observed on 24th and 25th Jan, however, high RTT after midnight were again observed on 26th and 27th Jan. This might be because of project submissions deadlines approaching and students working on their research projects after taking 2-3 days off after exams.
A reason for high average RTT for UETTAXILA can be the low bandwidth allocation. As mentioned, 4MB of bandwidth is shared among 4 departments. This increases the load on network and results in congestion, long queues, hence large RTT.