Introduction
As of October 2010, three new African submarine cables became active and fully functioning: MaIN OnE, EASSy and LION. These are in addition to cables that are already functioning: SAT3/SAFE, TEAMs and Seacom.
|
MaIN OnE (phase 1) |
EASSy |
LION |
SAT3/WASC (part of SAT3/WASC/SAFE cable system) |
TEAMs |
Seacom |
|---|---|---|---|---|---|---|
Location |
African West Coast, South Atlantic Ocean |
African East Coast, Indian Ocean |
Malagasy East Coast, Indian Ocean |
African West Coast, South Atlantic Ocean |
African East Coast and the Middle East |
African East Coast, Indian Ocean |
Cost (millions of USD) |
240 |
265 |
52 |
82 |
600 |
|
Length (km) |
7,000 |
10,000 |
1,070 |
4,500 |
||
Capacity (Tb/s) |
1.92 |
3.84 |
1.30 |
0.34 |
1.28 |
1.28 |
Completion/Inauguration |
||||||
Ownership |
US, Nigeria, AFDB |
African Telecom Operators 90% |
Mauritius, Madagascar, France |
South Africa, Nigeria, Namibia |
Kenya, UAE |
Updates can be gathered from here and for individual updates, see wikis MaIN OnE, EASSy and LION. The status of various submarine cables connecting Africa to the rest of the world as seen in October 2010 is shown below.
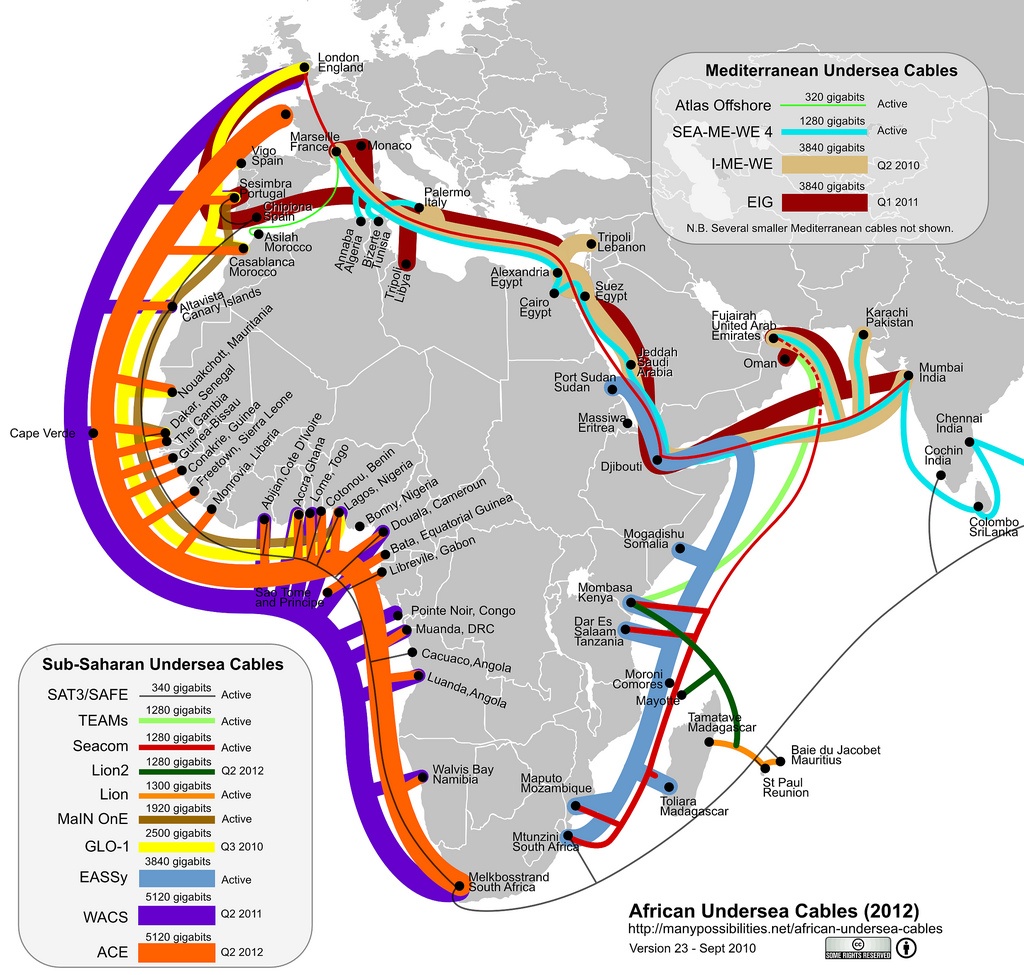
The landing points of these cables and countries are listed below.
- MaIN OnE (phase 1) - going from North to South
- Casablanca, Morocco
- Altavista, Canary Islands
- Dakar, Senegal
- Abijan, Côte d'Ivoire
- Accra, Ghana
- Lagos, Nigeria
- EASSy - going from North to South
- Port Sudan, Sudan
- Djibouti
- Mogadishu, Somalia
- Mombasa, Kenya
- Moroni, Comoros
- Dar es Salaam, Tanzania
- Toliara, Madagascar
- Maputo, Mozambique
- Mtunzini, South Africa
- LION - going from West to East
- Tamatave, Madagascar
- St. Paul, Reunion
- Baie du Jacobet, Mauritius
Effect of new sub-Saharan African cable systems coming online
To show the effects of these cables coming online, we shall consider minimum RTTs and jitter. We should see a considerable decrease in the minimum RTT and jitter for hosts that have direct connection with active submarine cables.
MaIN OnE (phase 1) landing points, inaugurated July 2010
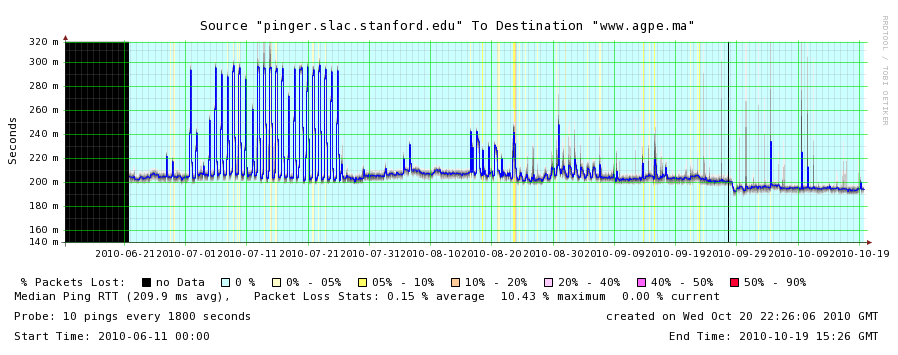
Morocco
We have three PingER nodes in Morocco. The node www.agpe.ma shows no particular change in minimum RTT due to MaIN OnE coming online. The node was experiencing problems before and during June but reappeared in late June. There were considerable spikes during July with minimum RTTs jumping around. This might be due to day/night differences in internet traffic. This could also be due to reconfiguration of routing tables because of shifting to new cable system. This might suggest the reason for decrease in spikes because of more available bandwidth.
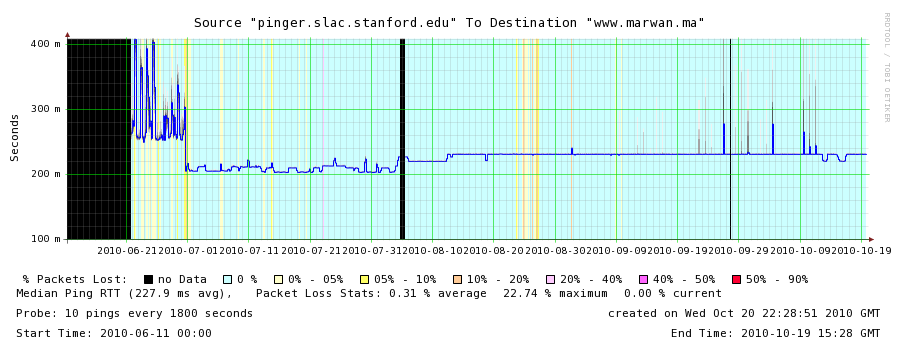
There is a noticeable difference in the minimum RTTs for the node at www.marwan.ma. The RTT drops from 250ms in June to 200ms in July and then stabilizes around 230ms from August onwards. It is interesting to observe the spikes in the month of June when the MaIN OnE wasn't online and the sudden drop in RTT during July. It is also interesting to note the stability of minimum RTTs after July.
EASSy landing points, inaugurated August 2010
Madagascar
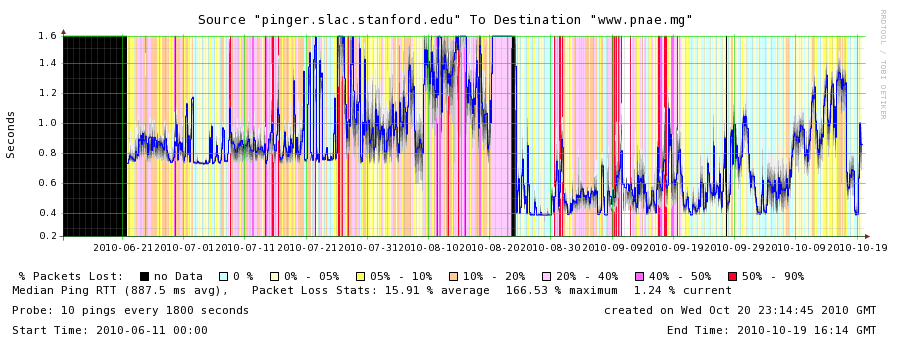
The www.pnae.mg host in Madagascar shows substantial change in minimum RTT. Before the deployment of EASSy cable system, this host was connected to rest of the world via a satellite link, reporting minimum RTT of 642ms in February. But in August things changed as the minimum RTT dropped to a reasonable reading of 370ms. However it must be added that the performance is still not stable. This might be due to day/night internet traffic quantity.
LION landing points, inaugurated March 2010
PingER hosts do not report any appreciable difference in minimum RTTs since the deployment of LION cable system.
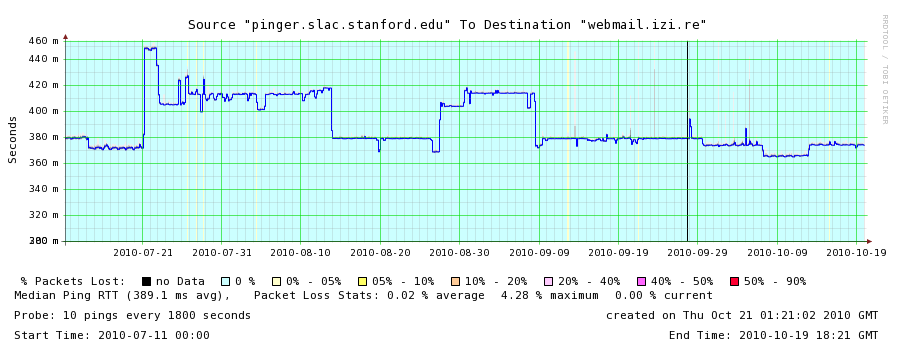
Reunion French Colony (Reunion)
The host at webmail.izi.re doesn't show any appreciable difference in minimum RTT since the LION cable system became active. We do not have data as far back as March but minimum RTT readings during http://www-wanmon.slac.stanford.edu/cgi-wrap/pingtable.pl?file=minimum_rtt&by=by-node&size=100&tick=allmonthly&from=EDU.SLAC.STANFORD.N3&to=Reunion-French+Colony&ex=none&only=all&dataset=hep&percentage=anyJanuary, February and March were 364ms, 372ms and 390ms. The graph shows that this trend continued without any obvious changes to minimum RTT despite LION deployment. We observed 365ms, 364ms and 355ms of RTT during the months of April, May and October.