Introduction
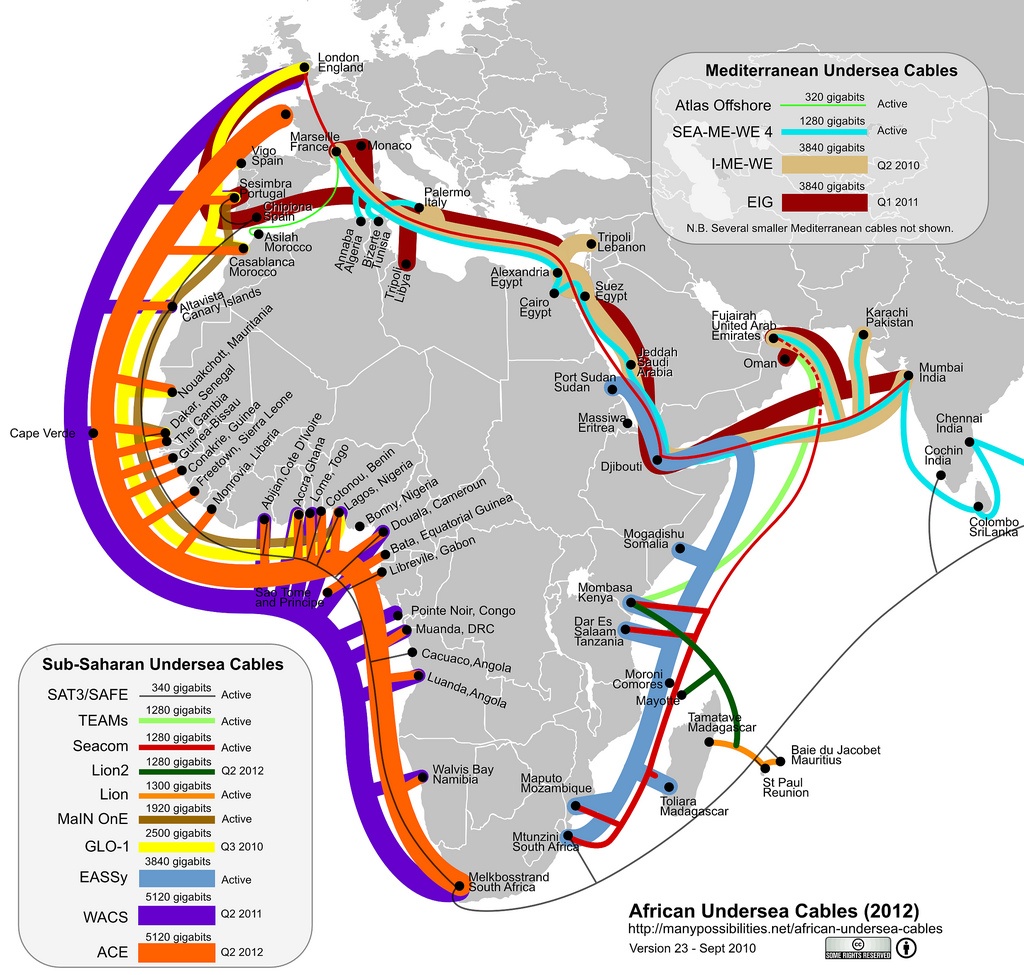
As of October 2010, three new African submarine cables became active and fully functioning: MaIN OnE, EASSy and LION. These are in addition to cables that are already functioning: SAT3/SAFE, TEAMs and Seacom. This study is a continuation of already documented case studies of African internet and African submarine cable systems.
|
MaIN OnE (phase 1) |
EASSy |
LION |
SAT3/WASC (part of SAT3/WASC/SAFE cable system) |
TEAMs |
Seacom |
|---|---|---|---|---|---|---|
Location |
African West Coast, South Atlantic Ocean |
African East Coast, Indian Ocean |
Malagasy East Coast, Indian Ocean |
African West Coast, South Atlantic Ocean |
African East Coast and the Middle East |
African East Coast, Indian Ocean |
Cost (millions of USD) |
240 |
265 |
52 |
82 |
600 |
|
Length (km) |
7,000 |
10,000 |
1,070 |
4,500 |
||
Capacity (Tb/s) |
1.92 |
3.84 |
1.30 |
0.34 |
1.28 |
1.28 |
Completion/Inauguration |
||||||
Ownership |
US, Nigeria, AFDB |
African Telecom Operators 90% |
Mauritius, Madagascar, France |
South Africa, Nigeria, Namibia |
Kenya, UAE |
Updates can be gathered from here and for individual updates, see wikis MaIN OnE, EASSy and LION. The status of various submarine cables connecting Africa to the rest of the world as seen in October 2010 is shown below.
The landing points of these cables and countries are listed below.
- MaIN OnE (phase 1) - going from North to South
- Casablanca, Morocco
- Altavista, Canary Islands
- Dakar, Senegal
- Abijan, Côte d'Ivoire
- Accra, Ghana
- Lagos, Nigeria
- EASSy - going from North to South
- Port Sudan, Sudan
- Djibouti
- Mogadishu, Somalia
- Mombasa, Kenya
- Moroni, Comoros
- Dar es Salaam, Tanzania
- Toliara, Madagascar
- Maputo, Mozambique
- Mtunzini, South Africa
- LION - going from West to East
- Tamatave, Madagascar
- St. Paul, Reunion
- Baie du Jacobet, Mauritius
Effect of new sub-Saharan African cable systems coming online
To show the effects of these three new cables coming online, we shall consider minimum RTTs and jitter. We should see a considerable decrease in the minimum RTT and jitter for hosts that have direct connection with active submarine cables.
a). MaIN OnE (phase 1) landing points, inaugurated July 2010
Morocco
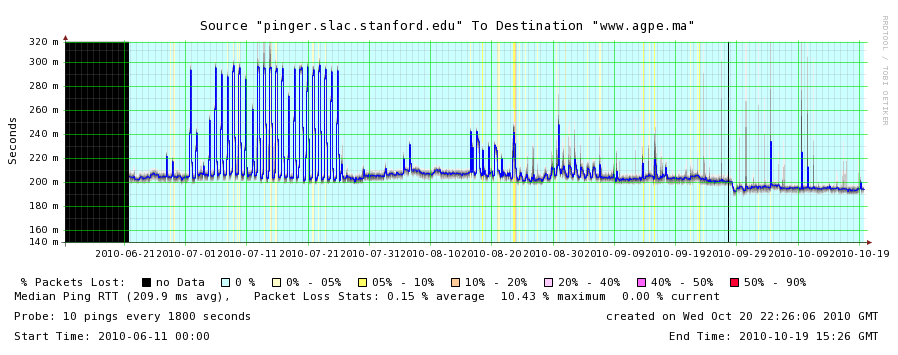
We have three PingER nodes in Morocco. The node www.agpe.ma shows no particular change in minimum RTT due to MaIN OnE coming online. The node was experiencing problems before and during June but reappeared in late June. There were considerable spikes during July with minimum RTTs jumping around. This might be due to day/night variations in internet traffic. This could also be due to reconfiguration of routing tables because of shifting to new cable system. This might suggest the reason for decrease in spikes because of more available bandwidth.
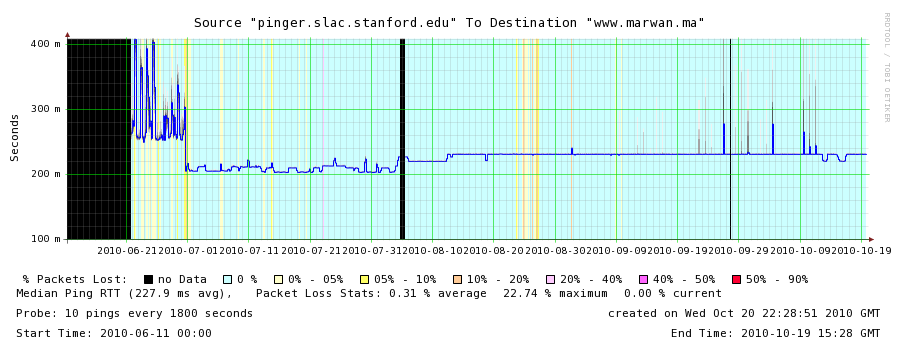
There is a noticeable difference in the minimum RTTs for the node at www.marwan.ma. The RTT drops from 250ms in June to 200ms in July and then stabilizes around 230ms from August onwards. It is interesting to observe the spikes in the month of June when the MaIN OnE wasn't online and the sudden drop in RTT during July. It is also interesting to note the stability of minimum RTTs after July.
b). EASSy landing points, inaugurated August 2010
Madagascar
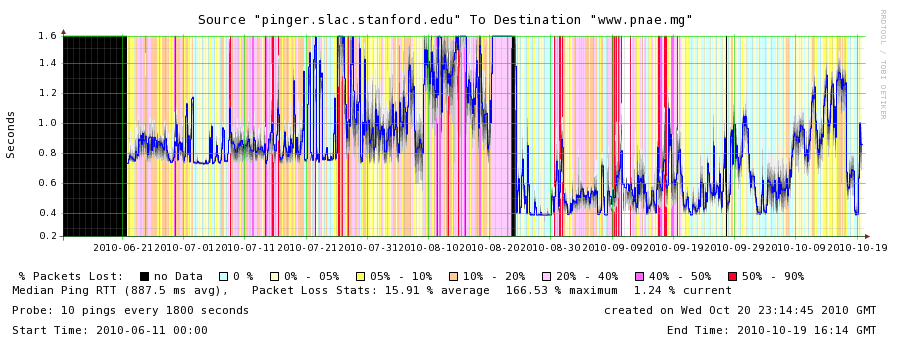
The www.pnae.mg host in Madagascar shows substantial change in minimum RTT. Before the deployment of EASSy cable system, this host was connected to rest of the world via a satellite link, reporting minimum RTT of 642ms in February. But in August things changed as the minimum RTT dropped to a reasonable reading of 370ms. However it must be added that the performance is still not stable. This might be due to variation in day/night internet traffic quantity.
c). LION landing points, inaugurated March 2010
PingER hosts do not report any appreciable difference in minimum RTTs since the deployment of LION cable system.
Reunion French Colony (Reunion)
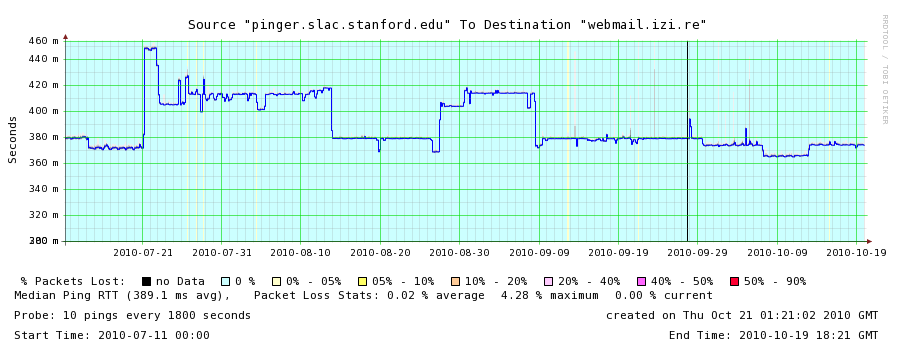
The host at webmail.izi.re doesn't show any appreciable difference in minimum RTT since the LION cable system became active. We do not have data as far back as March but minimum RTT readings during January, February and March were 364ms, 372ms and 390ms confirm this observation. The graph also shows that this trend continued. We observed 365ms, 364ms and 355ms of RTTs during the months of April, May and October.
Non Fibre Optic solutions
The Google-backed O3b (other 3 billion) venture has raised $1.2bn from a group of investors and banks, and says these new funds will last until the satellite launch in 2013. Its stated aim is to bring broadband coverage to much of the globe, potentially serving the 3bn - almost half the world's population - that currently lacks high speed access. Its satellites should cover all regions within 45 degrees of latitude north and south of the equator, which would include "emerging and insufficiently connected markets in Latin America, Africa, the Middle East, Asia and Australia."
Its first eight satellites will be launched by Arianespace from French Guyana in 2013, though this is will be almost three years later than originally claimed by founder Greg Wyler, who said in 2008 that the system would be running by the end of 2010. When the satellites do get running, they will reach 70% of the population by orbiting four times closer to earth than usual geostationary birds, which should also reduce latency. More details
Intra-Africa (inland Africa) fibre optics
The main purpose of the inland Africa fibre optics network is to connect up rest of the sites and countries to landing points of African submarine cable systems. This will extend coverage from landing points to capitals and major cities. Most universities and institutes will be able to take advantage of this and collaborate in various international projects.
The interactive map displays currently functional (as of October 2010) and ongoing/scheduled fibre optic deployments.
Indicators of Internet penetration in Africa
PingER metrics
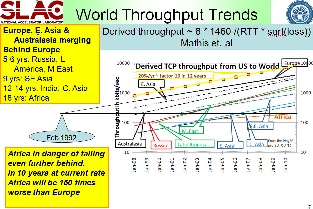
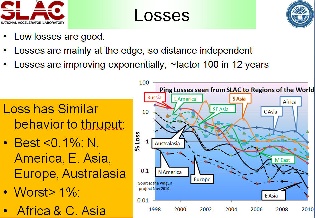
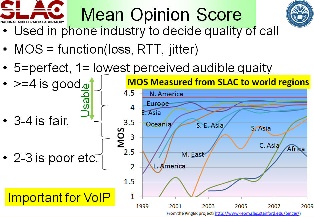
One can get an idea of how far behind Africa is compared to the rest of the world by comparing the PingER Internet throughputs, losses and Mean Opinion Scores (MOS).
Throughput |
Losses |
Mean Opinion Score (MOS) |
|---|---|---|
|
|
|
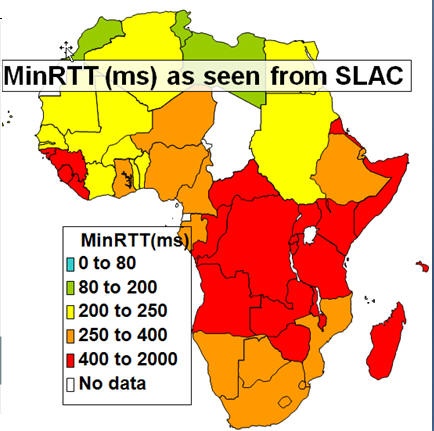
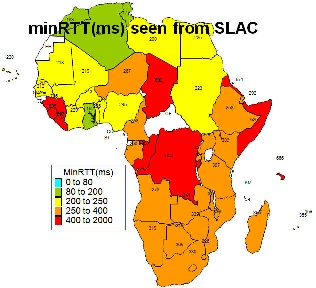
Minimum RTTs of <~ 400ms are typically a signature of a geostationary link. Looking at the minimum RTTs to African countries and comparing 2009 with 2010 one can see the impact of the new fibre/terestrial routes in particular for East Africa in the apparent reduction of minimum RTTs below 400ms for several countries.
minRTT 2009 |
minRTT 2010 |
minRTT to African countries 2008 |
min-RTT to African countries 2010 |
|---|---|---|---|
|
|
|
|
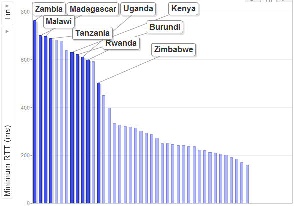
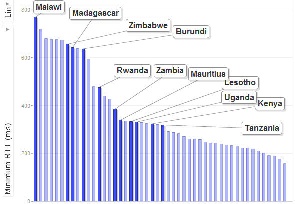
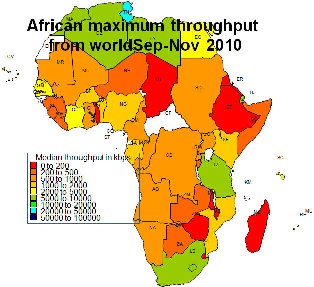
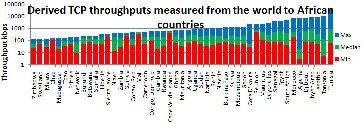
The derived throughputs measured from monitors around the world to African countries for September to November 2010 is shown below. The map shows the maximum of the average monthly derived TCP throughput for the hosts in the country. We chose the hosts with the maximum throughput since these are typically at the academic and research sites in the country and represent the best available internet connection in the country. The differences in the minimum median and maximum average monthly throughputs for hosts in each country are also shown sorted by maximum throughput. A spreadsheet is available.
|
|
|---|---|
|
|
BGP Prefixes
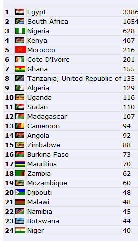
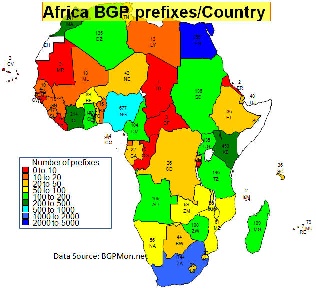
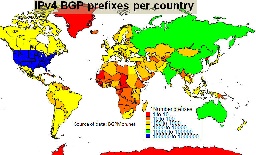
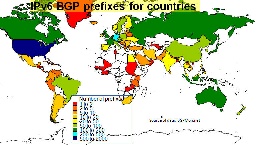
The Border Gateway Protocol (BGP) backs the routing decisions on the Internet. It maintains a table of IP networks or 'prefixes' which designate network reachability among autonomous systems (AS). Thus the number of prefixes is roughly the number of networks that appears on the Internet. The number of BGP prefixes for Africa is shown below. The data is from BGPMon and there is a spreadsheet here. It is seen that for Africa Egypt leads by a factor of about two over South Africa (the country with the second most BGP prefixes). It is also seen that when one compares Africa with the rest of the world it has fewer networks than all other regions both for IPv4 and the upcoming IPv6 prefixes (note the number of African countries with no IPv6 prefixes).
Table of top 25 countries |
Map of African IPv4 Prefixes |
Map of world Ipv4 prefixes |
Map of world Ipv6 prefixes |
|---|---|---|---|
|
|
|
|
