Getting the most out of your plots
Introduction
For plotting and fitting, org.lcsim provides an implementation of AIDA.
This tutorial will assume that you are working in JAS3 and have either loaded an existing AIDA file or created objects in AIDA with the org.lcsim plugin.
If you have executed some of the examples in JAS3, you have already used AIDA in lines like these:
AIDA aida = AIDA.defaultInstance();
...
aida.cloud1D("nTracks").fill(tracks.size());
These lines create and fill an unbinned one-dimensional histogram named nTracks with the return value of tracks.size()
Teminology
AIDA provides two different kinds of histograms: binned and unbinned.
Binned histograms are called IHistogram1D, IHistogram2D, IHistogram3D for one, two and three-dimensional histograms.
Similarly, unbinned histograms are called ICloud1D, ICloud2D, ICloud3D
Getting started
Viewing and Loading Plots
Lets start with viewing AIDA objects. You can either create them with the AIDA examples, the org.lcsim examples or you can load an existing AIDA file with File->Open File... in the menu.
All AIDA objects are arranged in trees. You can have many trees open at the same time; they are represented as Folders,  . Trees can contain, e.g. Clouds
  and/or Histograms
  , with the name of the object appearing next to it. If a folder is closed, double-clicking will open it and display its contents. Similarly, double-clicking on an open folder will close it, so that the contents are hidden.
Trees that are created by the org.lsim examples will have non-descriptive names like aida5312aida.
A double-click on a Cloud or a Histogram will cause JAS3 to plot the contents.
Clouds are automatically displayed with 50 bins over the range of the data.
If the active page shows source code or the examples, double clicking on an item in the tree will create a new plot page and display the item.
If, however, the active page is already a plot page, double-clicking on an item will cause the displayed plot to be overwritten, and all your modifications (like changing the binning, the color or the text) to be lost !
If you want to display more than one plot on a page, you have to use the context menu.
- Right click on the item you want to plot to open its context menu
- Select
Show in New Plot
In order to display an item together with an already displayed item, select Overlay on Current Plot from the context menu
Saving in various graphics formats (e.g. PNG, EMF, JPG, etc.)
JAS3 supports various graphics formats, for both bitmap and vector graphics.
Bitmap graphics are not scalable. JAS3 saves all Plots in their current size. Please make sure to draw the window to the desired width before saving in a bitmap format.
The following list gives a brief description of the most often used formats
PNG |
Portable Network Graphics |
We recommend this format as the default bitmap format. PNG files are compressed and can be used for inclusion in presentations. |
EPS |
Encapsulated PostScript |
For inclusion in printed documents, the EPS format is preferred. This is an uncompressed format, so EPS files are usually much larger than their compressed counterparts. (Up to a factor of 10 or more) |
PS |
PostScript |
Select this format if you want a document-quality printout of your plot. Uncompressed. This option should be used with care, because the PS format contains information about the page layout. The JAS3 PS format is letter-height and A4-width. |
SVG |
Scalable Vector Graphics |
Like the EPS format, SVG is a vector graphics format. Unlike EPS, however, it is compressed. You can use this format for high-quality graphics output. |
Saving Plots is a trivial task in JAS3:
- You want to save the whole page:
- Select
File->Save As...
- Select
- You want to save only one plot in the current page
- Right click on the plot and select
Save Plot As...
- Right click on the plot and select
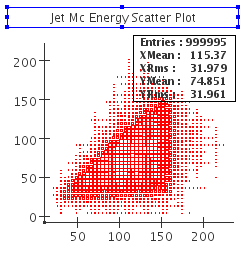
The Blue Frame Bug
Sometimes one of the plots shows an undesired (blue) frame. This will be in the image. You need to make sure that none of the plots has this frame before saving the image. Please note that if you try to save the plot by selecting Save Plot As..., it will always have the blue frame !
Changing Layout/Style/Properties with the Mouse
Advanced Topics
For this section, you will want to take a look at
PAIDA and AIDA API
Changing Layout/Style/Properties with a Script
While it is convenient to be able to manipulate your data with the mouse, in many cases you will want to apply the same modifications to a set of similar data, or perform more complicated modifications that are quite possible to do with AIDA, but not (yet) implemented in JAS3. This is where a script comes in handy