LAT Newsletter contributions from Beam Test Team
Issue 3 - due 30 april
Issue 2 - Studying the ACD Backsplash with beam test Data
The capability of the LAT to measure photon energies up to 300 GeV with good energy resolution requires the presence of a heavy calorimeter to absorb enough of the electromagnetic cascade produced by the incident gamma-ray. Unfortunately, a small fraction of secondary particles in the shower can travel backwards from the calorimeter into the tracker and up to the Anti-Coincidence Detector (ACD). This backsplash radiation consist mostly of 100-1000 keV photons and represent a potential problem since it can generate a signal in the ACD that would cause the gamma-ray to be interpreted as background and therefore rejected.
For this reason, the LAT ACD was designed as a segmented detector, so that only the ACD segment intersected by the backwards projected path of the particle is used to veto the event. In this way, the ACD area that contributes to backsplash is relatively small. The ACD hit probability per unit area as a function of energy and distance backwards from the shower has been studied with past beam tests (Moiseev, A. A., et al. 2004, Astroparticle Physics, 22, 275) and used to optimize the level of segmentation in the ACD design. The backsplash probability was measured with the as-built detector in the Calibration Unit Beam Test campaign in summer 2006, and the capability of the LAT Monte Carlo simulations to reproduce backsplash effect has been verified.
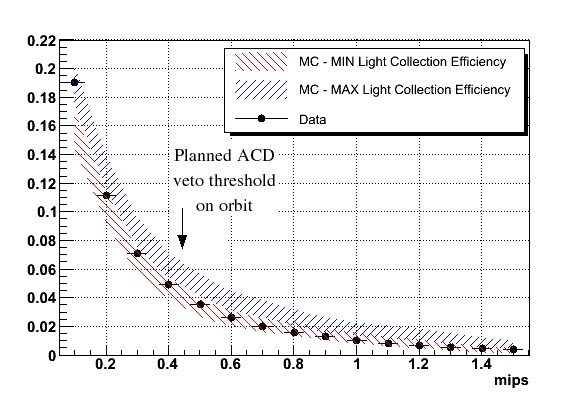
A careful analysis conducted by Luis C. Reyes demonstrated that the current LAT simulations reproduce well the backsplash effect. The LAT simulations take into consideration the energy loss fluctuations in the ACD tile, the Poisson fluctuations in the number of photoelectrons created in the readout photo-multiplier, and the corrections due to the non-uniform light collection at the edge of each tile. The latter currently represents the largest source of uncertainty in the present simulation, as it has not been measured yet for the ACD tiles installed on the LAT calibration unit. The expected backsplash distribution is therefore bracketed in the analysis by considering the maximum and minimum light collection efficiency measured for the tiles in the LAT (Moiseev et al, ACD paper, in preparation).
The result is shown in figure 1, and a beautiful reassuring agreement can be seen.
Details of this analysis will be shown at the collaboration meeting at GSFC next week, in a dedicated plenary session from the Beam Test Team where the state of the art of Data-MonteCarlo comparison will be presented to the collaboration.
Figure 1 - see attachment jpg
Figure 1 explanation: Backsplash probability distribution for an ACD tile as obtained from beam test data (black points) and Monte Carlo expectations. In every case, backsplash is expressed as the fraction of events for which the signal in the tile is above a given threshold. The error bars in the data are statistical 1 sigma. Monte Carlo simulations consider two extreme scenarios of light collection efficiency through the tile edge. In the MIN collection efficiency scenario, the collection efficiency decreases linearly from 100% (3 cm away from the edge) to 70% at the tile edge. In the MAX case, the light collection decreases linearly from 100% (1 cm away from the edge) to 90% at the tile edge. Both scenarios are shown in the backsplash distribution as bands that bracket the expected backsplash distribution. The width of each band is given by twice the statistical error 2 _sigma_obtained from the simulation.
Issue 1 - Fine-tuning the LAT
See the released issue here