General Information
This page collects various DCS control/monitoring information that include LV/HV control and monitoring, and monitoring of temperature, pressure, humidity etc. for both Lab setups and B33 integration. Interlocks have a dedicated page separately.
Collection of specs for LV/HV PSU and associated infrastructure
B84 EPP Lab Setup
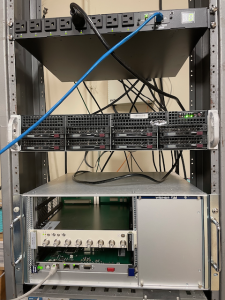
The B84 EPP lab DAQ readout and PSU communications are supported by the rack at the 'ATLAS corner', network switch and lab supplied on the test bench. The ITk DAQ Network page has detailed description of the readout network with the RDDEV111 host server and X display/terminal with fastx3. Key equipment that require remote power controls can take regular 110V A/C power from ports served by the TripLite PDU in the rack.
| EPP lab ATLAS rack Top: TripLite PDU unit for remote power control Middle: FELIX-712 Bottom: Wiener MPOD crate containing the ISEG HV module |
|---|
ISEG Control/Monitoring
Many PSUs and DCS monitoring components are from ISEG that are hosted in Wiener MPOD crates. An example control/monitoring of an ISEG HV module in the Wiener MPOD crate using SNMP in EPP lab from RDDEV111 through fastx3 on your laptop browser could look like this:
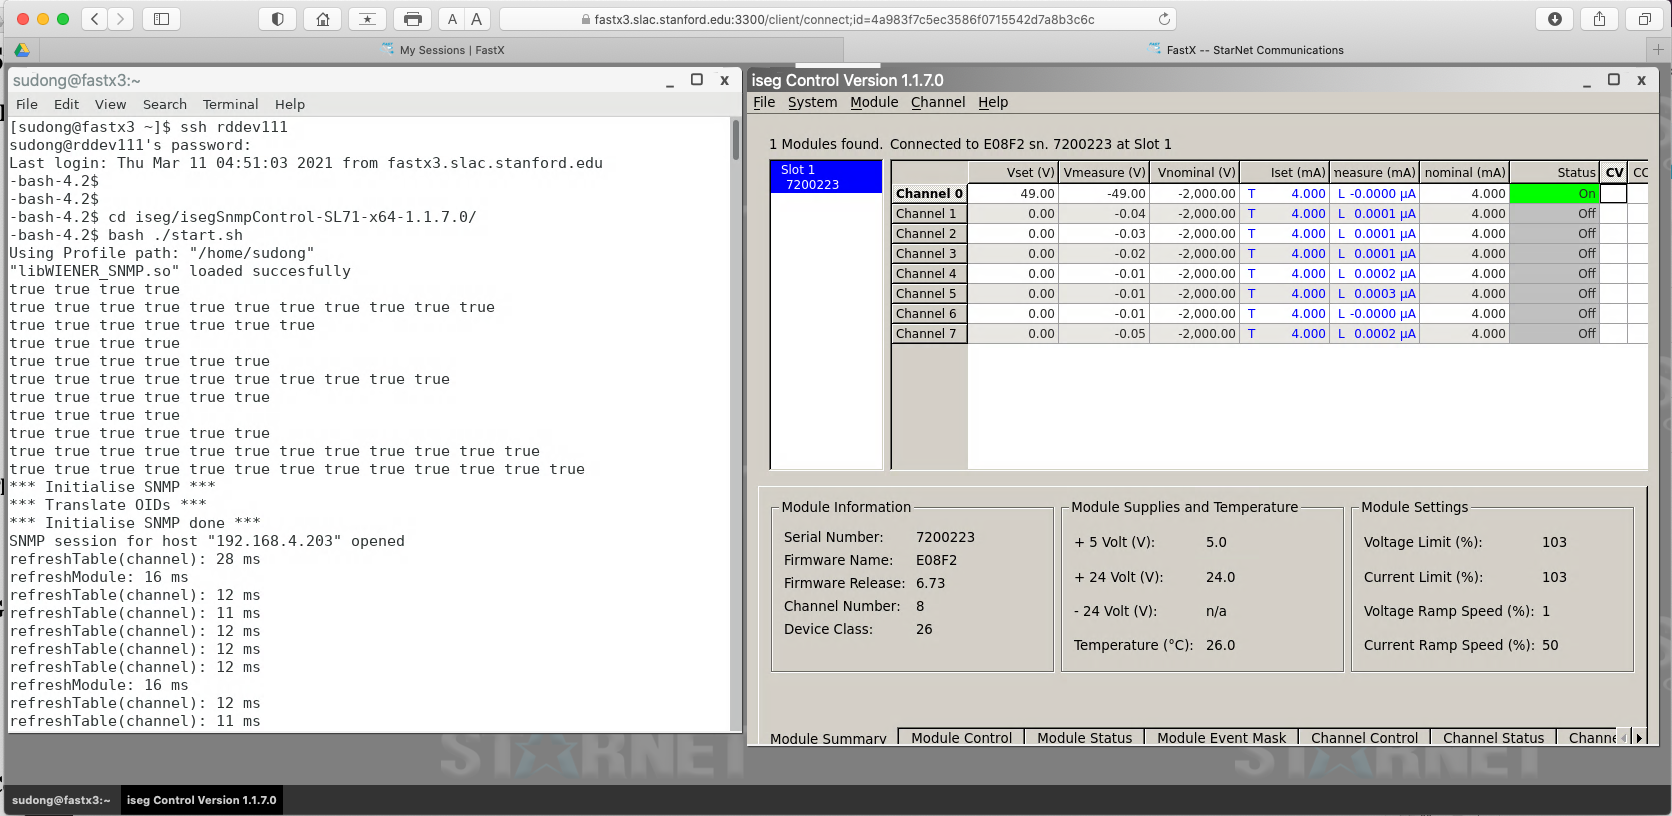
The Wiener MpodC controller itself is always on for basic communication to the crate when the crate is powered. To access the ISEG modules in the crate, the red on/off button on the MpodC controller module need to be ON to bring up power to the rest of the crate to make the ISEG modules visible.
The initial setup of the control software from a session on RDDEV111:
- wget https://iseg-hv.com/download/SOFTWARE/isegSNMPcontrol/current/isegSnmpControl-SL71-x64-1.1.7.0.zip
- unzip isegSnmpControl-SL71-x64-1.1.7.0.zip
- (one initial step already done by Matthias for initial common shared setup was to drop WIENER-CRATE-MIB.txt into /usr/share/snmp/mibs/)
Then each time to run control/monitoring session:
- cd isegSnmpControl-SL71-x64-1.1.7.0/
- bash ./start.sh
- (First run may ask for module IP address in IP dialog).
- Simply click Vset boxes to set desired values and right click Status box to get pull down menu to turn on/off etc.
Raspberry Pi Based Control/Monitoring
Many small lab test setups and some part of the B33 integration setup are standardizing to the use of Raspberry Pi 4 to mediate the ethernet connection to the ITk DAQ network for communication and connecting to various types of sensors using dedicated shields. The control/monitoring program running on Raspberry Pi can also reach out through the ITk DAQ network to e.g. Agilent PSU through PROLOGIX ETH-GBIP adaptor for integrated control of module power. Details of the setup can be found at https://docs.google.com/document/d/1MMfeTJlQxq9gqNzj3Ho_N8L8SXRJY5iV2XjEkD1vXNc/edit?usp=sharing
|
|
|---|---|
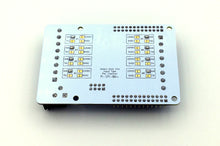
| Widgetloads Pi-SPi-8AI+ readout interface is widely in many test setups. It support 4 types of signals 4-20mA/5V VDC/10V VDC/Temp (NTC) which can be easily reconfigured to host a combination of these by solder fill of the appropriate pads at the back of the card. | |

Accessing Pi
to access the pi start by accessing rddev111 and then from there the pi via the commands.
ssh YOUR_USER_NAME@rddev111.slac.stanford.edu
ssh pi@raspi_cooling
(for sp chain testing the pi is at pi@ssc_raspi)
Interlock
Nothing should be needed to be done for the interlock. It should do everything on it's own. There is a script in /home/pi/dcs-interlock/Interlock titled restart_Interlock.sh that can be run if the interlock is tripped and doesn't automatically reset itself after a few minutes.
DCS
The DCS system is not quite finished it is however working in its current state.
To work the DCS access the pi as above then run the scripts in /home/pi/dcs-interlock/DCS
- To start the power supply
- ./start_peltier.py -V 10 10 0 -A 1 1 0 -C 110
- Where the three numbers after the V are the voltages and the three numbers after the A are the currents and then the three numbers after the C are the channels so 110 actives the first two channels and turns the third one off.
- ./start_module.py -V 10 -A 1.4
- ./stopDCS.py
- Turns off all the channels
- ./start_peltier.py -V 10 10 0 -A 1 1 0 -C 110
Note that this is working such that any computer with access to the Message broker on rddev111 can run this without access into the pi.
To add a new machine to the list you need to add the vhost and set permissions so on rddev111
sudo -u rabbitmq rabbitmqctl add_vhost {new_vhost_name}
sudo -u rabbitmq rabbitmqctl set_permissions -p "SP_chain" "Username" ".*" ".*" ".*"
Monitoring
Currently the monitoring is done via grafana. To access it start by forwarding the required server port to your local machine via the command
ssh -L 3000:localhost:3000 YOUR_USER_NAME@atlascr.slac.stanford.edu
Then in any web browser on your machine go to
http://localhost:3000/d/0YxPBumnk/power-of-dcs_coolings?orgId=1&from=now-5m&to=now&refresh=5s
From here you can see all the current data from the cooling stand.
(for the sp chain testing the grafana page is http://localhost:3000/d/rbFcf6W7k/sp-chain-dashboard?orgId=1&refresh=5s)
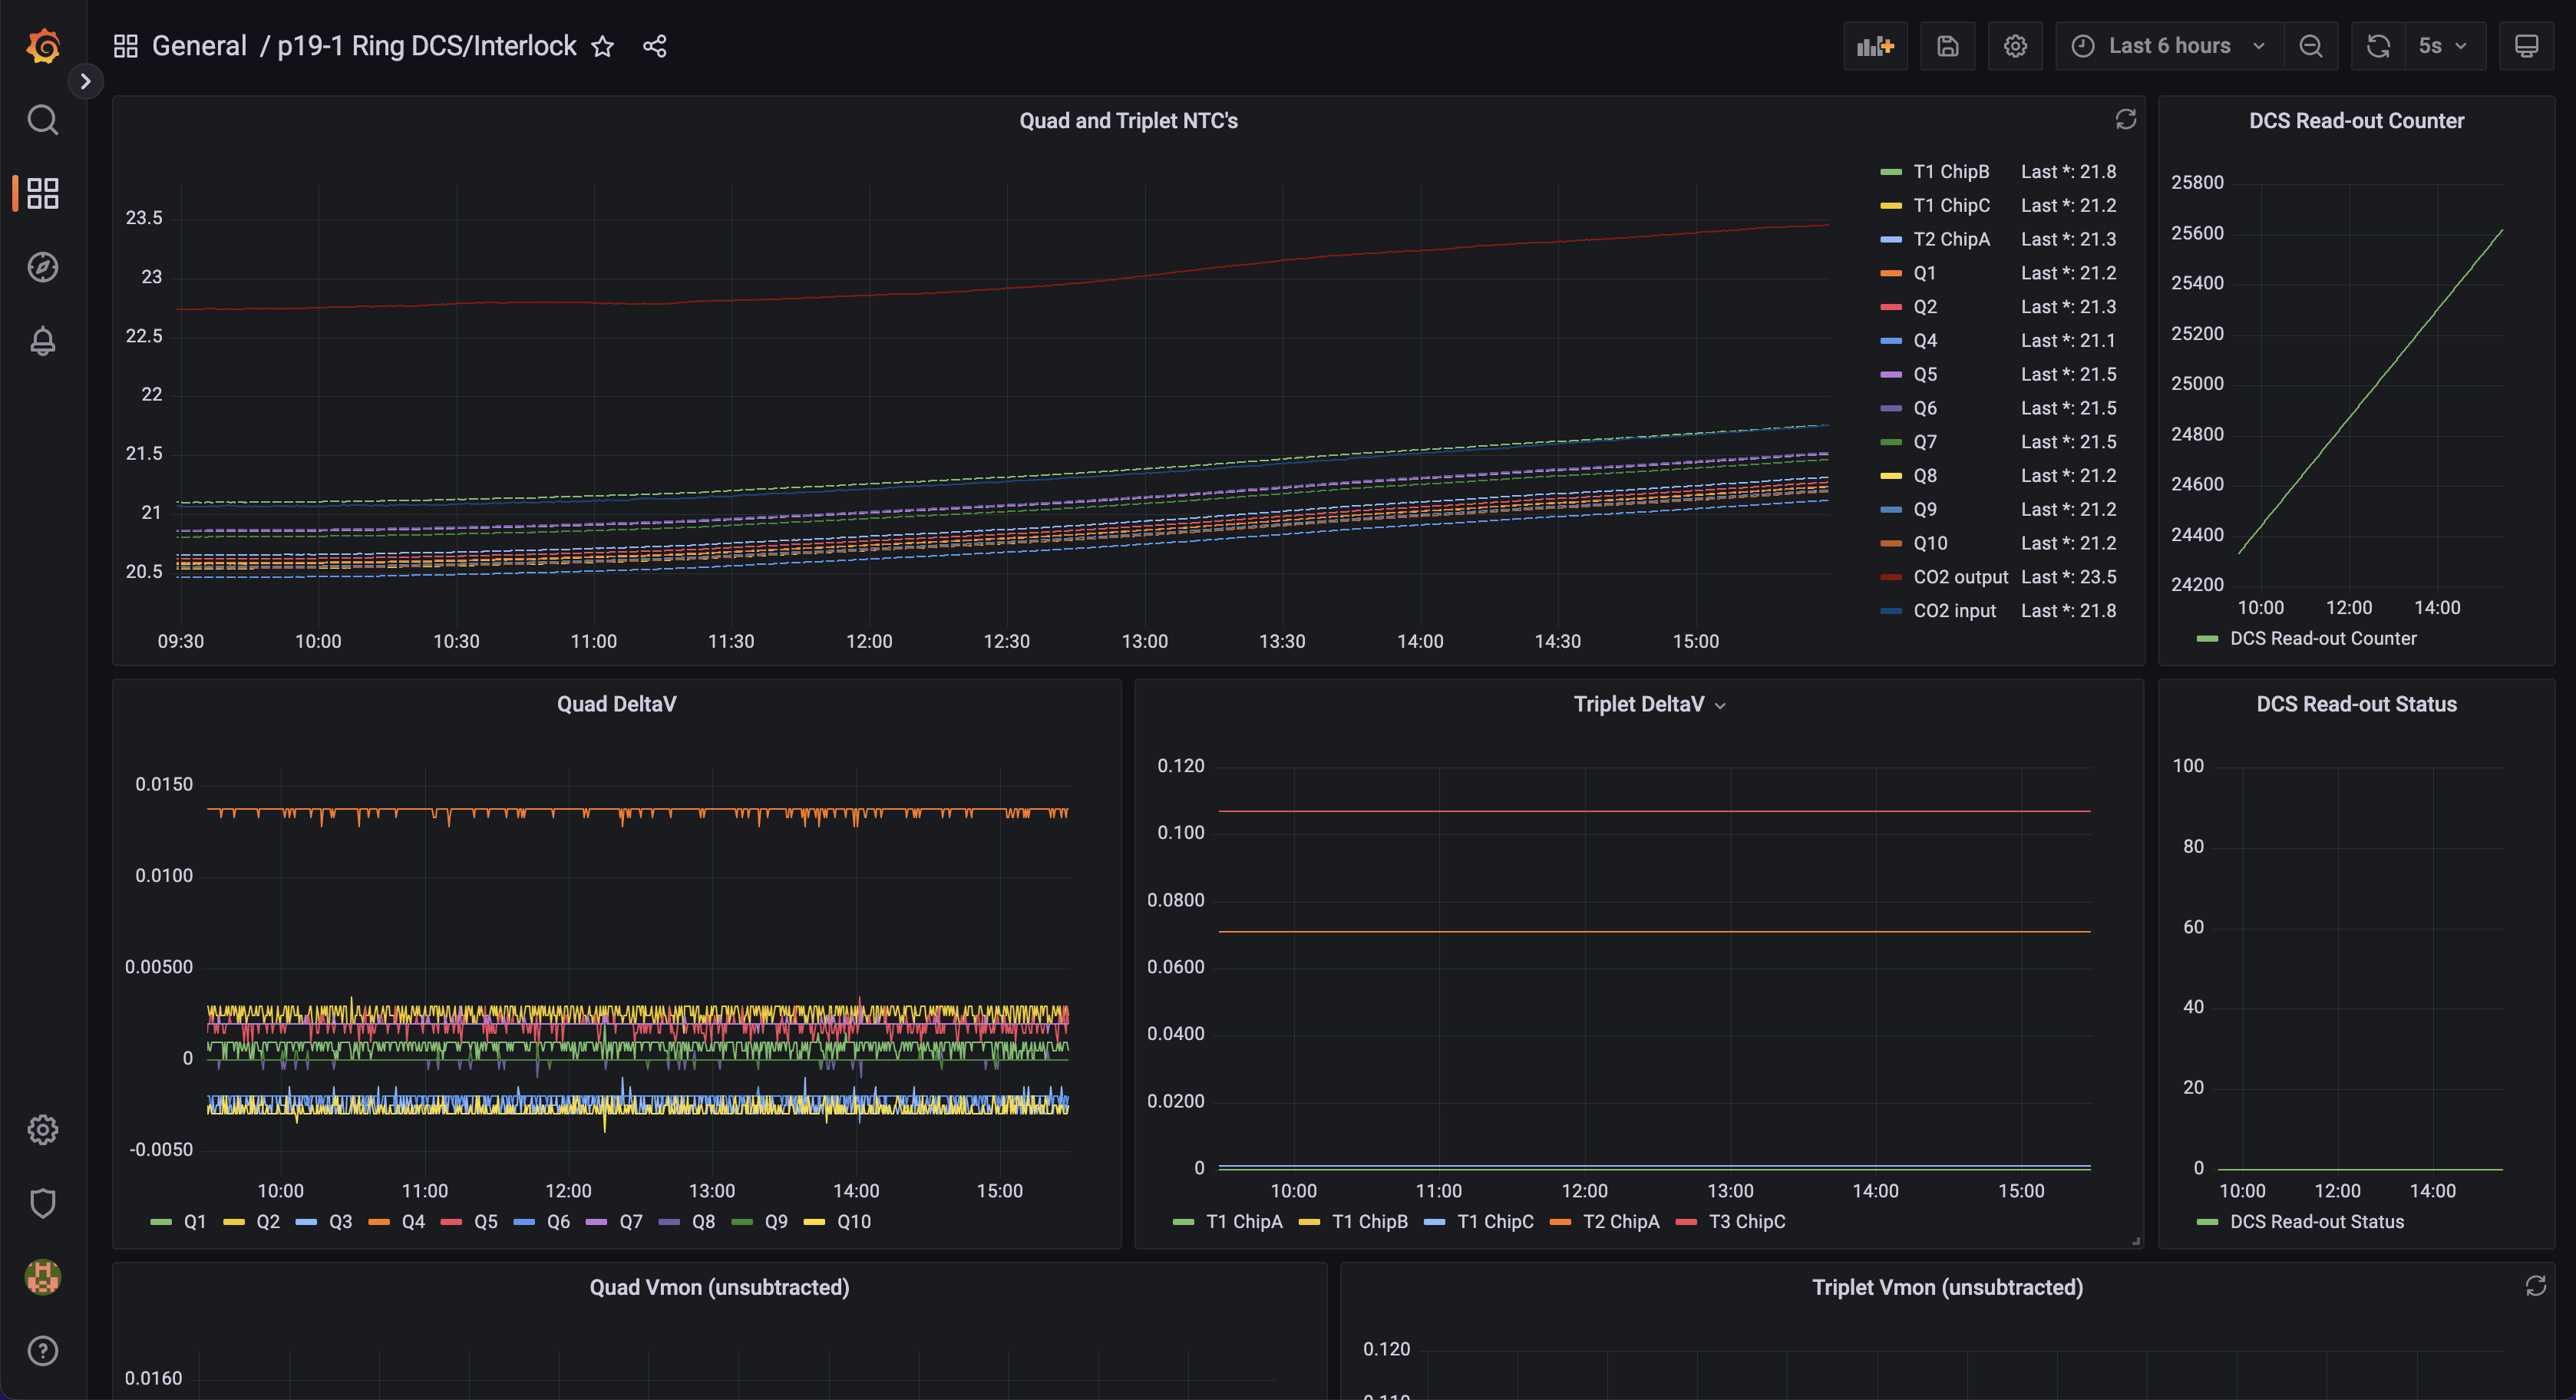
The DCS setup for the 19-1 Ring in the QC box is located at: http://atlascr.slac.stanford.edu:3000/d/cokMRQnVz/p19-1-ring-dcs-interlock?orgId=1&refresh=5s
You can see NTC and differential Vmon values for the quad and triplets, the DCS readout status and counter, as well the raw values from the MOPS emulator channels (see https://docs.google.com/spreadsheets/d/1Br6QM8IWy_frLFVSGQFpPXXCCUxYvTwKuwFI2_wtjt8/edit#gid=0 for the channel → DCS mapping). Readout is controlled by DCS_Script.py in pi@dcs-pi-interlock (pwd: raspberry) and is run via a cron job. The job can be temporarily suspended via
crontab -e (comment out the line)
pgrep -f DCS_Script.py
kill <PID>
Interlock build/connections/installation
Infomation about how the interlock and DCS is all hooked together can be found in the ICD document.

Installation instructions are on gitlab with all the source code at https://gitlab.cern.ch/nyoung/dcs-interlock
[ please add a) instructions to connect rasPI and display monitoring info. b) Instruction to Program/compile/install monitoring programs to run on rasPi. ]