The following statistics are from the Johns Hopkins University site (https://github.com/CSSEGISandData/COVID-19/blob/master/csse_covid_19_data/csse_covid_19_time_series/time_series_covid19_confirmed_global.csv)
Northern Hemisphere countries with contrasting strategies 8/31/20
Here we chose 9 countries in the Northern hemisphere with contrasting approaches to how they responded to the pandemic. All except India have high per capita incomes. The countries are:
| Name | Population (K) | Region | Income per capita ($) | Pop-Density (Kpop/sq-km) | Median Age (yrs) | Covid-19 information |
|---|---|---|---|---|---|---|
| Canada | 37742.154 | N America | 46510 | 0.004 | 41.4 | |
| Denmark | 5792.202 | N Europe | 54356 | 0.134 | 42.3 | https://en.wikipedia.org/wiki/COVID-19_pandemic_in_Denmark |
| Germany | 83783.942 | W Europe | 52556 | 0.235 | 46.6 | https://en.wikipedia.org/wiki/COVID-19_pandemic_in_Germany |
| India | 1380004.39 | S Asia | 7166 | 0.42 | 28.2 | https://en.wikipedia.org/wiki/COVID-19_pandemic_in_India https://en.wikipedia.org/wiki/Statistics_of_COVID-19_pandemic_in_India |
| Japan | 126476.461 | E Asia | 42067 | 0.335 | 48.2 | https://en.wikipedia.org/wiki/Timeline_of_the_COVID-19_pandemic_in_Japan |
| Sweden | 10099.265 | N Europe | 51405 | 0.022 | 41 | |
| Taiwan | 23816.775 | E Asia | 22497 | 0.658 | 42.2 | https://en.wikipedia.org/wiki/COVID-19_pandemic_in_Taiwan |
| United Kingdom | 67886.011 | W Europe | 44920 | 0.279 | 40.8 | https://en.wikipedia.org/wiki/COVID-19_pandemic_in_the_United_Kingdom |
| United States | 331002.651 | N America | 59928 | 0.035 | 38.3 | https://en.wikipedia.org/wiki/COVID-19_pandemic_in_the_United_States |
Also see
- Covid-19 - Visualizing the data with Motion Charts#19-VisualizingthedatawithMotionCharts-NordicandBalticcountries8/17/20 for more comparisons between Sweden and other North European countries.
confirmed cases linear Y-axis Click on chart for more information | confirmed/million population Click on chart for more information | Log10 confirmed/million population Click on chart for more information |
 |  |  |
deaths linear axis Click on chart for more information | deaths/million population Click on chart for more information | Log10 deaths/million population Click on chart for more information |
|---|---|---|
 |  |  |
% Deaths/confirmed Click on chart for more information | Daily confirmed per million population Click on chart for more information | Daily deaths per million population Click on chart for more information |
|---|---|---|
 |  |  |
Observations:
- In terms of total confirmed cases the US stands out as the leader with almost 6 million cases. India is next in line with almost 3.7 million cases.
- If one looks at the fraction of a country's population (in terms of cases/.million population) then again the US leads. The runner up is Sweden with about half the cases, followed by the UK, Canada, then Germany and Denmark running neck and neck, India, with Japan at 1/5th of india, but increasing, and Taiwan with about 1/25th of Japan's cases/million population.
- Confirmed cases continue to rise noticeably in all countries except Japan
- The log10 scale plot assists in seeing the differences between Japan and Taiwan.
- The steepest rises in confirmed cases per day per million population are for the US (~125 confirmed cases/day/million population) and India (~50 confirmed cases/day/million population).
- Deaths tell a similar story with the US leading with 183K deaths, followed by India with 65K deaths and the UK with 41.5K deaths.
- Deaths are still climbing in the US (~2.5/day/million population) and India (~0.6/day/million population) while other countries have pretty much stabilized at under 0.25 deaths/day/million population.
- The ratio of deaths/confirmed cases is highest for the UK followed by Canada and Sweden, followed by Germany and Denmark. The ratio is dropping with time.
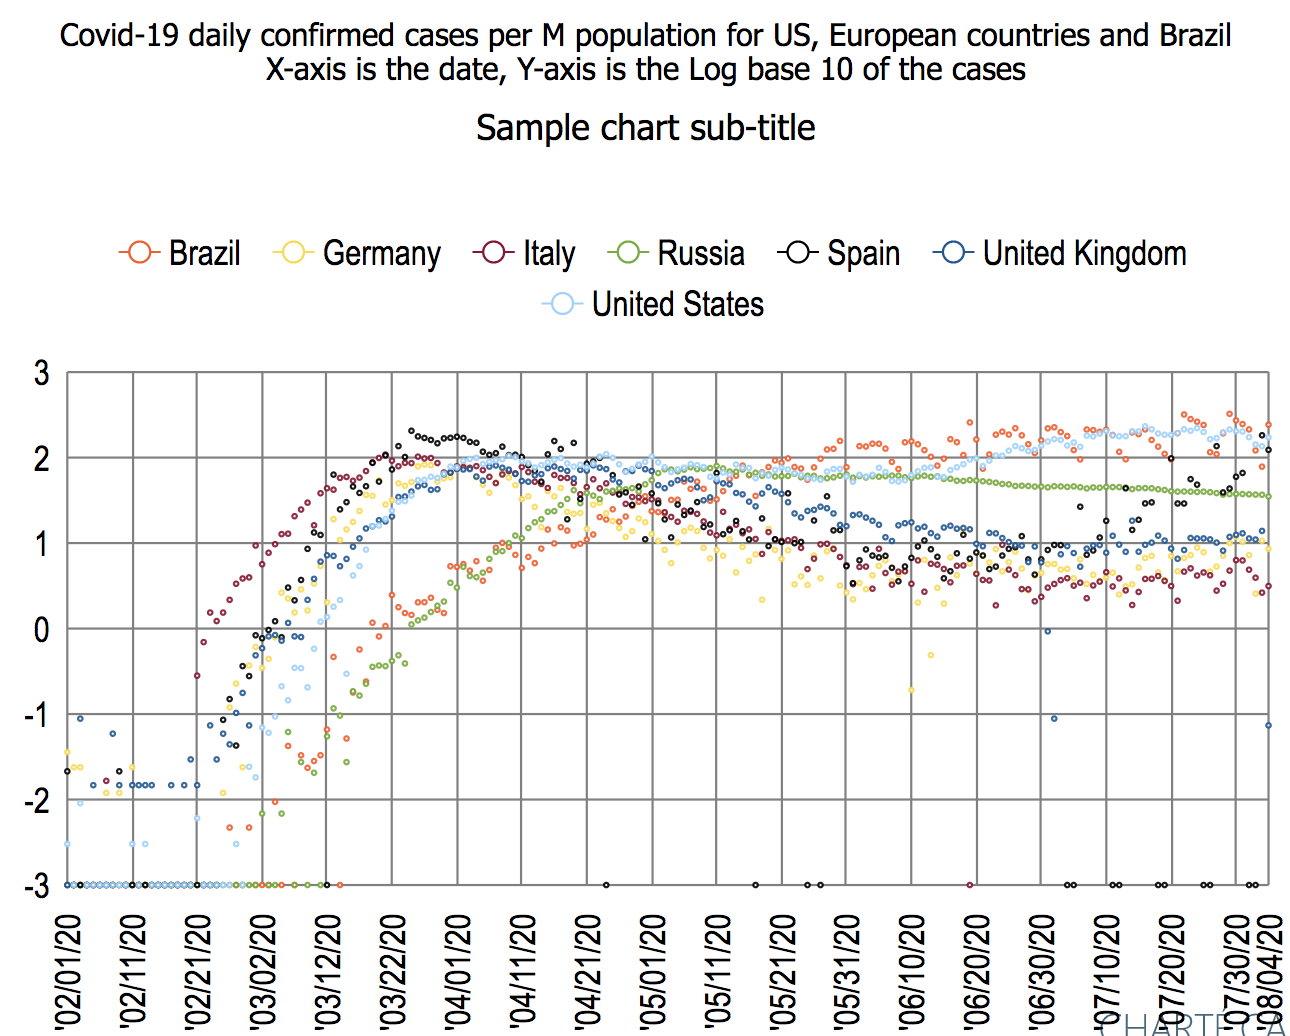
Top ten countries with Covid-19 cases 8/9/20
Daily confirmed Click on the chart for more information | Daily deaths Click on the chart for more information |
|---|---|
 |  |
Total deaths/confirmed cases Click on the chart for more information |
|---|
 |
Observations among these countries:
- Iran was the first of the big 10 countries to record confirmed cases and deaths. The US followed about 2 weeks later.
- Iran peaked at the end of March. Iran's daily confirmed cases per capita hen dropped until the start of May after which they surged again and have held steady after the second week in June.
- The US daily confirmed cases per capita started to decline after the start of May but then increased again in the 30 days starting in the 3rd week of June.
- Russia's daily confirmed cases per capita caught up with the US at the start of June, then after tracking the US until around June 16th and then continued its downward slope while the US increased.
- Chile has the largest number of daily reported confirmed cases per capita from the 4th week of May to the 4th week of June.
- India's daily confirmed cases per capita and. deaths per capita have not peaked yet.
- Looking at the ratio of daily deaths/confirmed cases:
- Mexico has more than a factor 2 (nb. the y scale is log base 10) daily deaths/confirmed cases than any other country.
- Russia and S. Africa have the lowest daily deaths/confirmed cases since the end of June.
- Brazil, the US and India have reduced their ratio over the last two and a half months while Chlle's and Russia's has increased
Countries with the leading numbers of cases 7/28/2020
As of 7/28/2020, the US leads in confirmed cases :
| Confirmed | ID | Population (K) | Covid-19 confirmed | deaths | deaths / confirmed% | confirmed / MPop | deaths /M Pop | |
| United States | us | 331002.651 | 4339600 | 149087 | 3.44 | 13110.469 | 450.41029 | |
| Brazil | br | 212559.417 | 2483191 | 88539 | 3.57 | 11682.3382 | 416.53765 | |
| India | in | 1380004.39 | 1531669 | 34193 | 2.23 | 1109.90154 | 24.777457 | |
| Russia | ru | 145934.462 | 822060 | 13483 | 1.64 | 5633.07658 | 92.390788 | |
| South Africa | za | 59308.69 | 459761 | 7257 | 1.58 | 7752.00059 | 122.359809 | |
| Mexico | mx | 128932.753 | 402697 | 44876 | 11.14 | 3123.31034 | 348.057409 | |
| Peru | pe | 32971.854 | 395005 | 18612 | 4.71 | 11980.0664 | 564.481451 | |
| Chile | cl | 19116.201 | 349800 | 9240 | 2.64 | 18298.6149 | 483.359638 | |
| United Kingdom | uk | 67886.011 | 302261 | 45963 | 15.21 | 4452.47844 | 677.061435 | |
| Iran | ir | 83992.949 | 296273 | 16147 | 5.45 | 3527.35561 | 192.242327 | |
The US also leads in the number of deaths:
| State | ID | Population(K) | Covid-19 confirmed | deaths | deaths/confirmed% | confirmed/MPop | deaths/MPop | |
| United States | us | 331002.651 | 4339600 | 149087 | 3.44 | 13110.469 | 450.41029 | |
| Brazil | br | 212559.417 | 2483191 | 88539 | 3.57 | 11682.3382 | 416.53765 | |
| United Kingdom | uk | 67886.011 | 302261 | 45963 | 15.21 | 4452.47844 | 677.061435 | |
| Mexico | mx | 128932.753 | 402697 | 44876 | 11.14 | 3123.31034 | 348.057409 | |
| Italy | it | 60461.826 | 246488 | 35123 | 14.25 | 4076.75415 | 580.911996 | |
| India | in | 1380004.39 | 1531669 | 34193 | 2.23 | 1109.90154 | 24.777457 | |
| France | fr | 65273.511 | 221077 | 30226 | 13.67 | 3386.93287 | 463.066863 | |
| Spain | es | 46754.778 | 280610 | 28436 | 10.13 | 6001.73954 | 608.194525 | |
| Peru | pe | 32971.854 | 395005 | 18612 | 4.71 | 11980.0664 | 564.481451 | |
| Iran | ir | 83992.949 | 296273 | 16147 | 5.45 | 3527.35561 | 192.242327 | |
If one normalizes by dividing by the population then the United States drops to eighth in the world in reported confirmed cases per population:
| State | ID | Population(K) | Covid-19 confirmed | deaths | deaths/confirmed% | confirmed/MPop | deaths/MPop | |
| Qatar | qa | 2881.053 | 109880 | 167 | 0.15 | 38138.8333 | 57.964918 | |
| French Guiana | gf | 298.682 | 7562 | 43 | 0.57 | 25317.8966 | 143.965823 | |
| Bahrain | bh | 1701.575 | 39921 | 141 | 0.35 | 23461.2051 | 82.864405 | |
| Chile | cl | 19116.201 | 349800 | 9240 | 2.64 | 18298.6149 | 483.359638 | |
| Oman | om | 5106.626 | 77904 | 402 | 0.52 | 15255.474 | 78.721254 | |
| Kuwait | kw | 4270.571 | 65149 | 442 | 0.68 | 15255.3371 | 103.49904 | |
| Panama | pa | 4314.767 | 62223 | 1349 | 2.17 | 14420.9409 | 312.647241 | |
| United States | us | 331002.651 | 4339600 | 149087 | 3.44 | 13110.469 | 450.41029 | |
| Armenia | am | 2963.243 | 37629 | 719 | 1.91 | 12698.5873 | 242.639568 | |
| Peru | pe | 32971.854 | 395005 | 18612 | 4.71 | 11980.0664 | 564.481451 | |
and drops to 9th in deaths per population.
| State | ID | Population(K) | Covid-19 confirmed | deaths | deaths / confirmed% | confirmed / M Pop | deaths / M Pop | |
| Belgium | be | 11589.623 | 66662 | 9833 | 14.75 | 5751.86958 | 848.431394 | |
| United Kingdom | uk | 67886.011 | 302261 | 45963 | 15.21 | 4452.47844 | 677.061435 | |
| Spain | es | 46754.778 | 280610 | 28436 | 10.13 | 6001.73954 | 608.194525 | |
| Italy | it | 60461.826 | 246488 | 35123 | 14.25 | 4076.75415 | 580.911996 | |
| Sweden | se | 10099.265 | 79494 | 5702 | 7.17 | 7871.26588 | 564.595542 | |
| Peru | pe | 32971.854 | 395005 | 18612 | 4.71 | 11980.0664 | 564.481451 | |
| Chile | cl | 19116.201 | 349800 | 9240 | 2.64 | 18298.6149 | 483.359638 | |
| France | fr | 65273.511 | 221077 | 30226 | 13.67 | 3386.93287 | 463.066863 | |
| United States | us | 331002.651 | 4339600 | 149087 | 3.44 | 13110.469 | 450.41029 | |
| Brazil | br | 212559.417 | 2483191 | 88539 | 3.57 | 11682.3382 | 416.53765 | |
In terms of deaths/confirmed the Unites States drops to 55th highest among 179 countries.
Daily cases 7/31/2020
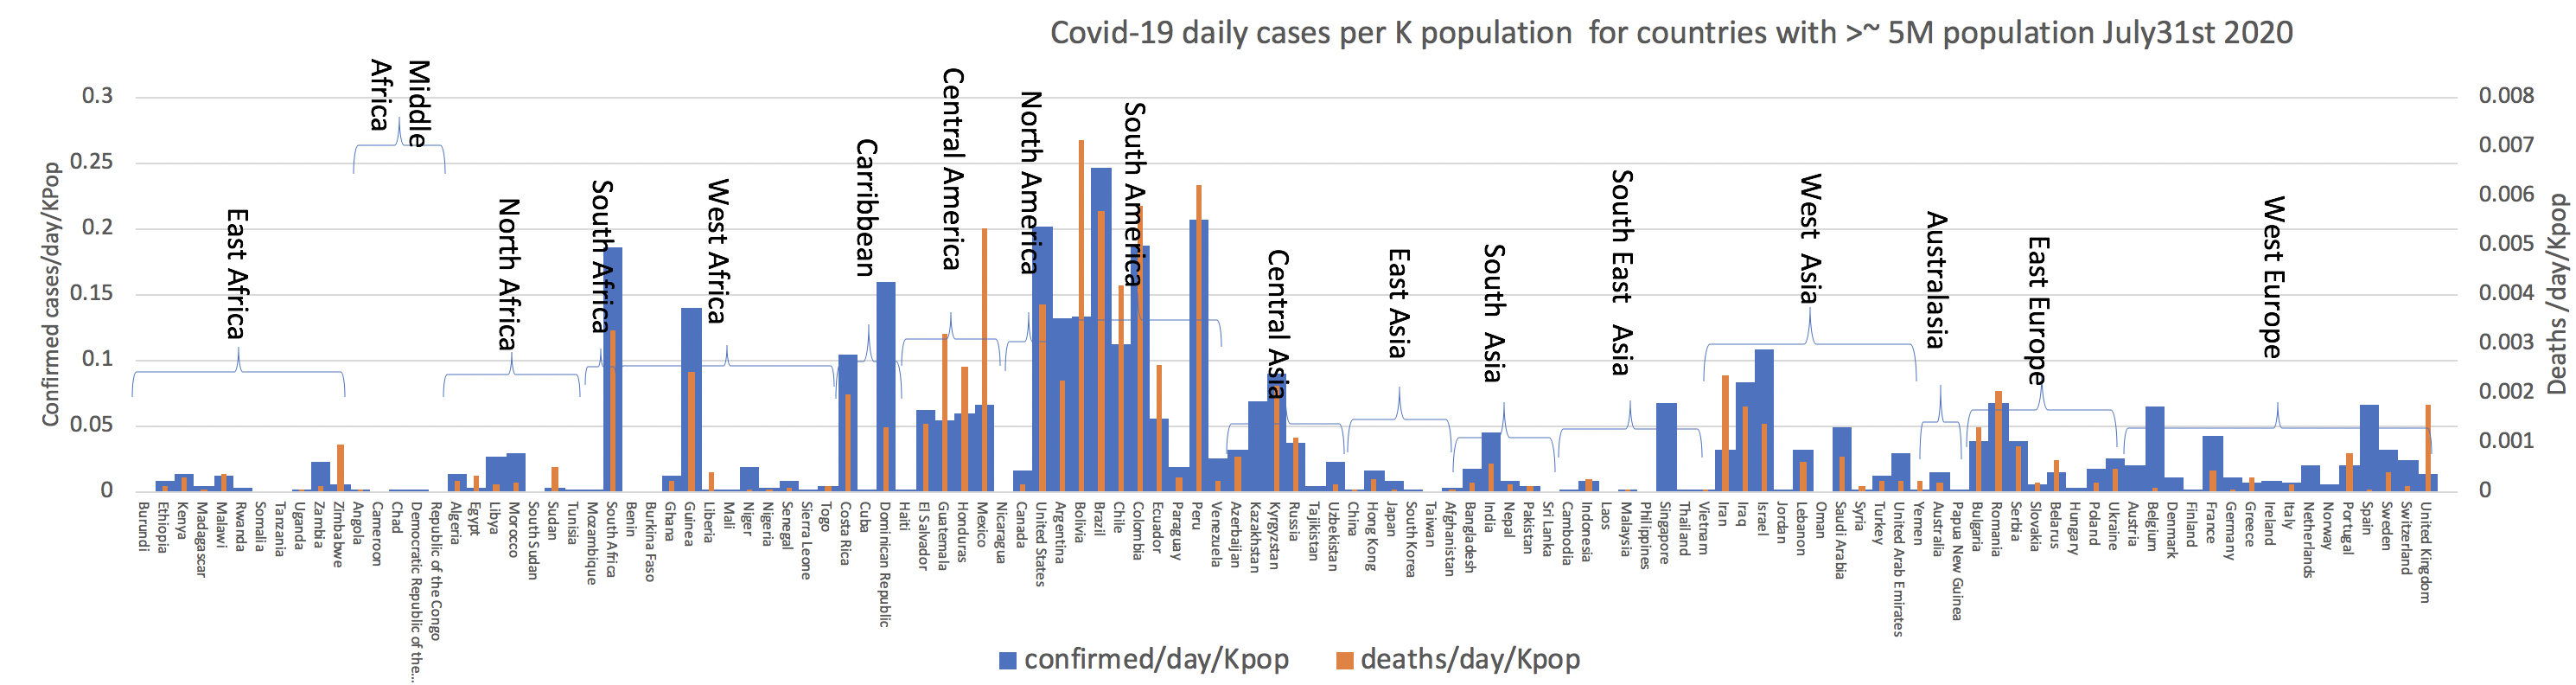
Looking in more details the leading countries by confirmed cases per day per 1000 population on July 31st were:
| Region | Population (K) | confirmed/day/Kpop | deaths/day/pop | |
| Brazil | America South | 212559.417 | 0.2464 | 0.005702 |
| Peru | America South | 32971.854 | 0.2065 | 0.006217 |
| United States | America North | 331002.651 | 0.2018 | 0.003788 |
| Colombia | America South | 50882.891 | 0.1865 | 0.005798 |
| South Africa | Africa South | 59308.69 | 0.1857 | 0.003254 |
| Dominican Republic | America Carribbean | 10847.91 | 0.1598 | 0.001291 |
| Guinea | Africa West | 13132.795 | 0.139 | 0.002437 |
| Bolivia | America South | 11673.021 | 0.1332 | 0.00711 |
| Argentina | America South | 45195.774 | 0.1312 | 0.002257 |
| Chile | America South | 19116.201 | 0.1115 | 0.004185 |
And by deaths:
| Region | Population (K) | confirmed/day/Kpop | deaths/day/pop | |
| Bolivia | America South | 11673.021 | 0.1332 | 0.00711 |
| Peru | America South | 32971.854 | 0.2065 | 0.006217 |
| Colombia | America South | 50882.891 | 0.1865 | 0.005798 |
| Brazil | America South | 212559.417 | 0.2464 | 0.005702 |
| Chile | America South | 19116.201 | 0.1115 | 0.004185 |
| United States | America North | 331002.651 | 0.2018 | 0.003788 |
| South Africa | Africa South | 59308.69 | 0.1857 | 0.003254 |
| Guinea | Africa West | 13132.795 | 0.139 | 0.002437 |
| Argentina | America South | 45195.774 | 0.1312 | 0.002257 |
| Dominican Republic | America Carribbean | 10847.91 | 0.1598 | 0.001291 |
Comparing the spread of Covid19 in Canada and the US with larger W European countries
Confirmed Cases
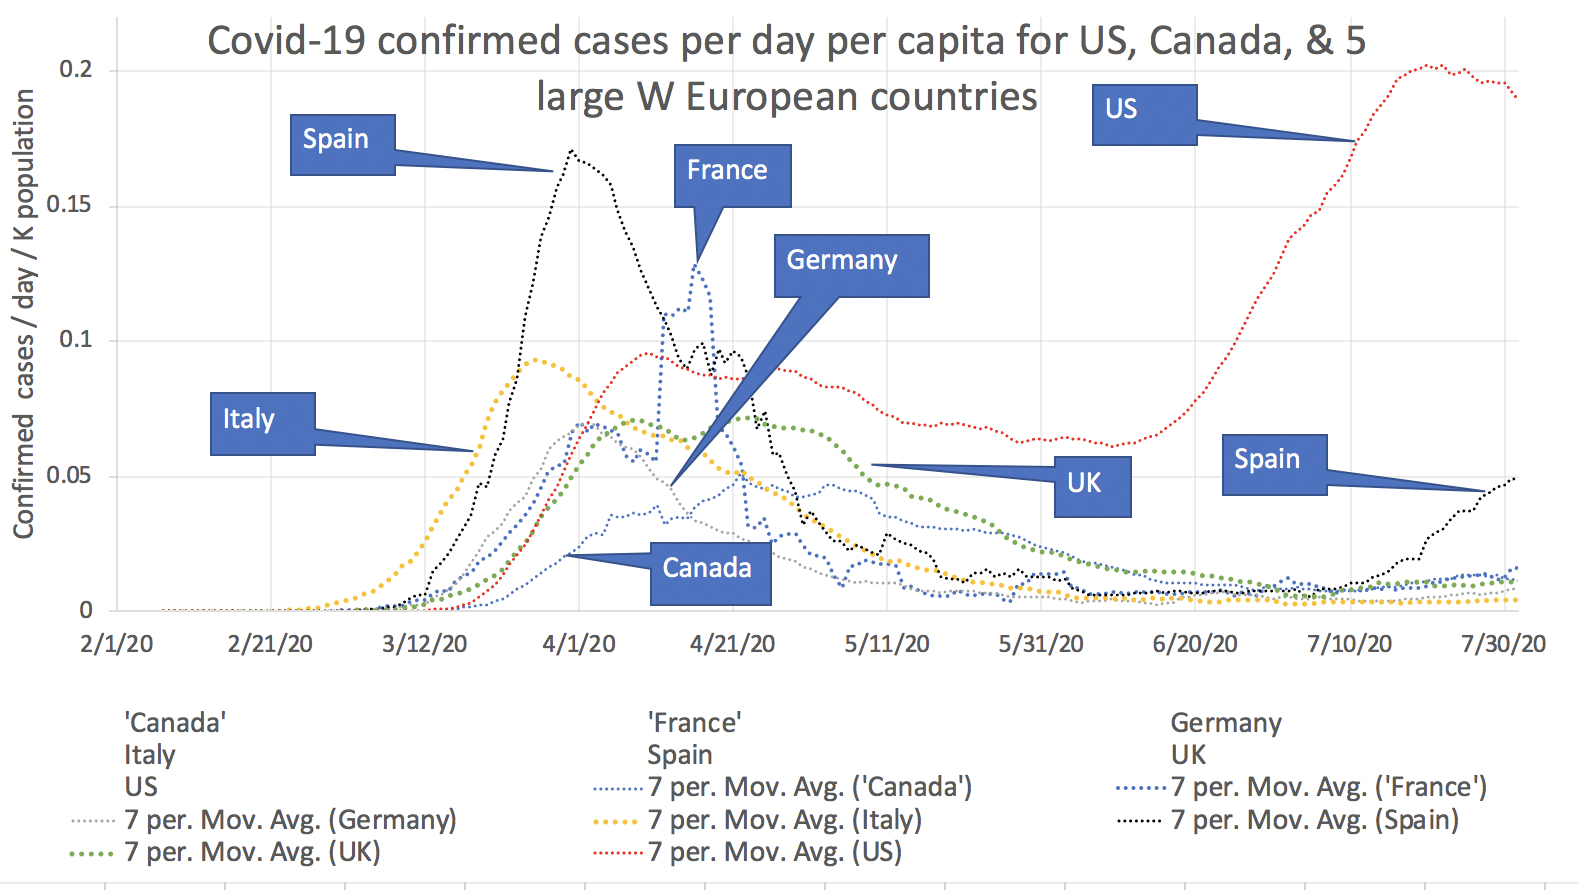
It is seen that Italy was the first country whose Covid-19 confirmed cases spike. This was followed by Spain then Germany and France. Germany was particularly successful in suppressing its peak. The UK has a long tail and the virus has just run away in the US which now has about 10 times more confirmed cases as the other countries with the exception of Spain. Recently Spain has seen an uptick in cases
Deaths
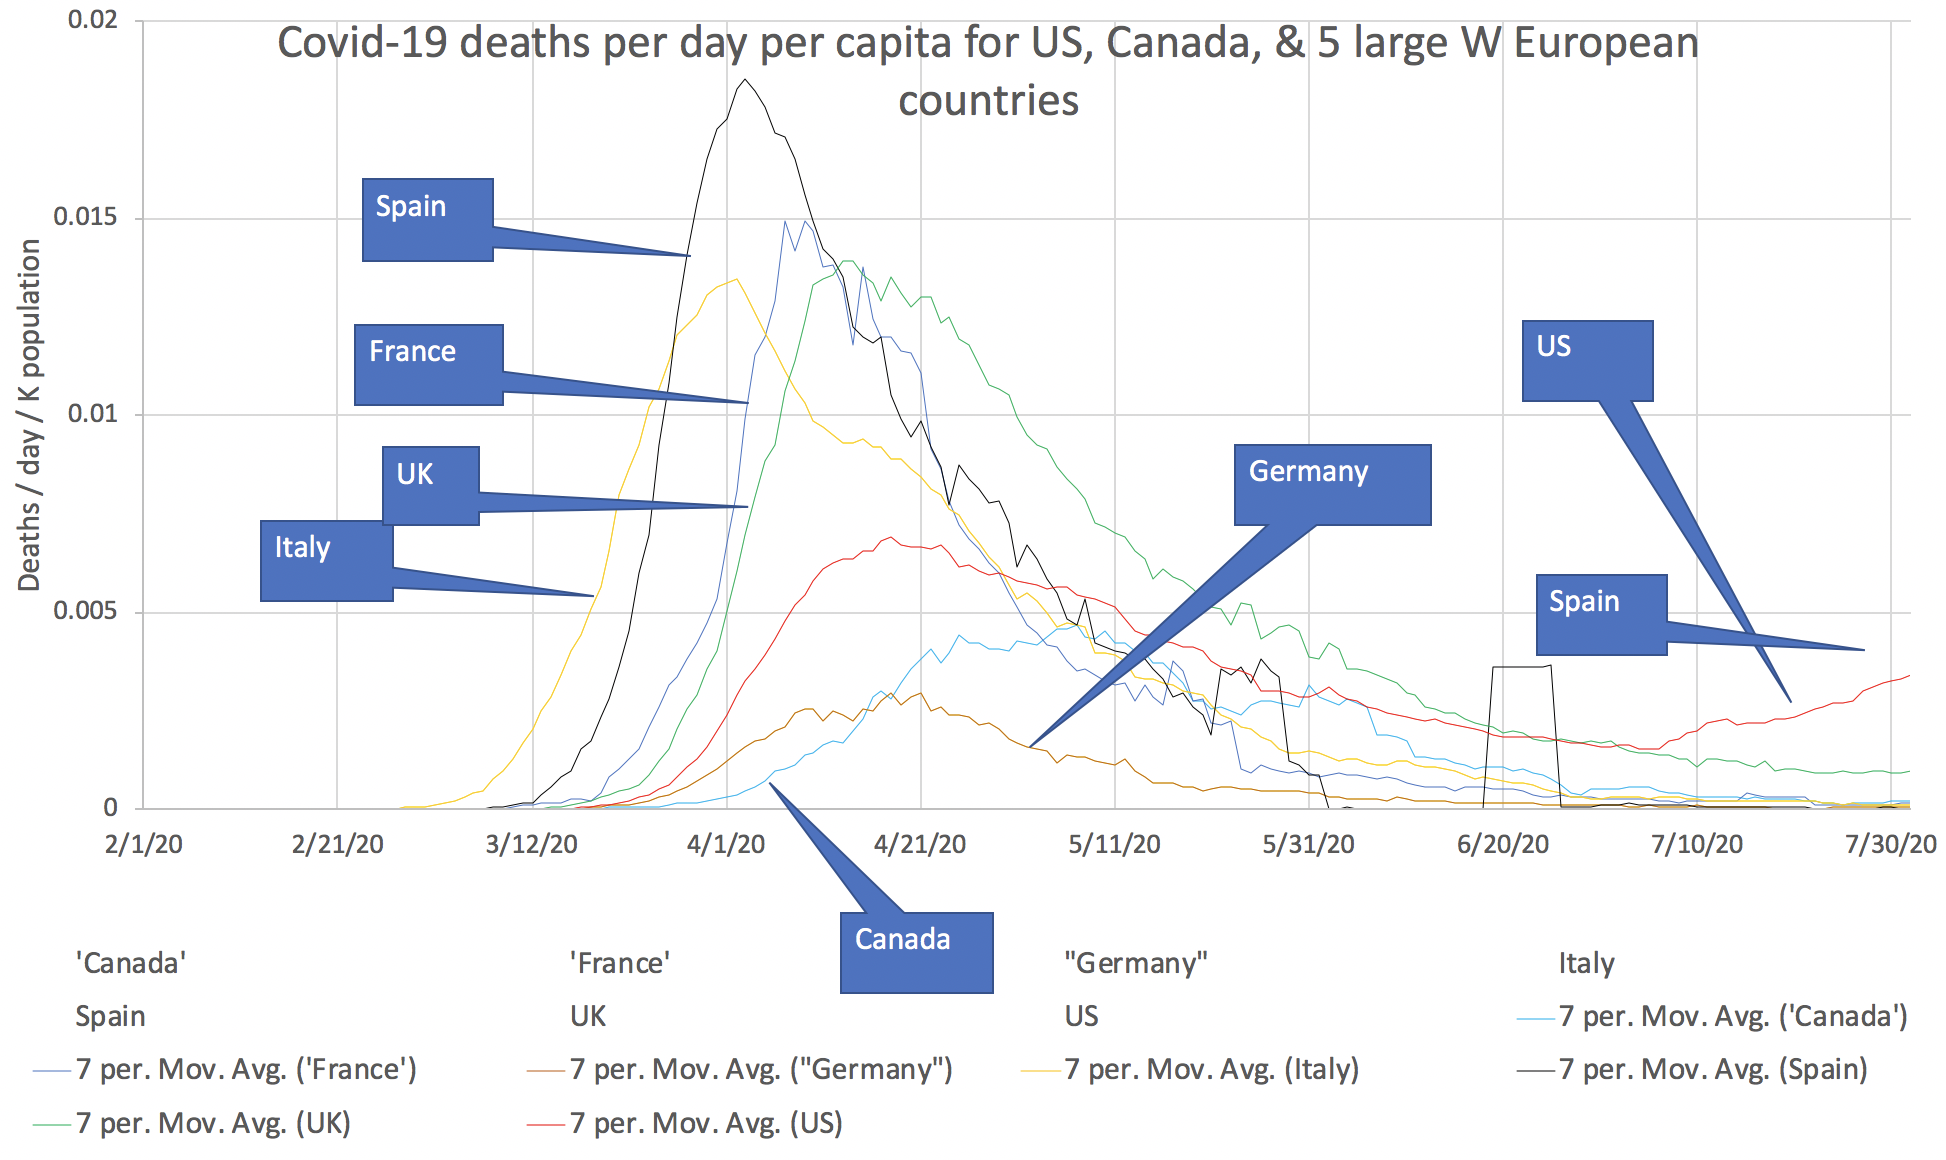

It is seen that US deaths / day / capita are over three times that of the nearest competitor (UK) and over 10 times greater than the next competitor (France)
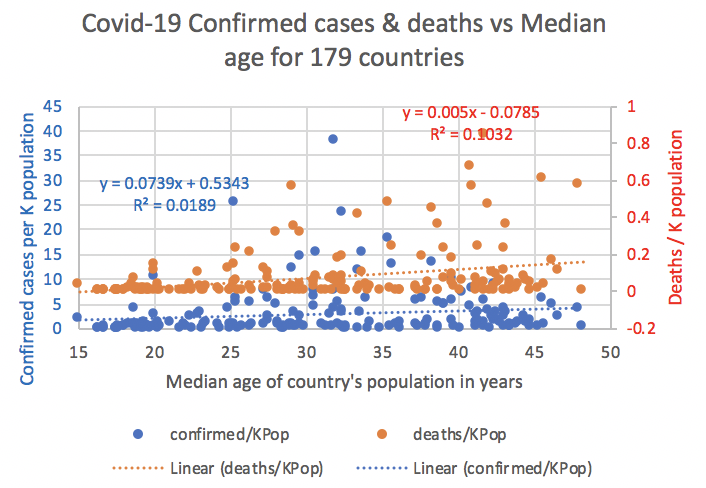
Possible correlation of Covid-19 cases per capita versus median population age for world's countries
The median population age varies by country from about 15 to 50. The 15 countries with the lowest median population age are all in Africa.
| State | ID | Population(K) | Median Age (yrs) | Income per capita($) | Covid-19 confirmed | deaths | deaths/confirmed% | confirmed/KPop | deaths/KPop |
| Niger | ne | 24206.644 | 15.1 | 1019 | 42936 | 937 | 2.18 | 1.773728 | 0.038708 |
| Mali | ml | 20250.833 | 16.4 | 2218 | 2520 | 124 | 4.92 | 0.124439 | 0.006123 |
| Uganda | ug | 45741.007 | 16.4 | 1868 | 1135 | 2 | 0.18 | 0.024814 | 0.000044 |
| Chad | td | 16425.864 | 16.700001 | 1945 | 926 | 75 | 8.1 | 0.056375 | 0.004566 |
| Angola | ao | 32866.272 | 16.799999 | 6658 | 1000 | 47 | 4.7 | 0.030426 | 0.00143 |
| Somalia | so | 15893.222 | 16.799999 | 3212 | 93 | 2.9 | 0.202099 | 0.005852 | |
| Burundi | bi | 11890.784 | 17.5 | 735 | 378 | 1 | 0.26 | 0.031789 | 0.000084 |
| Gambia | gm | 2416.668 | 17.5 | 1699 | 326 | 8 | 2.45 | 0.134896 | 0.00331 |
| Burkina Faso | bf | 20903.273 | 17.6 | 1866 | 1105 | 53 | 4.8 | 0.052863 | 0.002535 |
| Mozambique | mz | 31255.435 | 17.700001 | 1250 | 1720 | 11 | 0.64 | 0.05503 | 0.000352 |
| Tanzania | tz | 59734.218 | 17.700001 | 2948 | 509 | 21 | 4.13 | 0.008521 | 0.000352 |
| Zambia | zm | 18383.955 | 17.700001 | 4033 | 5002 | 142 | 2.84 | 0.272085 | 0.007724 |
| Malawi | mw | 19129.952 | 18.1 | 1205 | 3709 | 103 | 2.78 | 0.193884 | 0.005384 |
| Nigeria | ng | 206139.589 | 18.1 | 5887 | 41804 | 868 | 2.08 | 0.202795 | 0.004211 |
| Central African Republic | cf | 4829.767 | 18.299999 | 727 | 4599 | 59 | 1.28 | 0.95222 | 0.012216 |
Since Covid-19 death rates appear to be higher for older people (see for example https://www.cdph.ca.gov/Programs/CID/DCDC/Pages/COVID-19/COVID-19-Cases-by-Age-Group.aspx for California), we looked at the Covid-19 deaths per capita for 179 countries versus a country's population median age. However, there appears to be very little correlation.