PingER Pros
Low Bandwidth utilization
The PingER MA sends up to 30 x 100Byte pings at 1 second intervals (or 800bits/second) and up to 30 1000Byte pings at 1 second intervals (8000/second) to each target until it receives up to 10 responses from the target or times out in 30 seconds. In the case of the main MA at SLAC that monitors about 800 nodes, each 30 minutes this corresponds to an aggregate data rate of ~7Mbit/sec.
Regularity of measurements
- PingER makes measurements at regular intervals and thus has results by time of day, day of month, month by month, and year by year going back to 1998.
- Also the regularity of measurements can enable measurement of the timing and impact of events such as: earthquakes, tsunamis, social upheavals, mistaken routing, changing from geo-stationary satellite links to terrestrial links etc.
- PingER has a history of Internet performance using a single mechanism for two decades
- PingER has measurements by country, region.
Simplicity of set up
- PingER does not require any software to be installed in the targets.
- PingER uses common targets using the standard Internet path to them, as opposed to selecting only well-connected targets.
Validity
Estimating the throughput using the ping loss and Round Trip Time (RTT) and the Mathis formula (see https://www.slac.stanford.edu/comp/net/wan-mon/thru-vs-loss.html) and comparing with the TCP throughput using ttcp (see https://en.wikipedia.org/wiki/Ttcp) gave good agreement.
PingER Cons
TCP throughput estimation
This uses The macroscopic behavior of the TCP congestion avoidance algorithm by Mathis, Semke, Mahdavi & Ott in Computer Communication Review, 27(3), July 1997, that provides a short and useful formula for the upper bound on the transfer rate: Rate <= (MSS/RTT)*(1 / sqrt{p})
where:
Rate: is the TCP transfer rate or throughput
MSS: is the maximum segment size (fixed for each Internet path, typically 1460 bytes)
RTT: is the round trip time (as measured by TCP)
p: is the packet loss rate.
- This is for a single TCP stream
- Use of multi-stream TCP to achieve high throughput is fairly common today
- Based on TCP Reno implementation.
- Today's standard for Linux is based on CUBIC (see https://www.noction.com/blog/tcp-transmission-control-protocol-congestion-control)
- Fails for no packet loss
- Assuming no loss, in a day PingER will send 480 packets from an MA to a target, or a loss rate of < 0.2%. In a 30 day month it sends 14,400 packet and no loss is a loss rate of < 0.007% and in a year 172,800 packets or loss < 0.00058%.
- No loss in a month is commonly observed for targets with excellent network connectivity (e.g. Singapore).
- When calculating annual throughputs, we filter out months with no loss.
No separate estimates of upload and download speeds
does PingER differ from speed tests
This is similar to monitor-io (see https://www.monitor-io.com/monitor-io-vs-speed-tests.html), where it says:
Internet service providers typically publish upload and download speeds to describe the size of the connection to the home. The test itself is not a real-world measure; actual user traffic rarely uses the connection this way. Thus it is very rare, if ever, to actually get the published speed when using the network.
Speed tests identify a server, typically not far from the source, and send multiple large samples of data to it and then back from it. The data is significant enough to extend beyond the capacity of the connection in order to measure the time it takes to move all the information. It is similar to trying to see how many cars can move on a highway by sending a lot of cars on it until all lanes are full. Clearly, not something that should be done too often because it saturates your network.
Most applications (other than large multi-threaded file uploads and downloads) do not push the boundaries of this measurement and therefore, while useful, are not the only test of internet performance that is relevant. Most video applications, adjust the rate of transmission of packets to a comfortable speed to give the best user experience. As long as there are no other issues, most modern connections have more than sufficient bandwidth (in spite of the attempt by some internet service providers to convince subscribers otherwise).
The monitor-io service sends a small number of packets, in a planned sequence, to different destinations to measure performance. The packets are analyzed in a detailed fashion to extract the precise cause of poor performance. It is the equivalent of sending one car to see if the road is congested, and documenting the issues seen by the car. By sending packets to different points on the globe, monitor-io has a better sense of the performance across different paths and provides a more real-world view of how any end-user would experience network performance.
The device that runs the monitor-io tests is tuned to perform only this one function and is independent of any interference from other applications, thereby guaranteeing accurate measurements. When the device is connected directly to the first router on the premises, it will give the most accurate view of the performance of the internet service provider.
The service keeps track of all this data so that a user can get a historical view of the quality and reliability of their internet service. It also alerts them if there is impaired or degraded performance at any time of the day. In fact, if they do want to do a standard bandwidth speed test, monitor-io allows them to run one from directly within our site as a sanity check...but we believe that our 24x7 lightweight test sequence will be much more useful.
Providers of Internet speeds by Country
It is understood that different providers of Internet speeds can have very different results. For example see the following comparison of Akamai and M-Lab (from https://www.fastmetrics.com/internet-connection-speed-by-country.php#top-10-comparison-2018):
Differences:
- South Korea comes in at 30th place for download speed in the new top 50, via M-Lab data.
- South Korea was a leader in average internet speeds from Akamai data, since Q4 of 2015.
- Between 2017 - 2018, M-Lab data shows South Korea dropping 14 positions for average download speed.
- Over 2017 - 2018, M-Lab data shows no change to the top 2 countries for average internet download speed. (Singapore 1st and Sweden 2nd).
- Biggest year on year increases to average download speeds in the new top 50, are mostly in smaller countries or principalities.
- Luxembourg, (population of approx. 600,000) moved up 25 positions to 8th. (Average download speed of 35.14Mbps. Speeds increased by 19.62Mbps year on year there).
- In Romania, average download speeds increased by more than 17Mbps YOY (5th overall ranking. Average download speed of 38.6Mbps).
- The principality of Andorra increased average download speeds by 15.07Mbps, year on year. (18th overall. Average speed of 27.14Mbps).
- Top 10 fastest average internet download speeds (M-Lab data), dominated by smaller countries both in geographical size and population. The most populous country of Japan, comes in at 14th position, with average download speeds of 28.94Mbps.
- USA drops to 20th according to M-Lab data, with an average download speed of 25.86Mbps.
- Between 2017 - 2018 average download speeds in the USA increased by 5.86Mbps. This from the largest sample size of speed tests of any country in the top 50, (more than 89 million tests).
- In Q1 of 2017, Akamai reported average internet speeds of 18.7Mbps for the USA, or 10th overall worldwide.
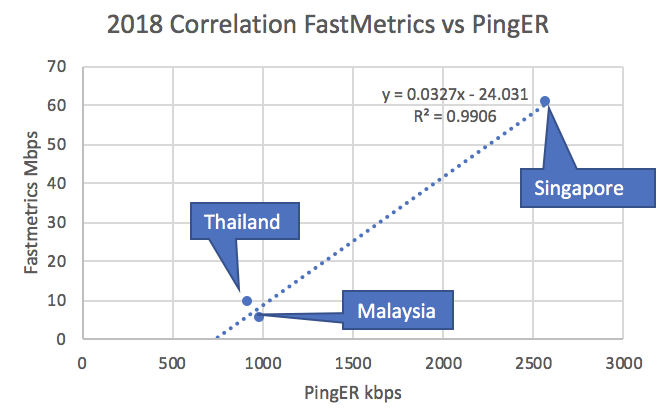
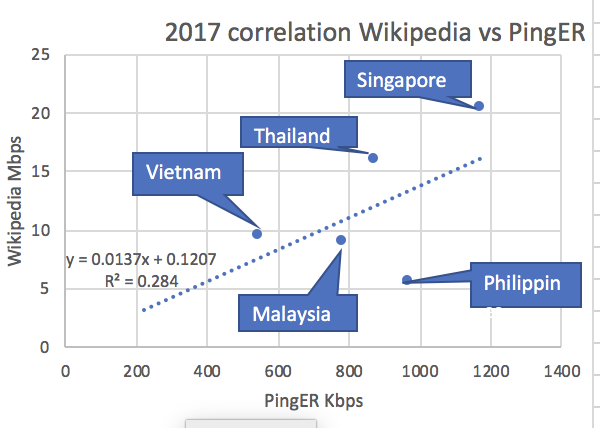
The following are some providers of measurements. They use different techniques, are made at different times so comparisons are questionable. If for example, we choose to compare the results for S. E. Asian countries we get
| Nation | Wikipedia (2017/Q1) Mbps | Atlas and Boots (2018) Mbps | Speedtest (7/2019) Mbps | Global Economy (2016) Mbps | Testmy.net upload (2019) Mbps | PingER (2019 Jan-Sep) Mbps |
|---|---|---|---|---|---|---|
| Brunei | 4.78 (8) | 20.97 (6) | 3.7 (9) | 0.681(8) | ||
| Cambodia | 4.03 (9) | 18.51 (9) | 0.0061 (6) | 6.7 (8) | 0.918 (6) | |
| Indonesia | 6.65 (5) | 19.09 (8) | 0.0062 (5) | 7.4 (6) | 0.910 (7) | |
| Laos | 2.92 (10) | 19.27 (7) | 0.0028 (7) | 0.277(10) | ||
| Malaysia | 8.9 (4) | 23.86 (2) | 71.52 (3) | 0.0271 (4) | 13.5 (4) | 1.429 (2) |
| Myanmar | 4.87 (7) | 16.84 (10) | 0.0028 (7) | 6.9 (7) | 0.981 (5) | |
| Philippines | 5.5 (5) | 6.05 (6) | 23.6 (5) | 0.0277 (3) | 8.1 (5) | 1.131 (4) |
| Singapore | 20.3 (1) | 70.36 (1) | 197 (1) | 0.617 (1) | 17.2 (3) | 1.793 (1) |
| Thailand | 16 (2) | 18.21 (3) | 78.47 (2) | 0.0548 (2) | 19.9 (1) | 1.175 (3) |
| Vietnam | 9.5 (3) | 7.02 (4) | 38.63 (4) | 0.0208 (9) | 17.5 (2) | 0.681 (8) |
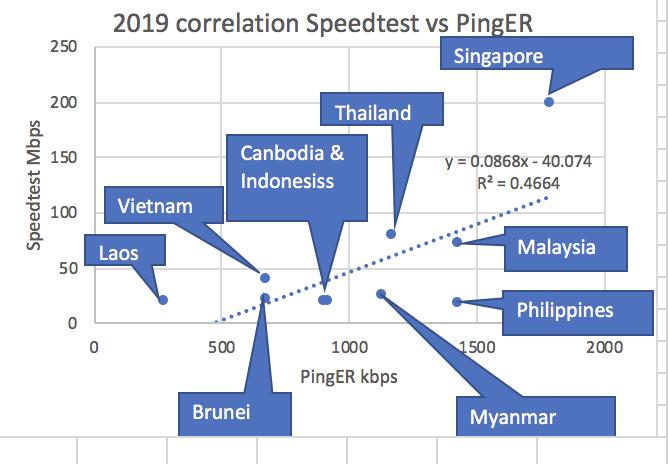
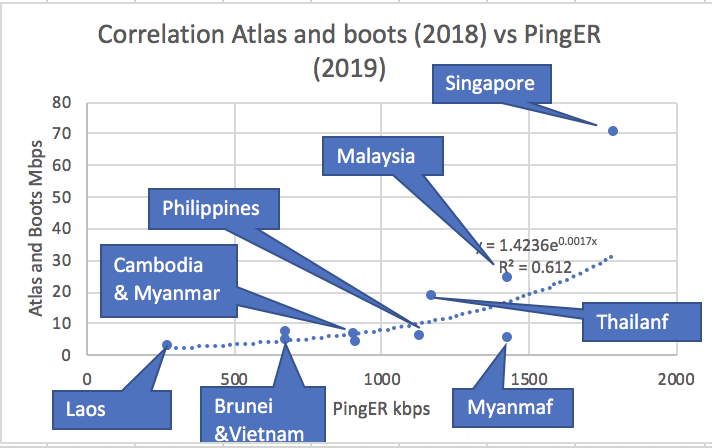
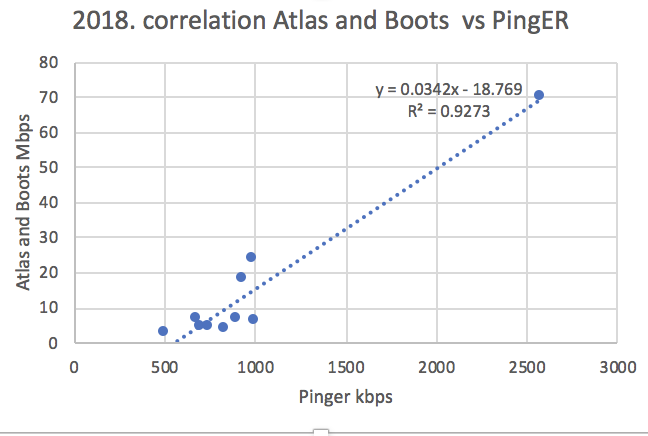
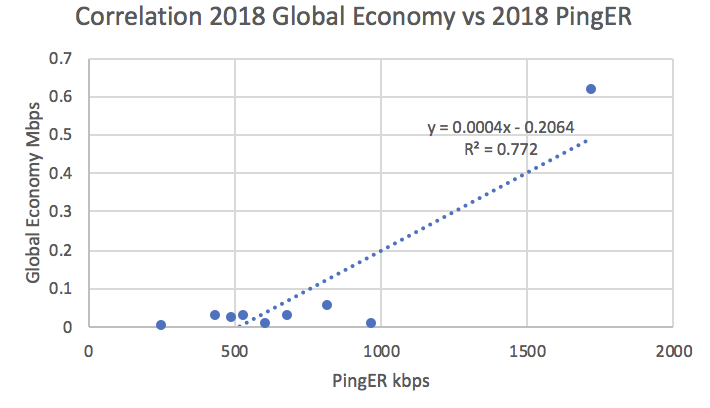
While the absolute values differ by orders of magnitude, the relative positions (in parentheses) are more stable. We can get a quantitative measure of the correlation between the various measurements and PingER by plotting each value against the PIngER value and calculating the R2 which is a measure of how much of the variance in y is explained by the model x (or in our case PingER). We do this for the measurements that have >=6 data points (ASEAN nations) to compare.
| Measurement by | R2 |
|---|---|
Atlas and Boots | 0.61 |
| Speedtest | 0.47 |
| Global Economy | 0.77 |
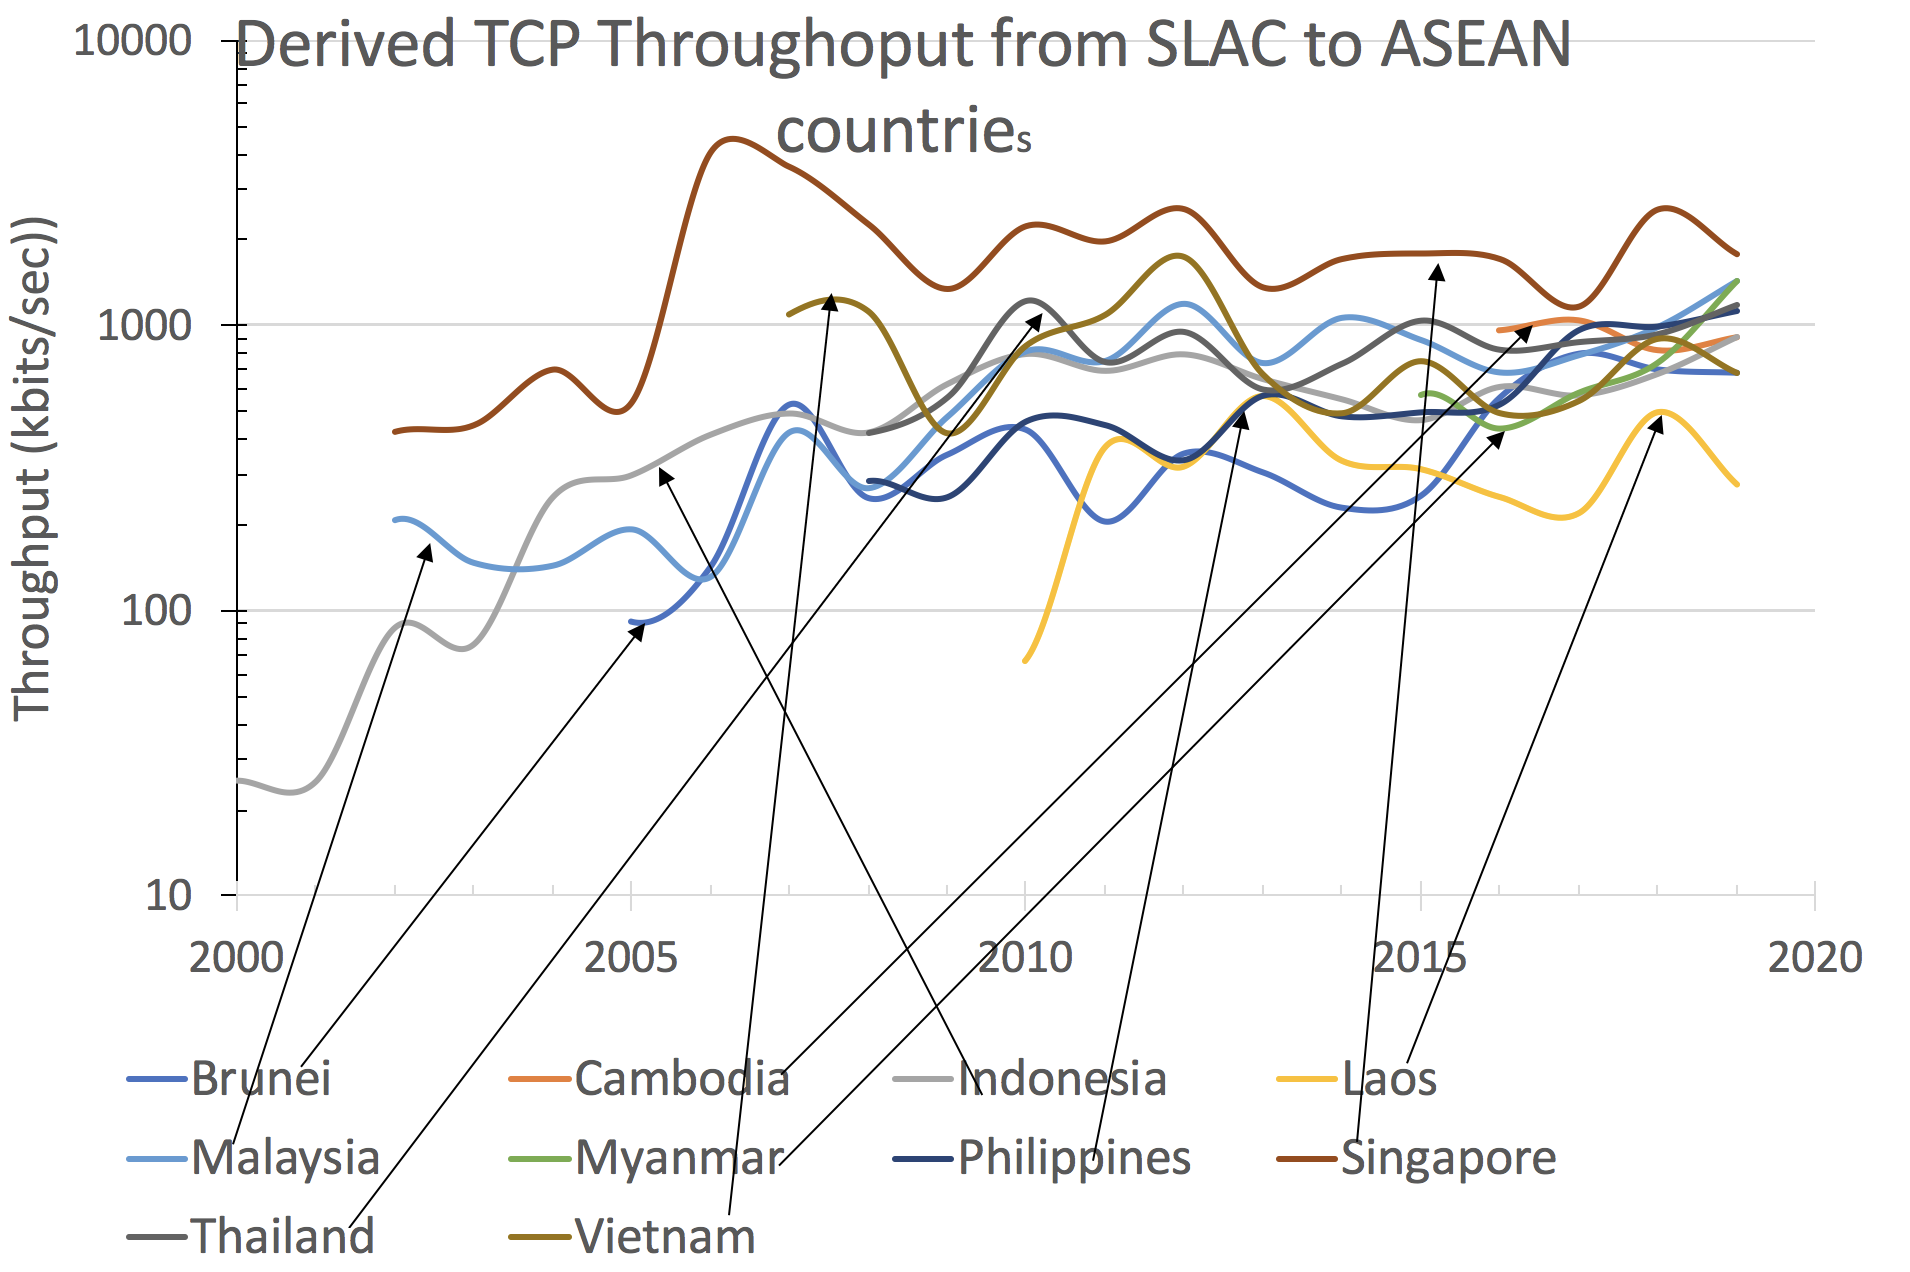
The yearly time series of the PingER measured derived throughputs is shown below:
Speedtest
https://www.speedtest.net/global-index. See above for the R2 comparisons.
July 2019
Provides both mobile and fixed line measurements. Based on measurements made to subscribers.
Test your Internet connection bandwidth to locations around the world with this interactive broadband speed test from Ookla.
FastMetrics
https://www.fastmetrics.com/internet-connection-speed-by-country.php#top-10-comparison-2018
Top 50 average download speeds June 2017 - May 2018. There are only 3 ASEAN nations in FastMetrics so it is not used in the R2 comparisons.
Wikipedia
Latest data 2017 Q1.
https://en.wikipedia.org/wiki/List_of_countries_by_Internet_connection_speeds. There is insufficient data (number 5 is < cutoff 6) of ASEAN countries) in Wikipedia so it is not used in the R2 comparison.
Atlas and Boots
https://www.atlasandboots.com/remote-jobs/countries-with-the-fastest-internet-in-the-world/. Has data derived from https://www.cable.co.uk/broadband/speed/worldwide-speed-league/. This has data from 2017-2019. See https://s3-eu-west-1.amazonaws.com/assets.cable.co.uk/broadband-speedtest/worldwide-broadband-speed-league-2019-method.pdf for the methodology of the measurements. See above for the R2 comparisons.
Countries with fastest Internet in 2018
Monitor-io
See https://www.monitor-io.com/monitor-io-vs-speed-tests.html. Costs money. Unable to find any results ordered by country. Not reported above.
SpeedCheck
https://www.checkmyspeednow.com/ makes measurements to subscribers. Unable to find any results reported by country. Not reported above.
Think Broadband
https://www.thinkbroadband.com/broadband/monitoring/quality. Can't find data of throughput by country. Not reported above.
The line monitoring system allows you to track the performance of your broadband connection in terms of latency and packet loss. Latency is the time it takes for a piece of information (a 'packet') to get from our servers to your broadband connection, and back. Packet loss is where some bits of information are lost whilst in transit, so it has to be re-sent. These can cause problems with various 'realtime' applications such as online gaming, video conferencing, internet telephony, etc.
The Global Economy
https://www.theglobaleconomy/com/rankings/Internet_bandwidth/. See above for the R2 comparisons.
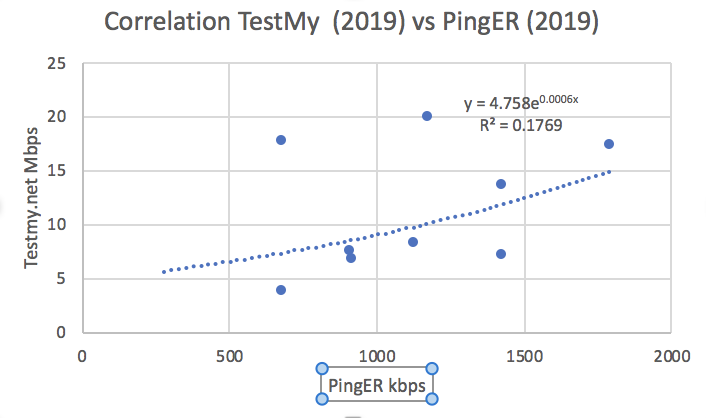
Testmy.net
Based on measurements made to subscribers. Provides upload and download. We use the upload. The results are strange in that all the other measurements, Singapore is ranked behind Thailand and Vietnam. Thus we not use this data in the comparisons.
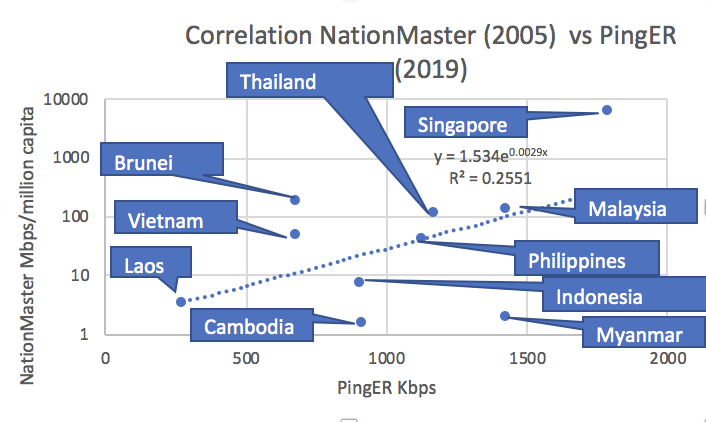
NationMaster
Their most recent data is for 2005 for which PingER has data for only 4 ASEAN nations (Brunei, Indonesia, Malaysia and Singapore). Thus we do not use this data for comparisons.
PerfSONAR
See PingER and perfSONAR comparison.