Content
Minutes of meetings
1. list of detector types/data sources for support
   - hex-anode
   - quad-anode
   connected to
   - acqiris
   - TDC
2. sample(s) of data (experiment/run) which can be used for test/calibration purpose.
   hex-anode : exp=xpptut15:run=280
   quad-anode : ??? (Razib)
3. format of software (library of methods, a set of scripts, GUI wrapper, packaging, etc.)
  - detector-manufacturers software represents everythin as GUI
   - libraray of methods/ scripts/ GUI make sence
4. list of monitoring/calibration plots, types and format of constants for calibration purpose
   - Razib will make screen-shots of all interesting plots
   - calibration should provide for each delay line (t0, k)
5. algorithms for implementation
   - peak-finding in waveform
   - plots stc.
6. list of analysis plots and output data formats
   - Razib will make screen-shots of all interesting plots
Data
Timur suggested to use data
- HEX anode detector: amod3814, runs 85, 88, 90, etc. any decently sized file
- QUAD anode: amon2216, runs 299, 301 … 305, 313, 315
channel assignment was Acqiris-1: 1-X1, 2-X2, 3-Y1, 4-Y2 (it could also be 1-X1, 2-Y1, 3-X2, 4-Y2) and Acqiris-3 - TOF.
Firmware library
Here is the person who should be contacted about getting the statically / dynamically linked library binaries for hit reconstruction and detector calibration:
2016-12-07-email-achim-czasch.txt
Achim Czasch <czasch@atom.uni-frankfurt.de>
Wed 12/7/2016 5:57 AM
To:
Dubrovin, Mikhail;
Cc:
Osipov, Timur;
Action Items
Dear Mikhail and Timur,
I have compiled the lib on CentOS 7 (which is basically RedHat???) on gcc version
Here are 2 example programs that show how to use the lib:
a)
This program can read the LMF-data files that our software "CoboldPC"
produces. Timur Osipov may have some sample files from his beam times.
http://www.roentdek.com/download/LCLS_Linux/sort_LMF_1_detector.zip
b)
This is basically the same. But it does not read LMFs. It expects
a simple binary file format. So you will start with this one because you
have your own ADC data.
http://www.roentdek.com/download/LCLS_Linux/sort_non-LMF_from_1_detector.zip
Roadmap:
- measure the detector signals with your ADCs
- write a program that extracts the timing info from the signals.
Simple method:
look for the 2 samples which are just above and just below A.
A is the half amplitude of this signal.
The interpolate between the 2 points to find the timing value @ half ampl..
Advantage: Very robust. Works always.
better method:
Mimic the CFD-mechanism.
Superimpose the signal with an inverted and delayed copy of itself.
Look for the point where this new signal crosses zero.
Advantage: better resolution (about factor sqrt(2)).
But the simple method is already very precise.
- Now you have the timing values of all 7 detector signals.
Now you can use my example programs.
Some histograms that you will need:
Let's call the signals u1,u2,v1,v2,w1,w2 and mcp.
(values in nanoseconds)
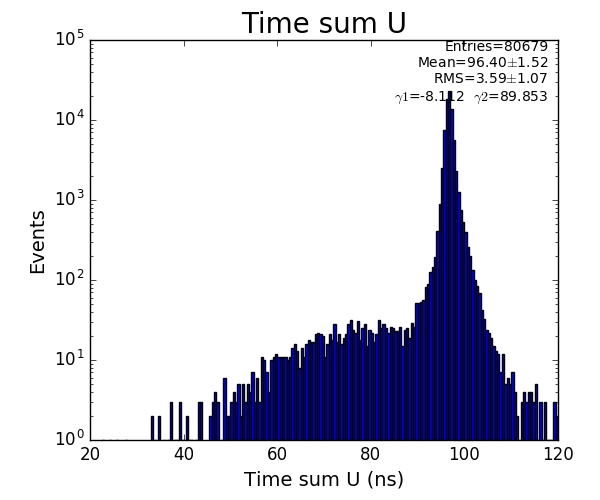
- 1D: u1+u2-2*mcp
- 1D: v1+v2-2*mcp
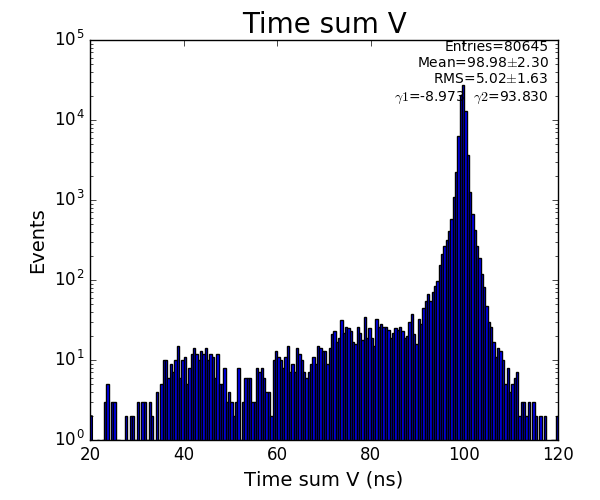
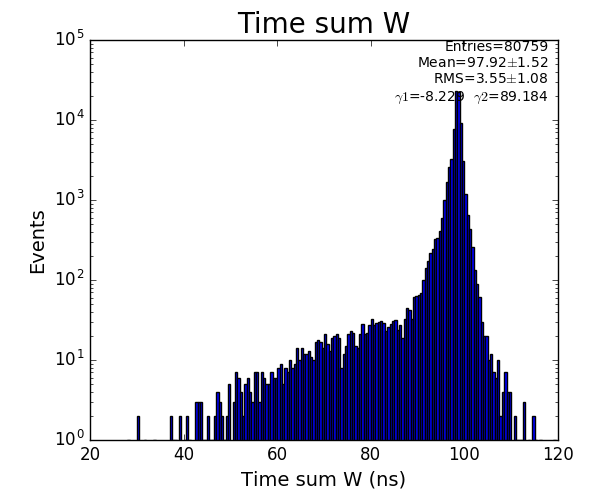
- 1D: w1+w2-2*mcp
- 1D: u1-u2
- 1D: v1-v2
- 1D: w1-w2
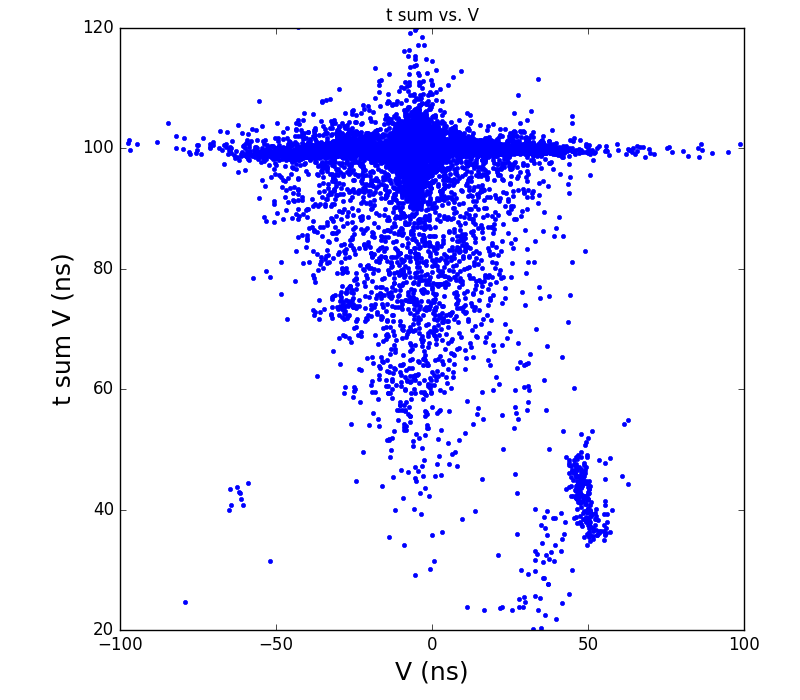
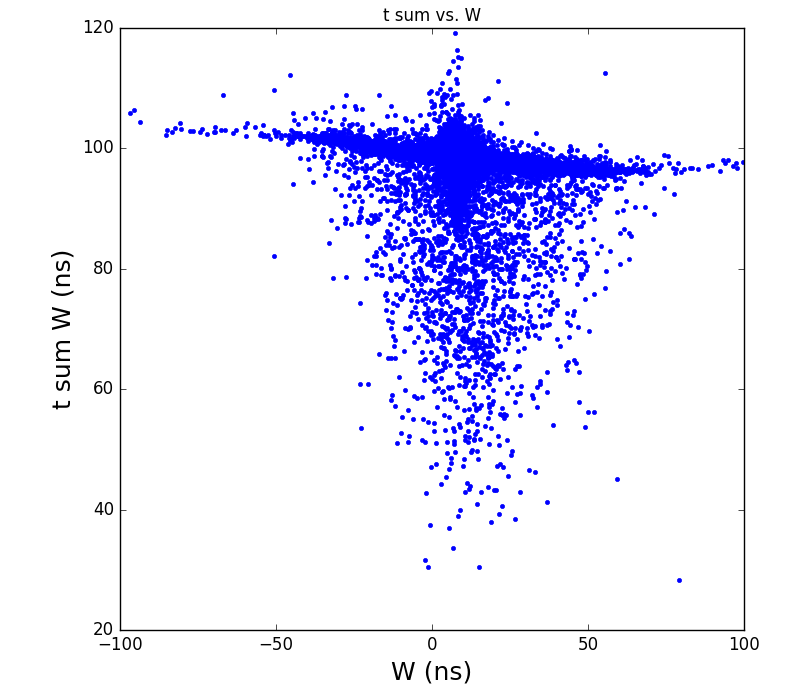
- 2D u1+u2-2*mcp versus u1-u2
- 2D v1+v2-2*mcp versus v1-v2
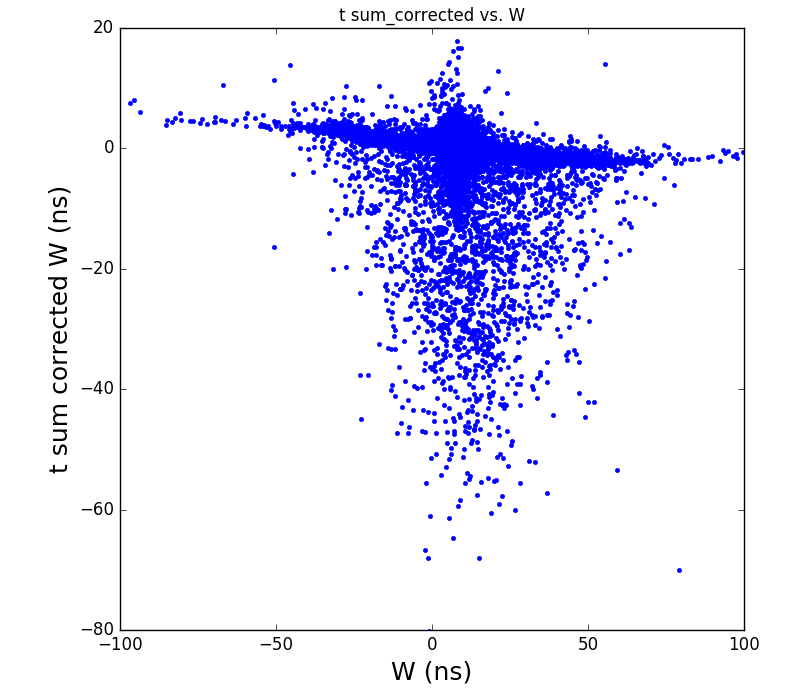
- 2D w1+w2-2*mcp versus w1-w2
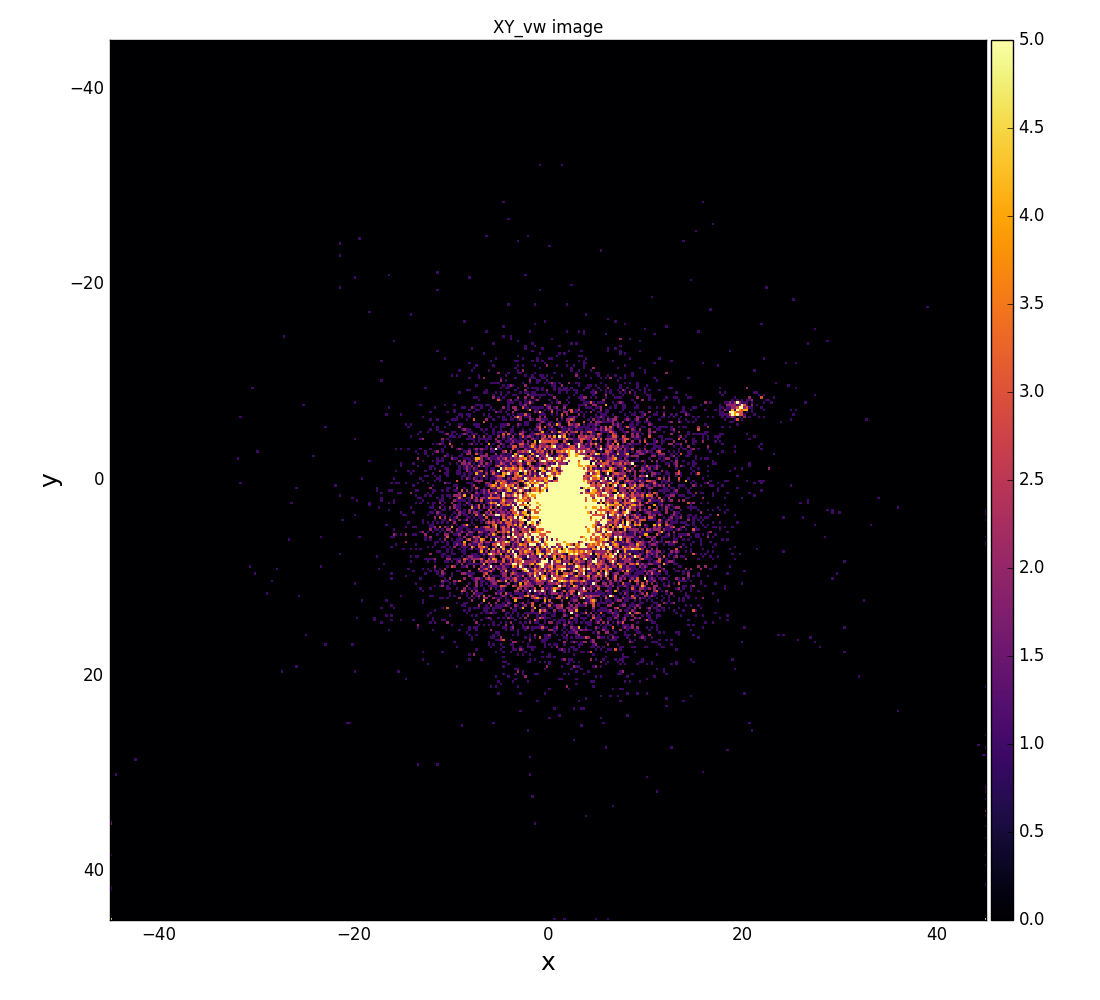
3 position images:
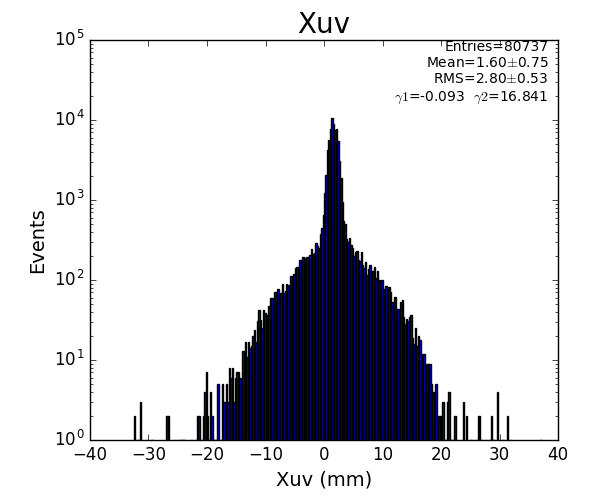
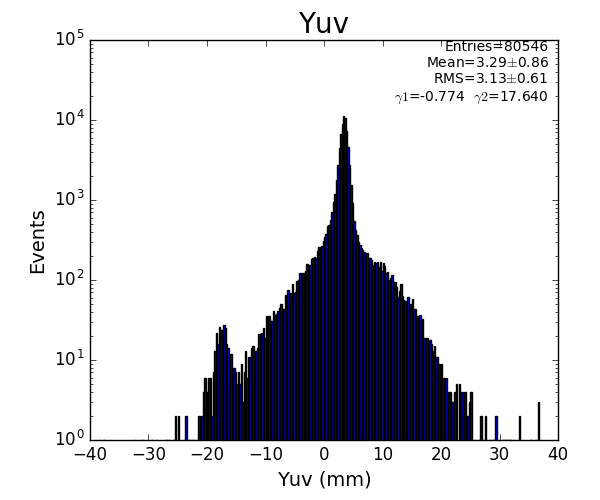
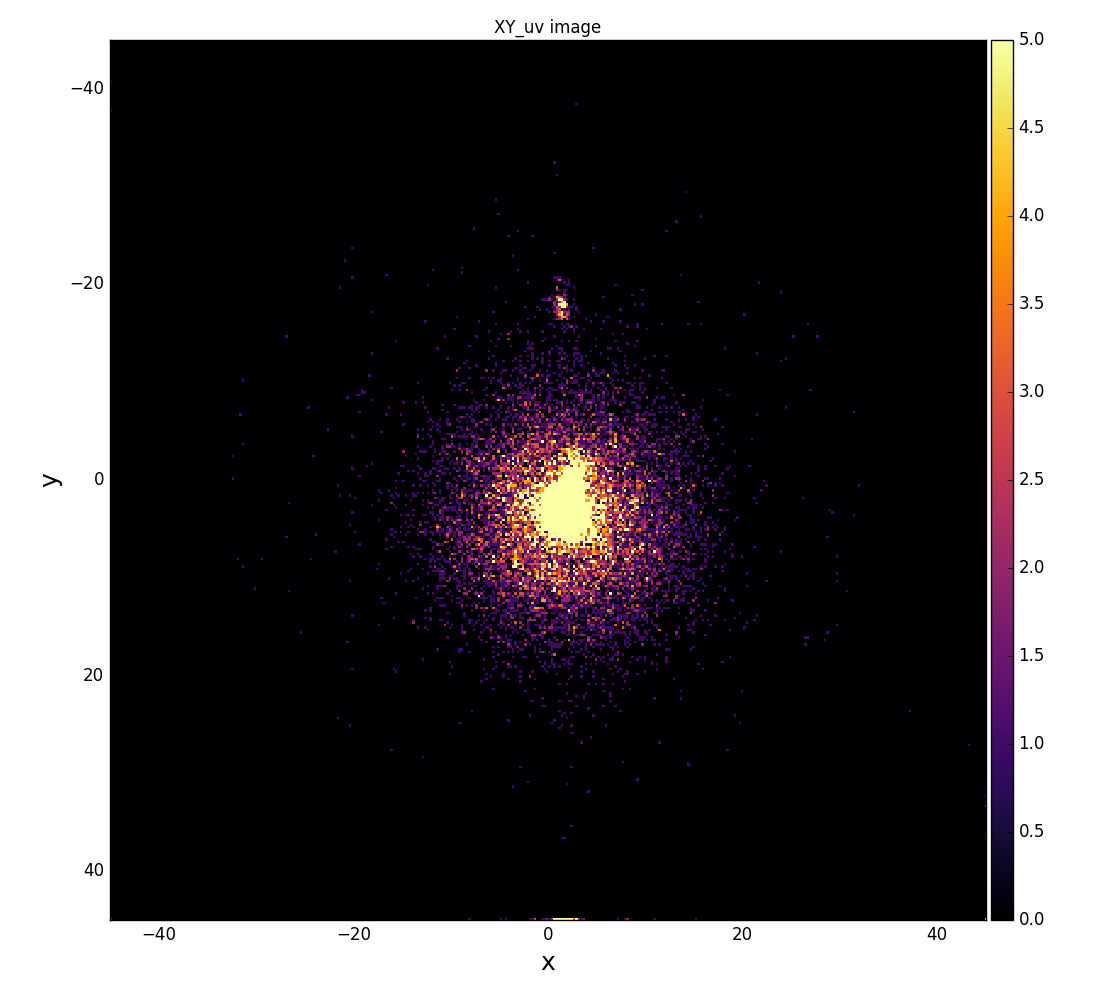
Xuv versus Yuv
Xuw versus Yuw
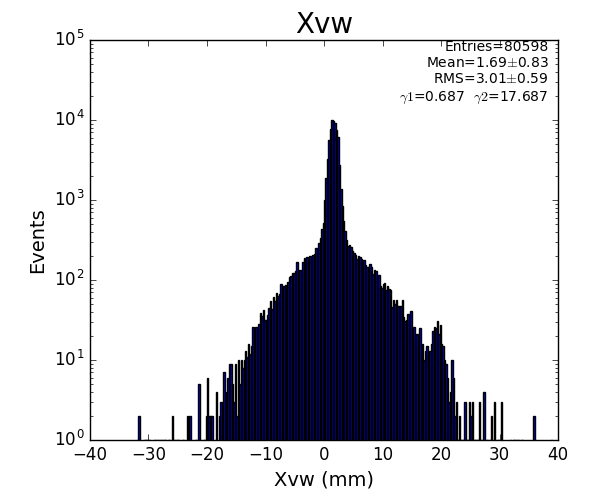
Xvw versus Yvw
with
u= u1-u2
v= v1-v2
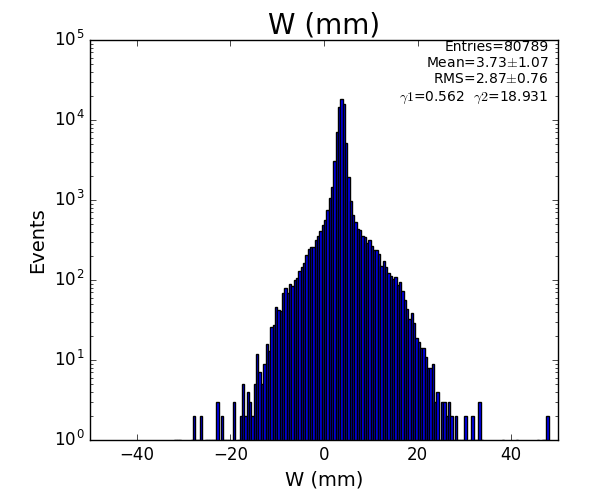
w= w1-w2 - w_offset
and
Xuv = u * fu;
Yuv = (u * fu - 2.*v * fv)*0.5773502691896;
Xuw = u * fu;
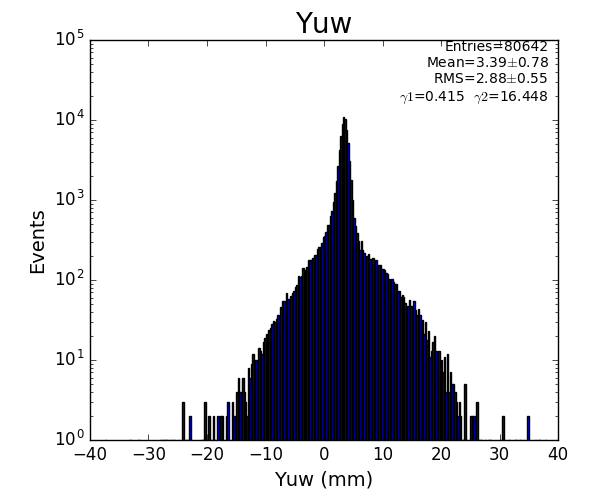
Yuw = (2.*w * fw - u * fu)*0.5773502691896;
Xvw = (v * fv + w * fw);
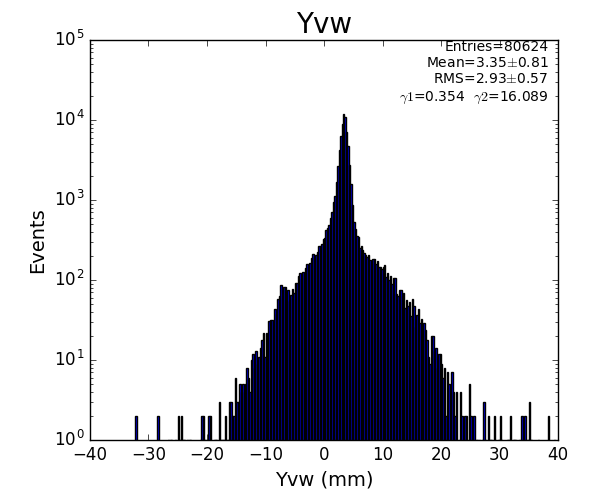
Yvw = (w * fw - v * fv)*0.5773502691896;
fu, fv, fw are constants close to 0.7.
w_offset is a constant close to zero.
The exact values for these constants will be extracted from
real data later during the calibration. (Timur can tell you more about this.)
And it is also good to plot this data for each signals:
FWHM versus amplitude
You can calculate the FWHM (full width at half maximum) similar
to the "simple method" that I have described further above.
Just do the some on the trailing edge of the signal.
We will have to exchange some more emails until everything is working.
best,
Achim
> Could you remind me please, what is a right order
> to adjust parameters and calibrate new detector?
yes, there is a sequence that must be followed in the correct order:
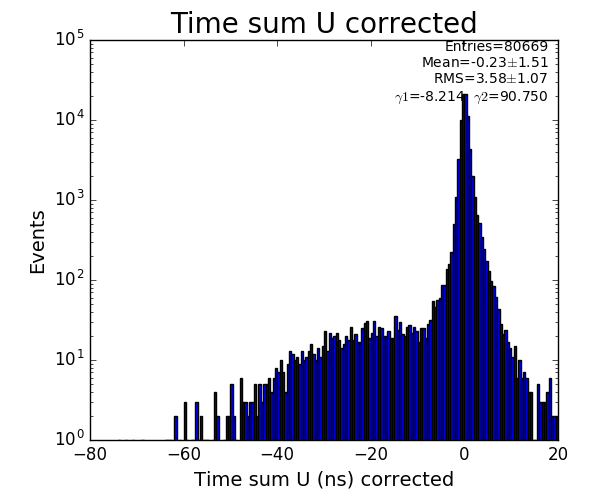
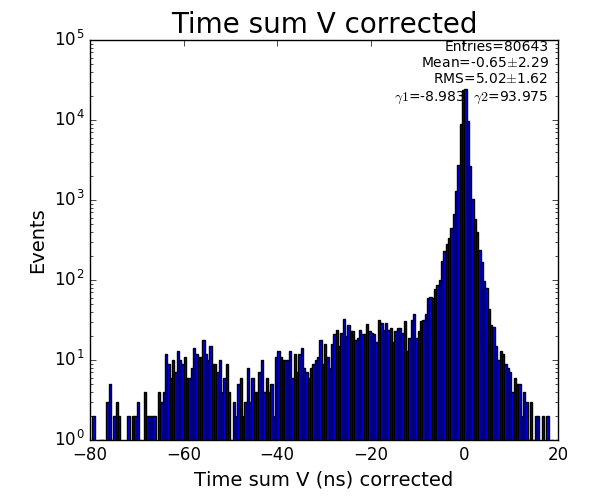
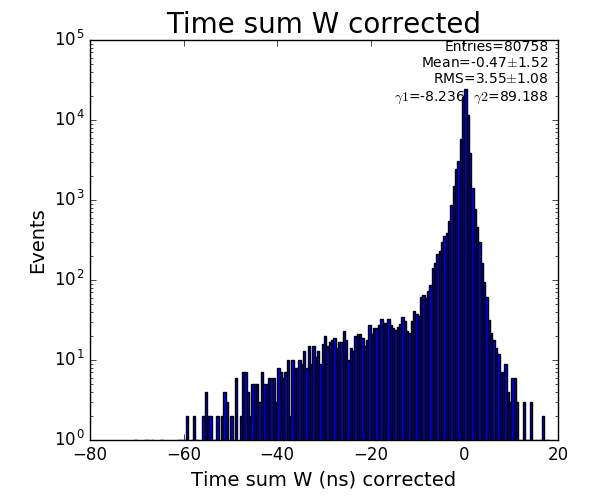
a) First you must set the parameters in the config file so that the time sum peaks get shifted to zero.
b) Then you set the 'runtime'.
c) Then you set the xy calibration factors so the that image gets the size that you think is right.
(and set the xy offset parameters so that the image is well centered.)
d) Then you set 'radius'. This value should be 1 or 2 mm larger so that it really includes all hits.
References to download software:
http://www.roentdek.com/download/LCLS_Linux/sort_LMF_1_detector.zip
http://www.roentdek.com/download/LCLS_Linux/sort_non-LMF_from_1_detector.zip
Reference from 2018-08-14:
http://www.roentdek.com/download/_USA/LCLS_Linux/sort_LMF_1_detector.zip
Software
Installation of 3-d party library
Static library file is installed under
~/lib/hexanode-lib
Also in
/reg/common/package/hexanodelib/0.0.1/x86_64-centos7-gcc485/resort64c.h
/reg/common/package/hexanodelib/0.0.1/x86_64-centos7-gcc485/libResort64c_x64.a
2019-08-14 David Schneider has moved this library in conda:
/reg/g/psdm/sw/conda/inst/miniconda2-prod-rhel7/envs/ana-1.4.7/lib/libResort64c_x64.a
Package hexanode
Lives in our release system and intended as a cpp/python tester/wrapper of the resort64c library
hexanode/pyext/hexanode_ext.pyx - cython/python extension module for resort64c library
hexanode/app/ - C test examples
hexanode/examples/ - for python examples
Package expmon
Lives in our release system and intended to support GUI interfaces for different hutch standard configuration projects.
expmon/examples - test of acqiris signals from hex- quad- anode detectors
Package graphqt
Lives in our release system and intended to support qt-based dynamic graphics.
Examples
Run scripts on psanaphi110.
Data file hexanode-example-CO_4.lmf supplied by Timur, contains 100K events.
ex_sort hexanode-example-CO_4.lmf # C++
hexanode/examples/ex-05-sort.py hexanode-example-CO_4.lmf # Python
Changing command (1,2,3) in sorter.txt I got
| command | C++ (sec) | Python (sec) |
|---|
| 1 (data processing) | 3.6 | 4.3 |
2 (calib) | 0.218 | 0.635 |
| 3 (calib) | 0.230 | 0.656 |
Example with graphics
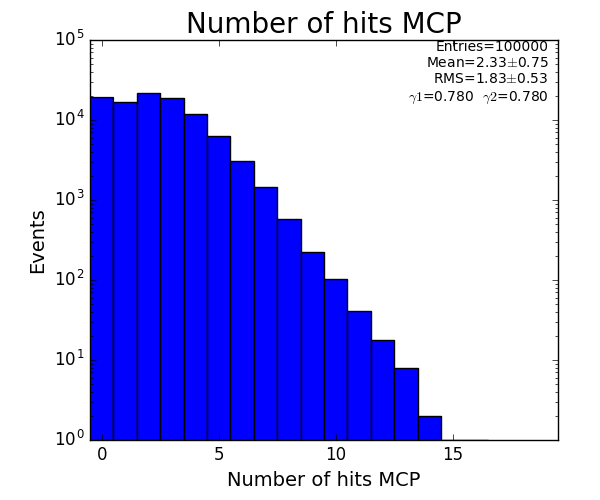
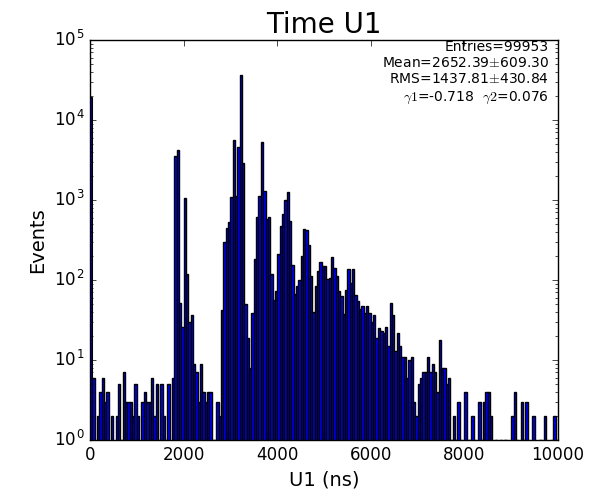
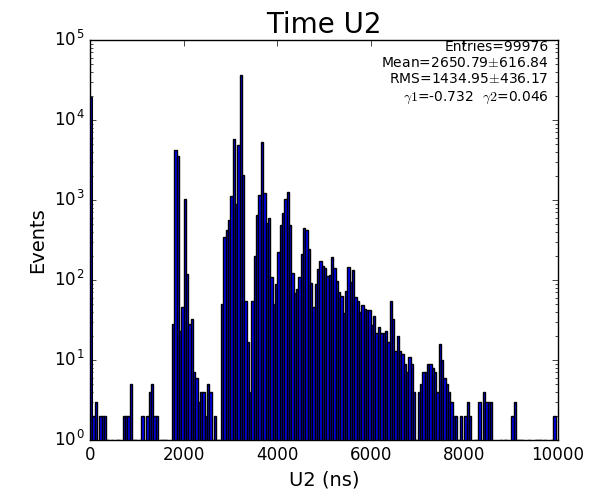
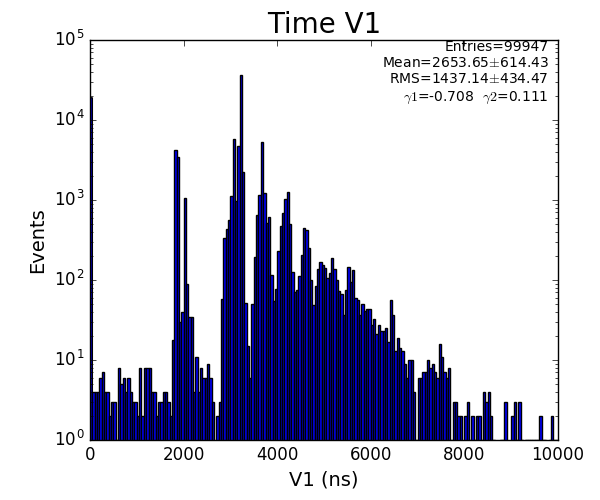
hexanode/examples/ex-06-sort-graph.py hexanode-example-CO_4.lmf
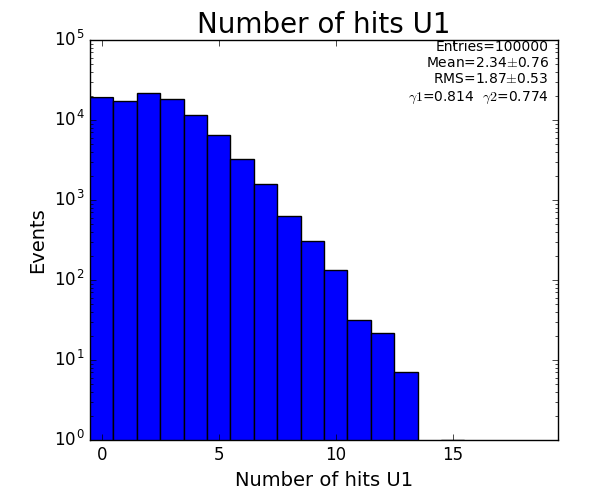
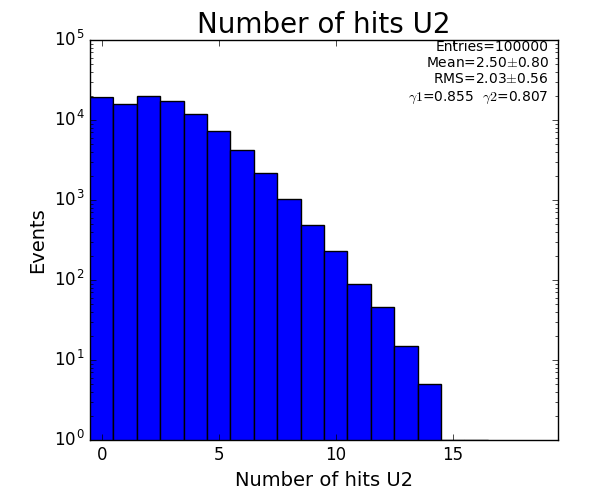
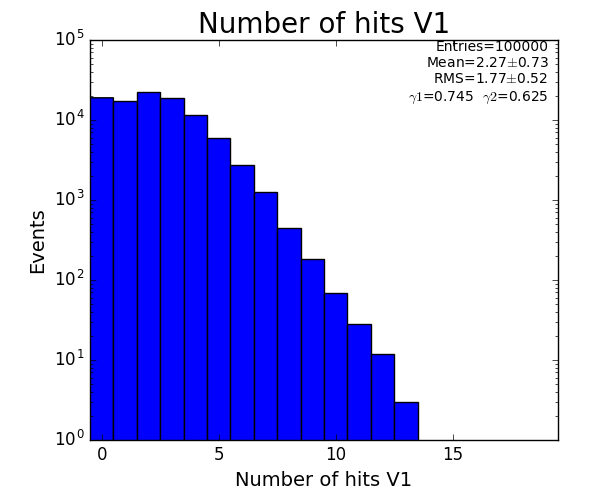
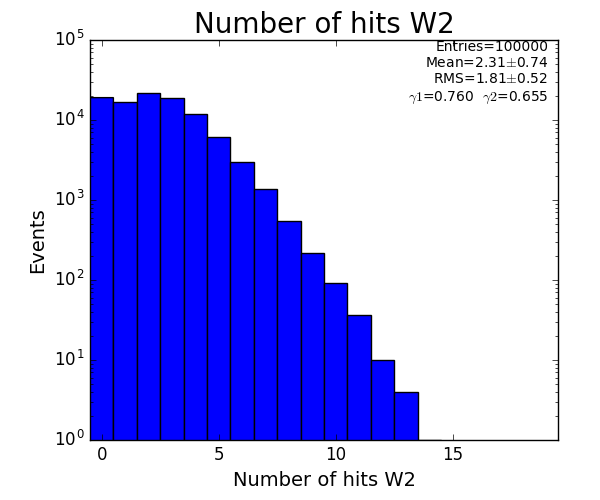
Number of hits per channel


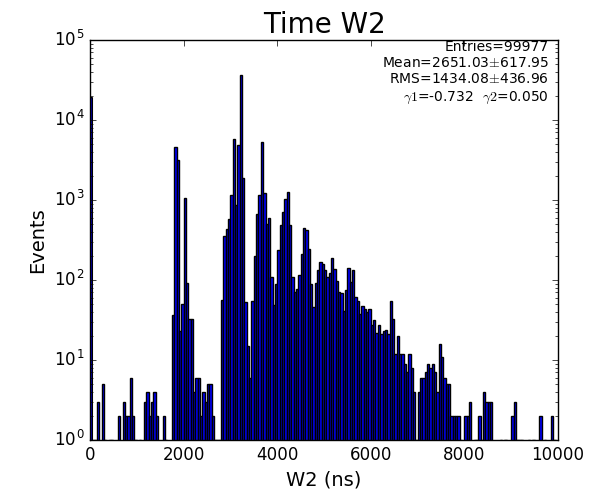
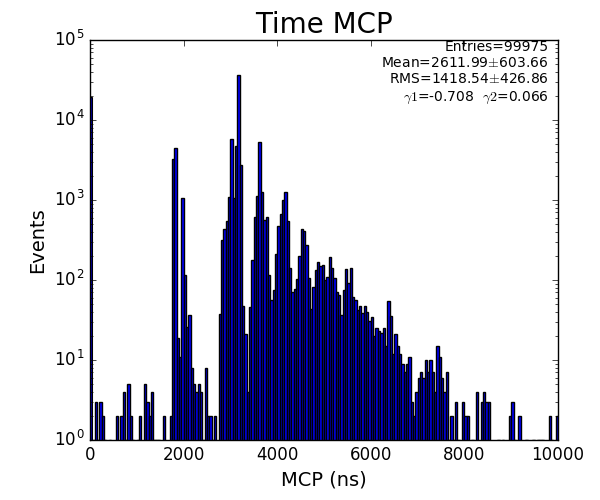
Spectra of time per channel
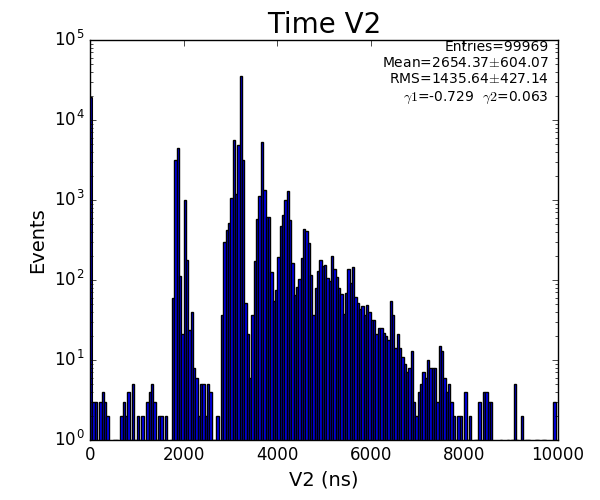

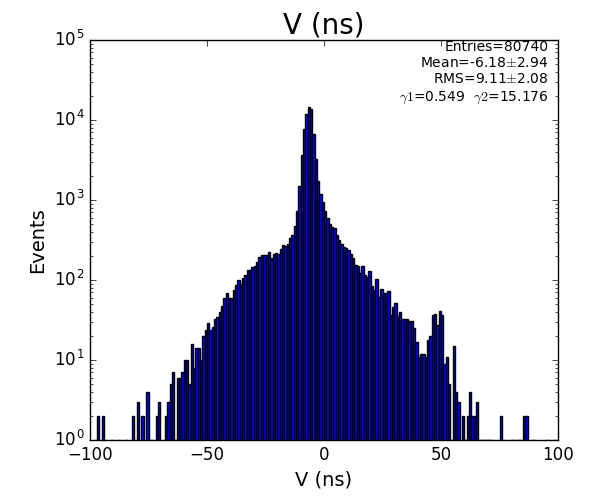
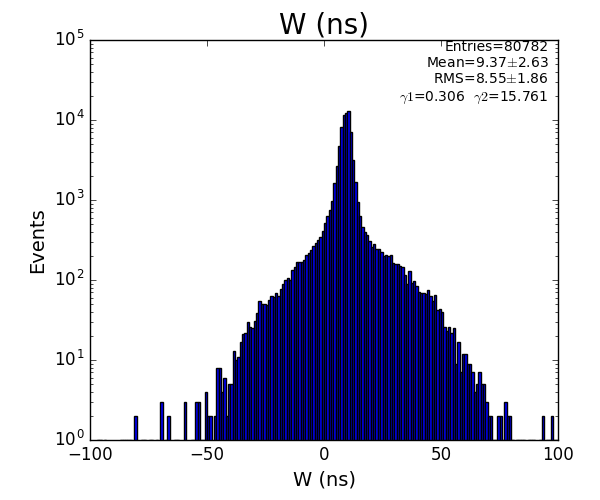
Spectra of U, V, W (ns)
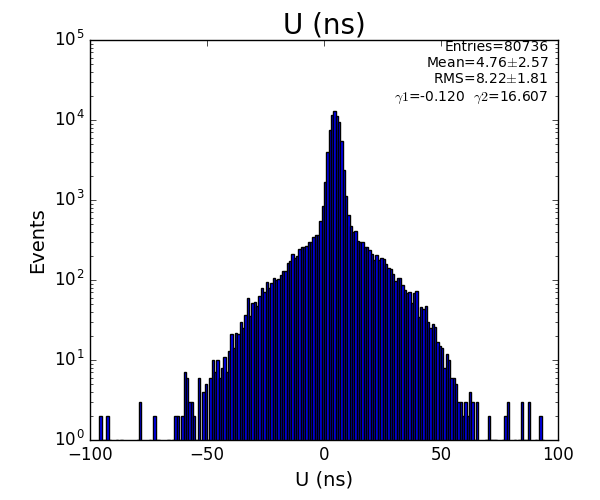
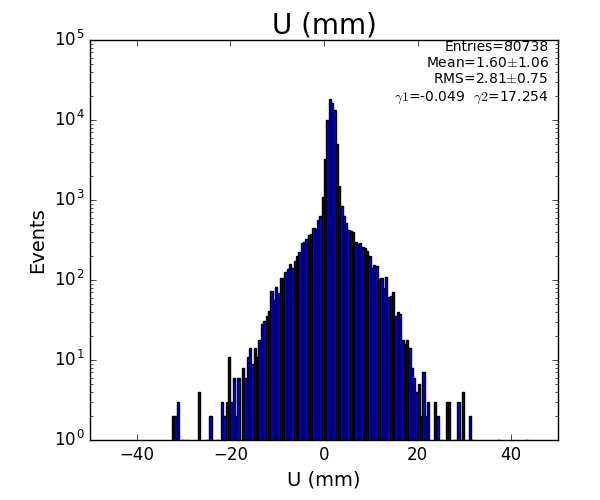
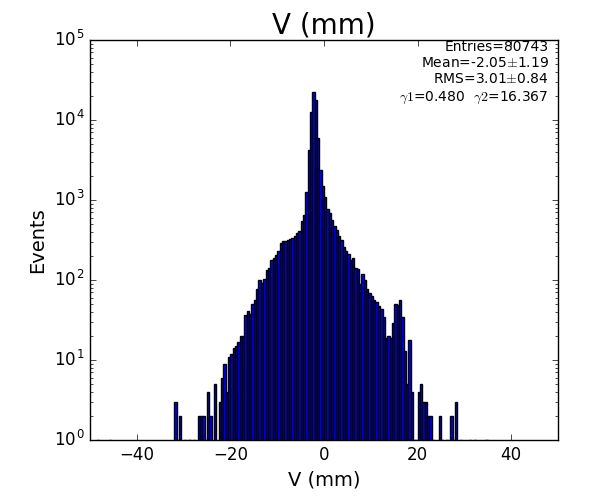
Spectra of U, V, W (mm)
Spectra of Xuv, Xuw, Xvw (mm)

Spectra of Yuv, Yuw, Yvw (mm)
Time sum (ns) for U, V, W
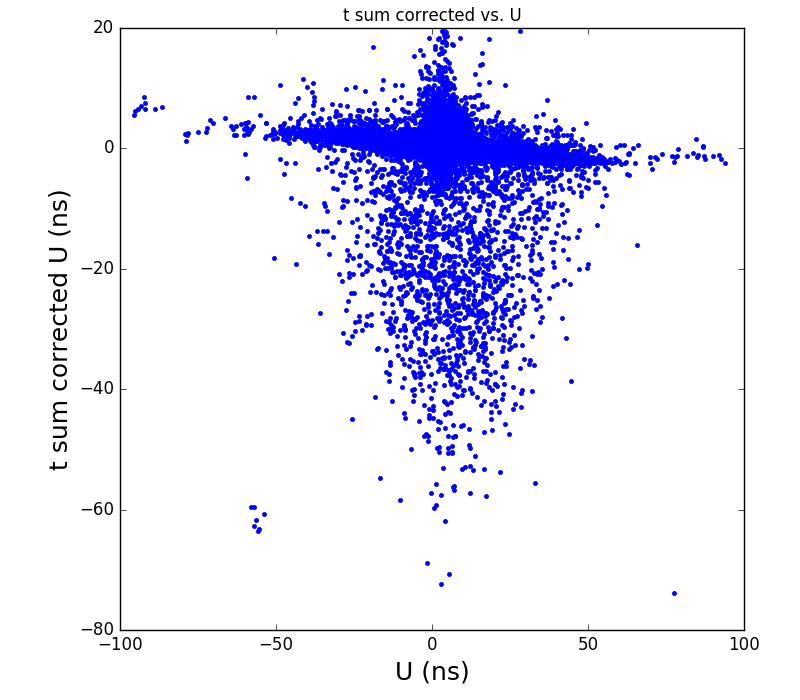
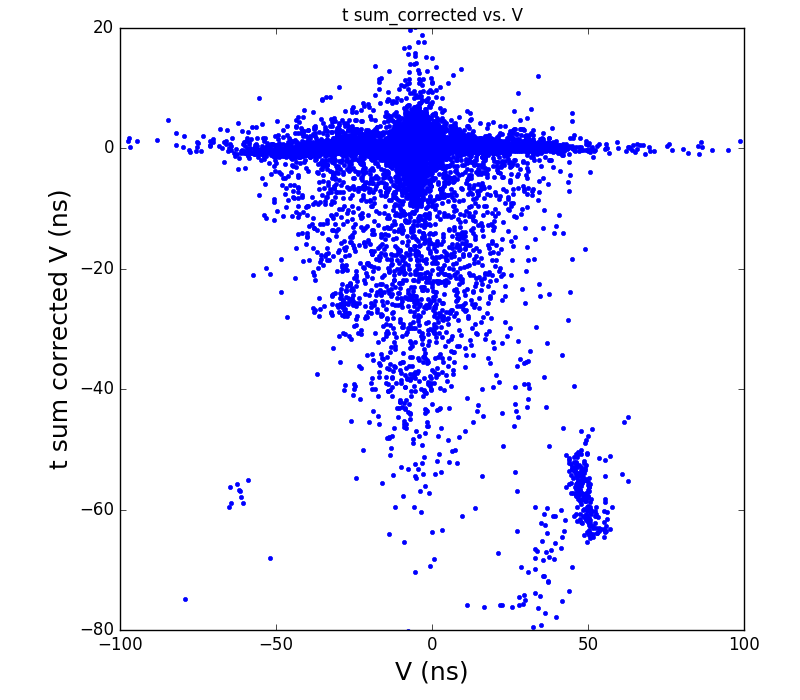
Time sum (ns) corrected for U, V, W
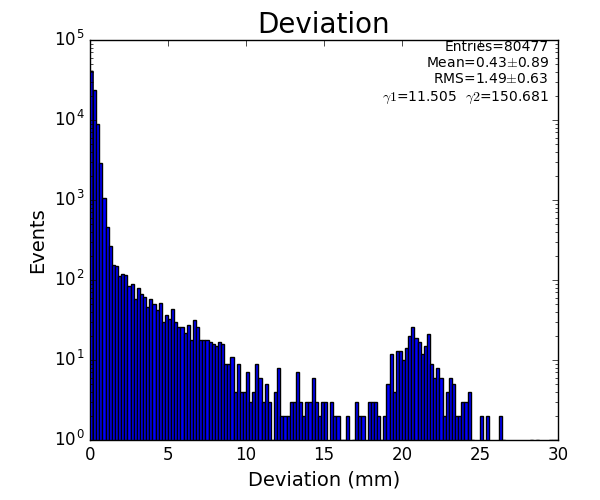
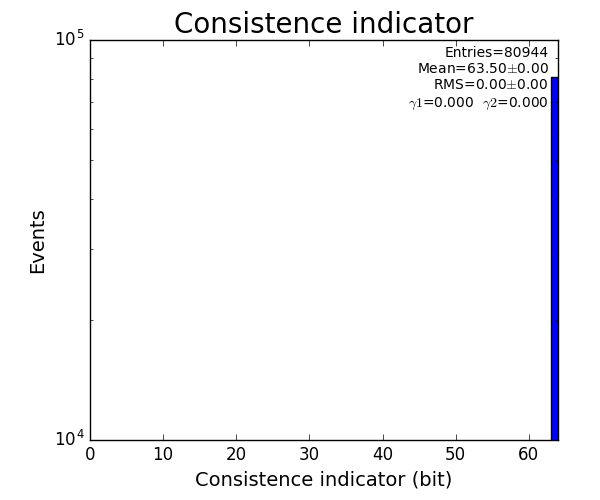
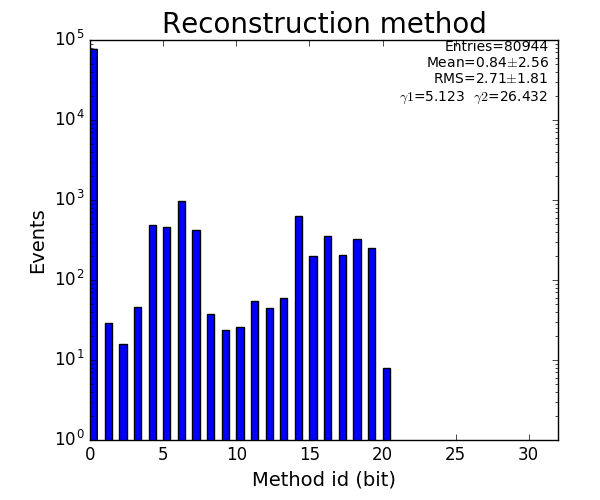
Deviation, Consistency Indicator, Reconstruction method
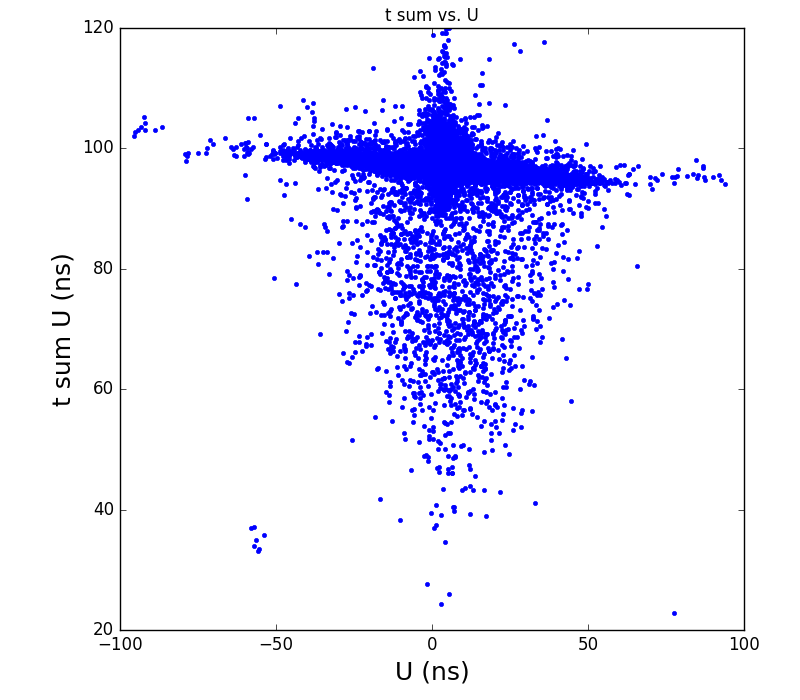
Time sum vs. variable U, V, W
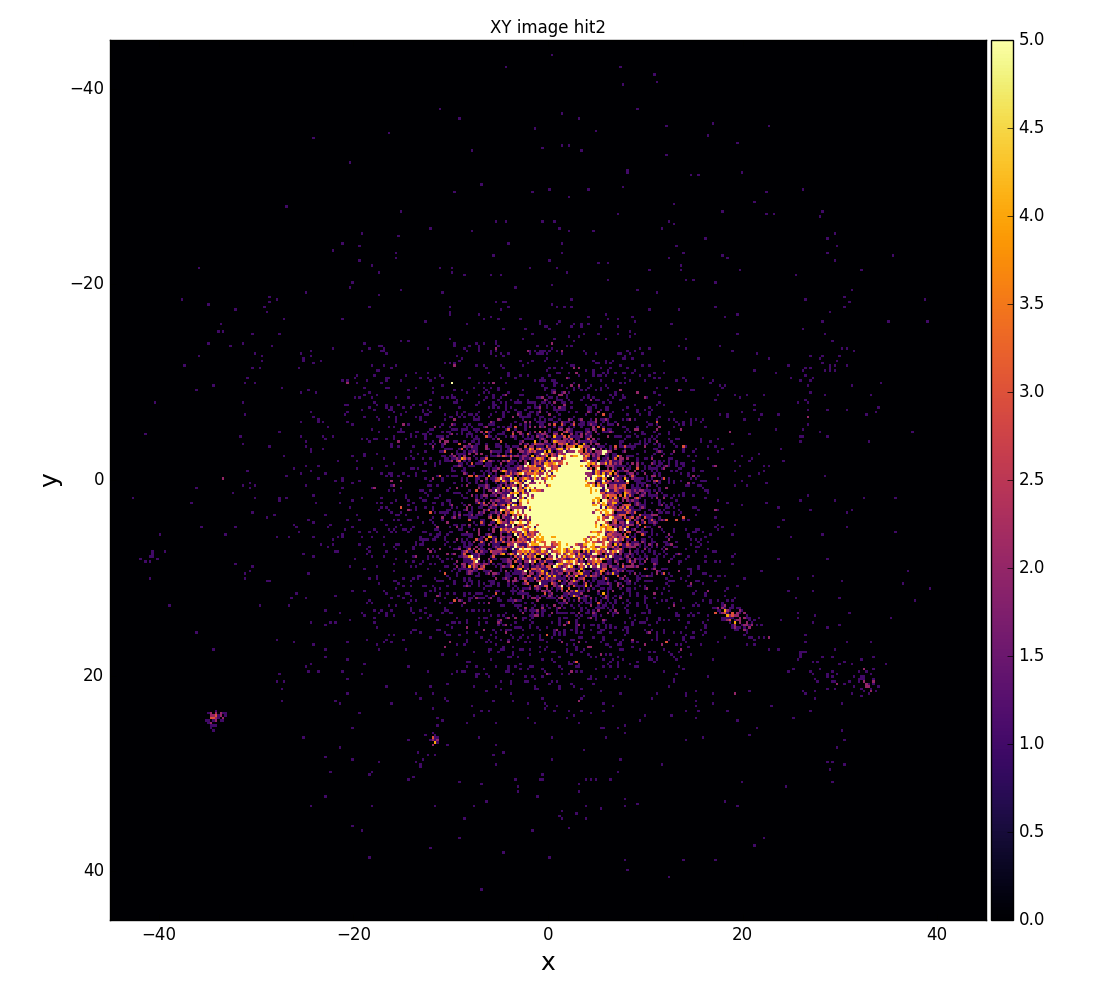
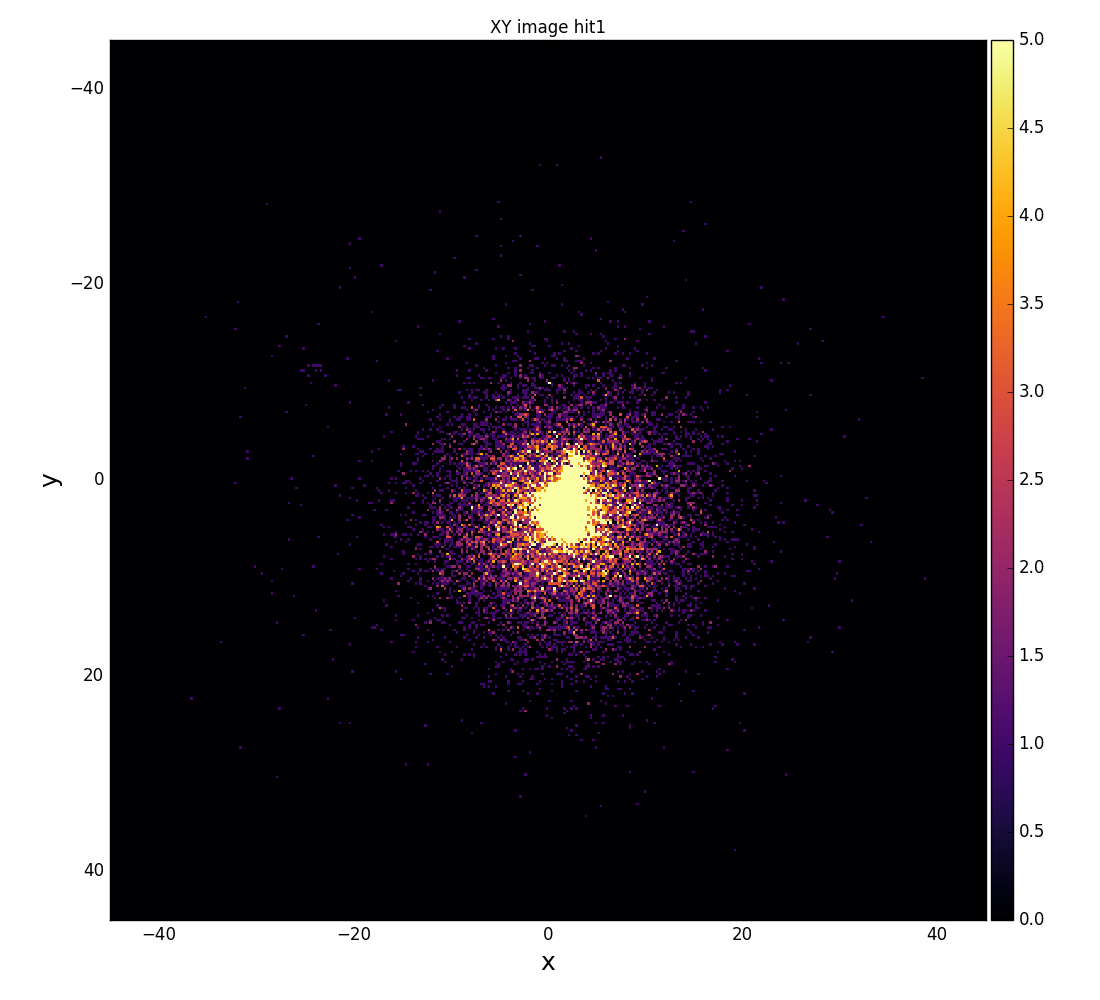
xy image for hit1 and 2
XY image for uv, uw, and vw components

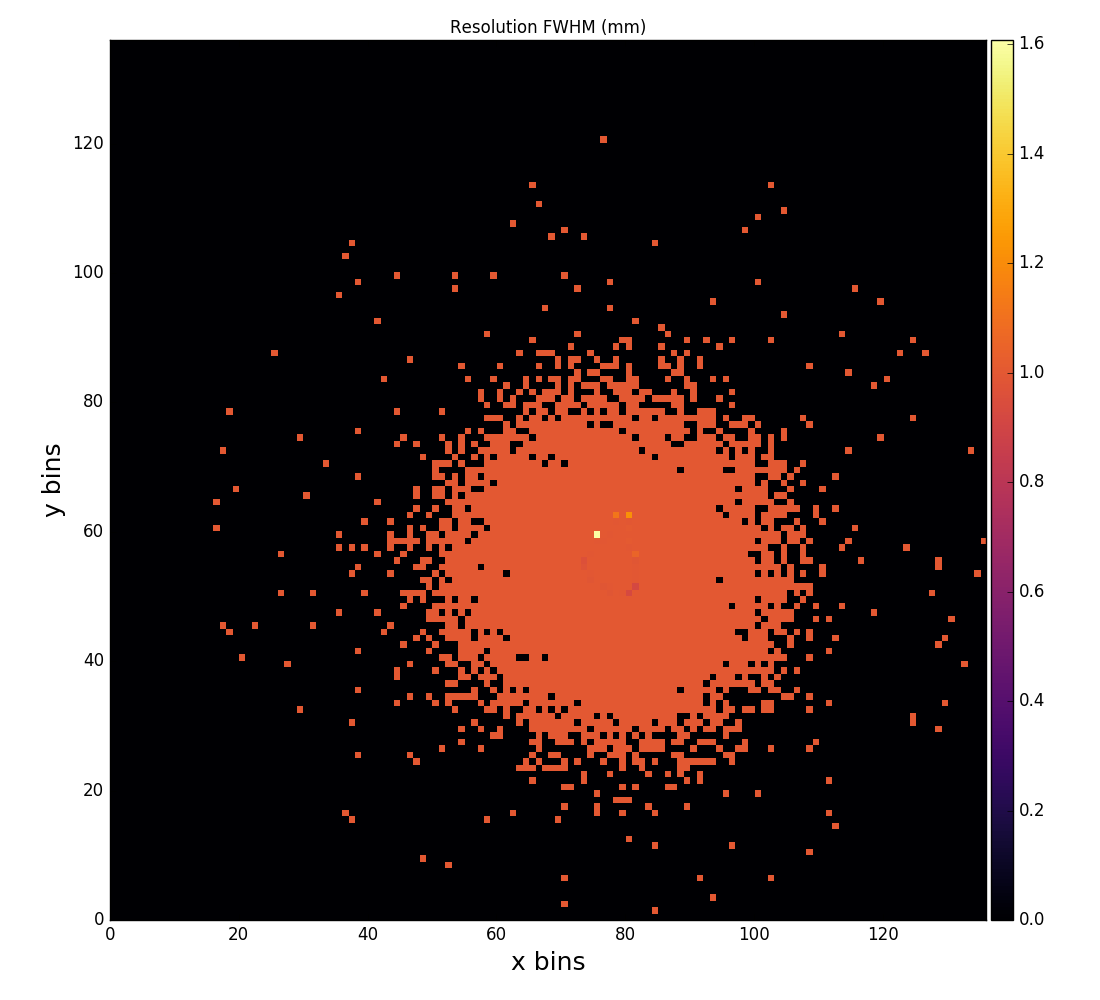
Resolution map
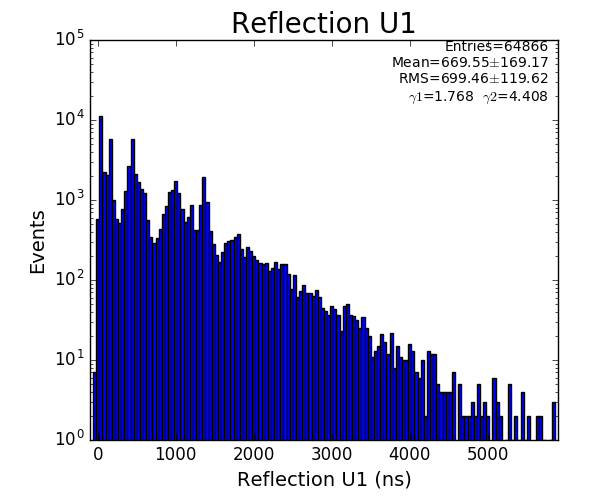
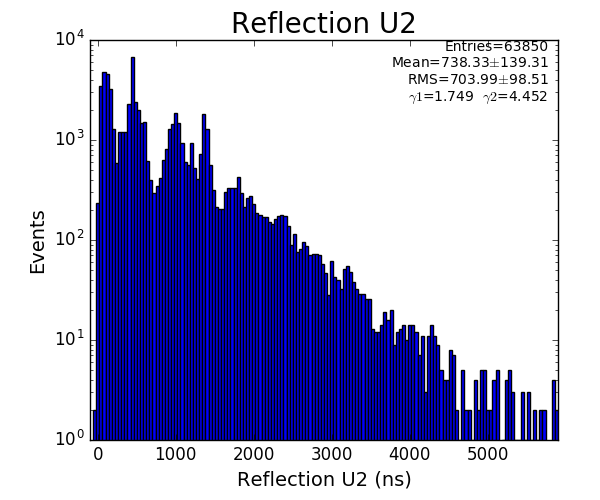
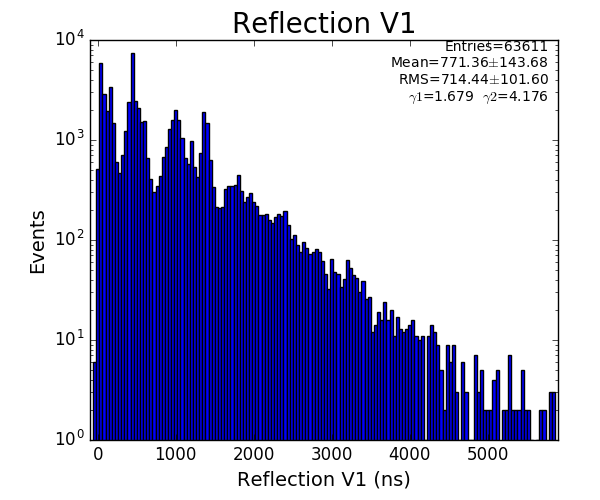
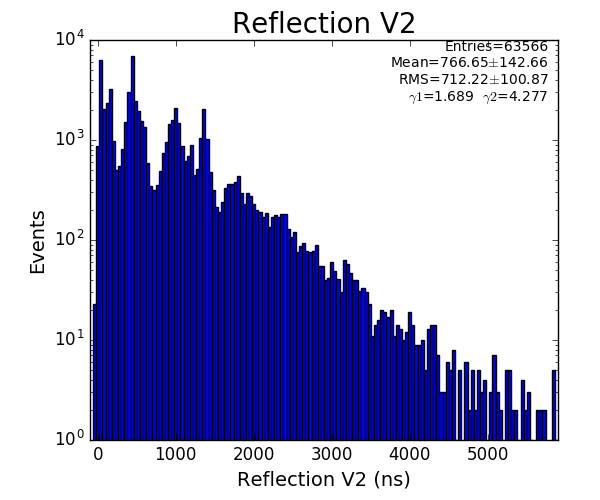
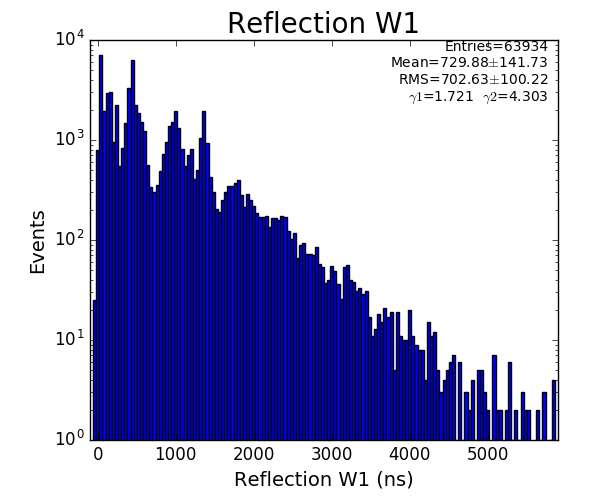
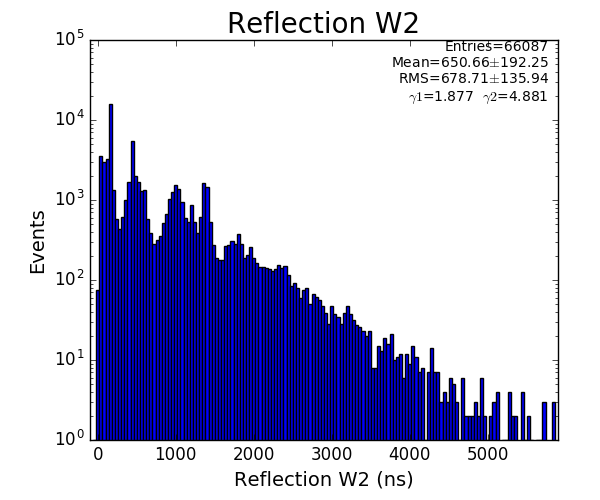
Reflection for all channels
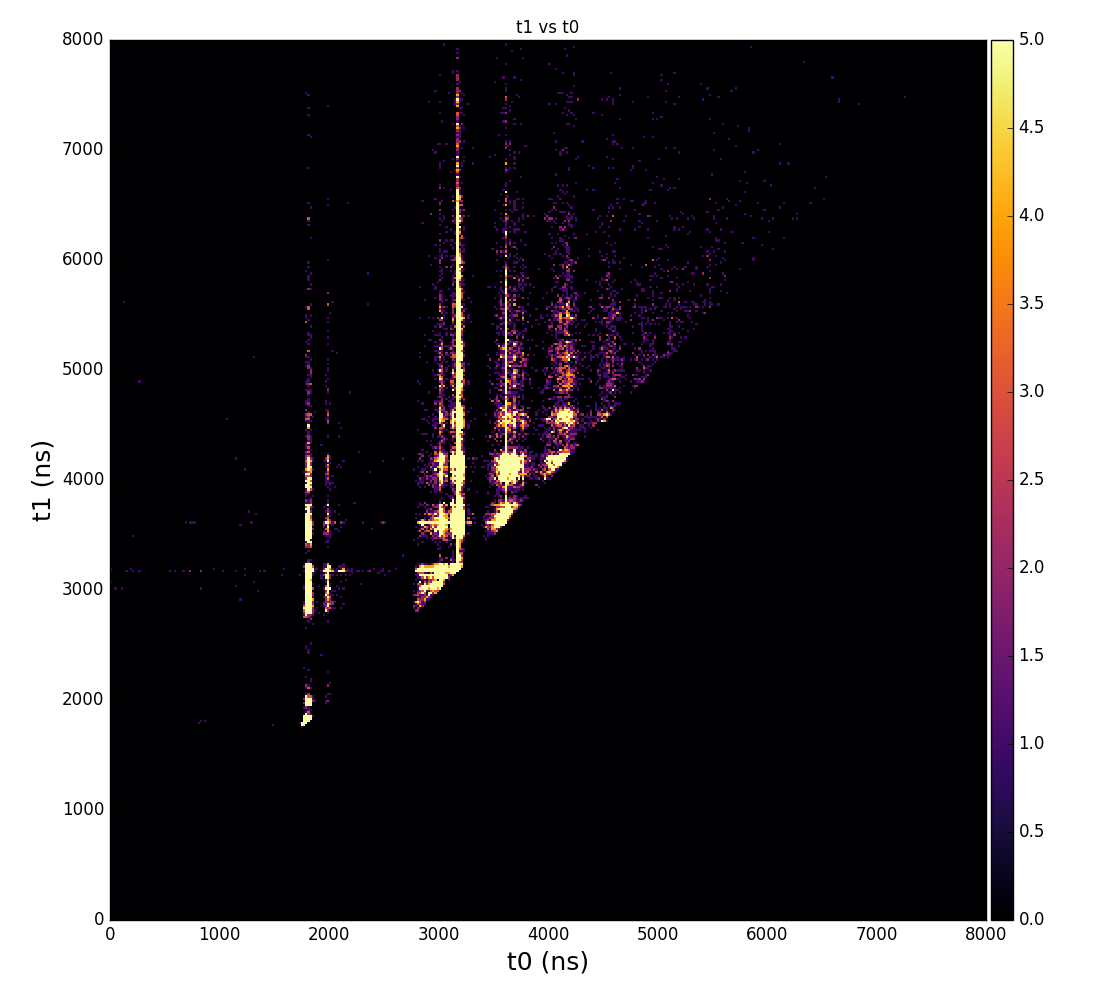
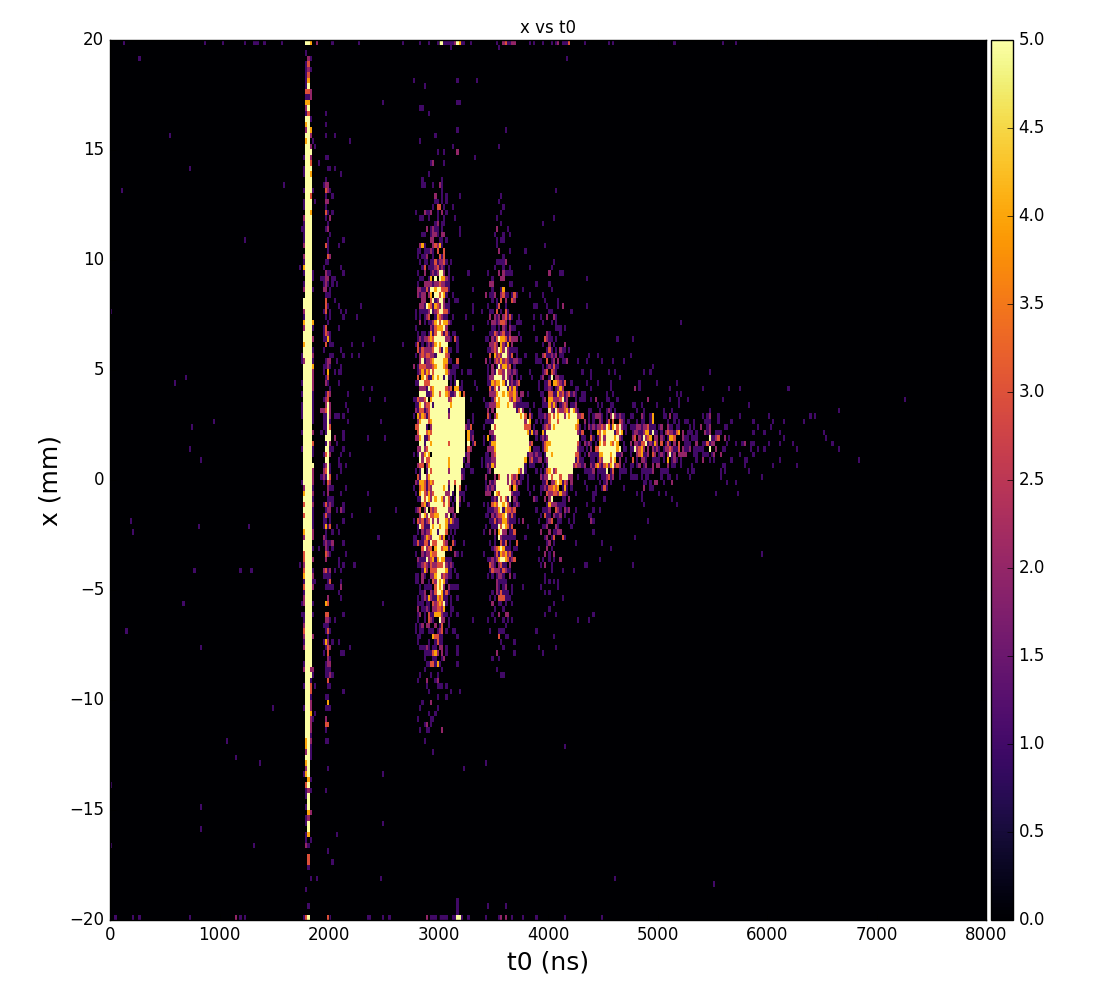
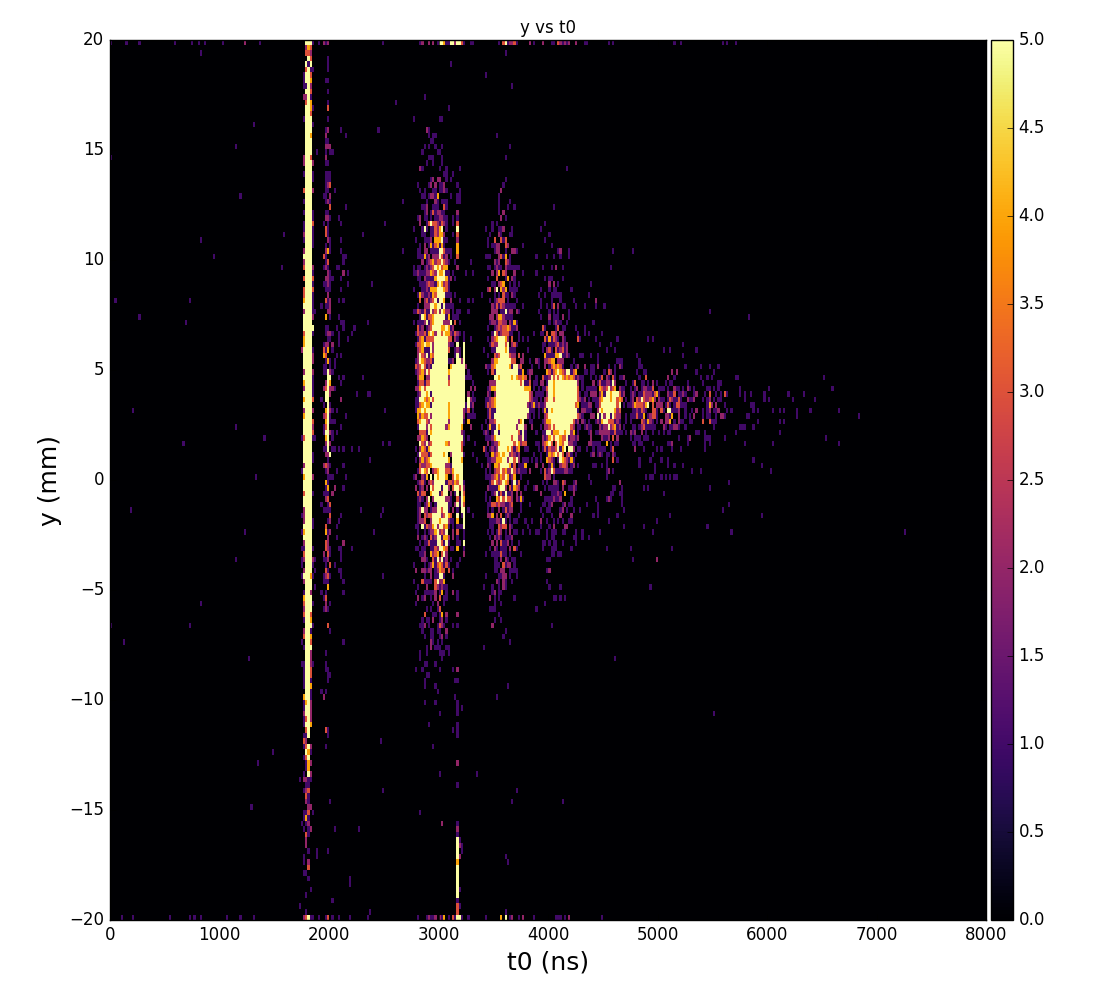
Physics plots t1,x,y vs t0
References