Motivation
Development of this application was stimulated by the discussion with Marcin Sikorski (meeting on 2012-08-30), doing xcs experiments.
Users need in real-time algorithm for calculation of image vs time auto-correlation function
g2(tau) = <I(t)*I(t+tau)> / (<I(t)> * <I(t+tau)>),
where I(t) is an image intensity at time t, and tau is a delay between two measurements.
Typical experimental condition can be described as follows:
- Run duration is about one hour at frequency up to 120 Hz that gives up to 10^5-10^6 images.
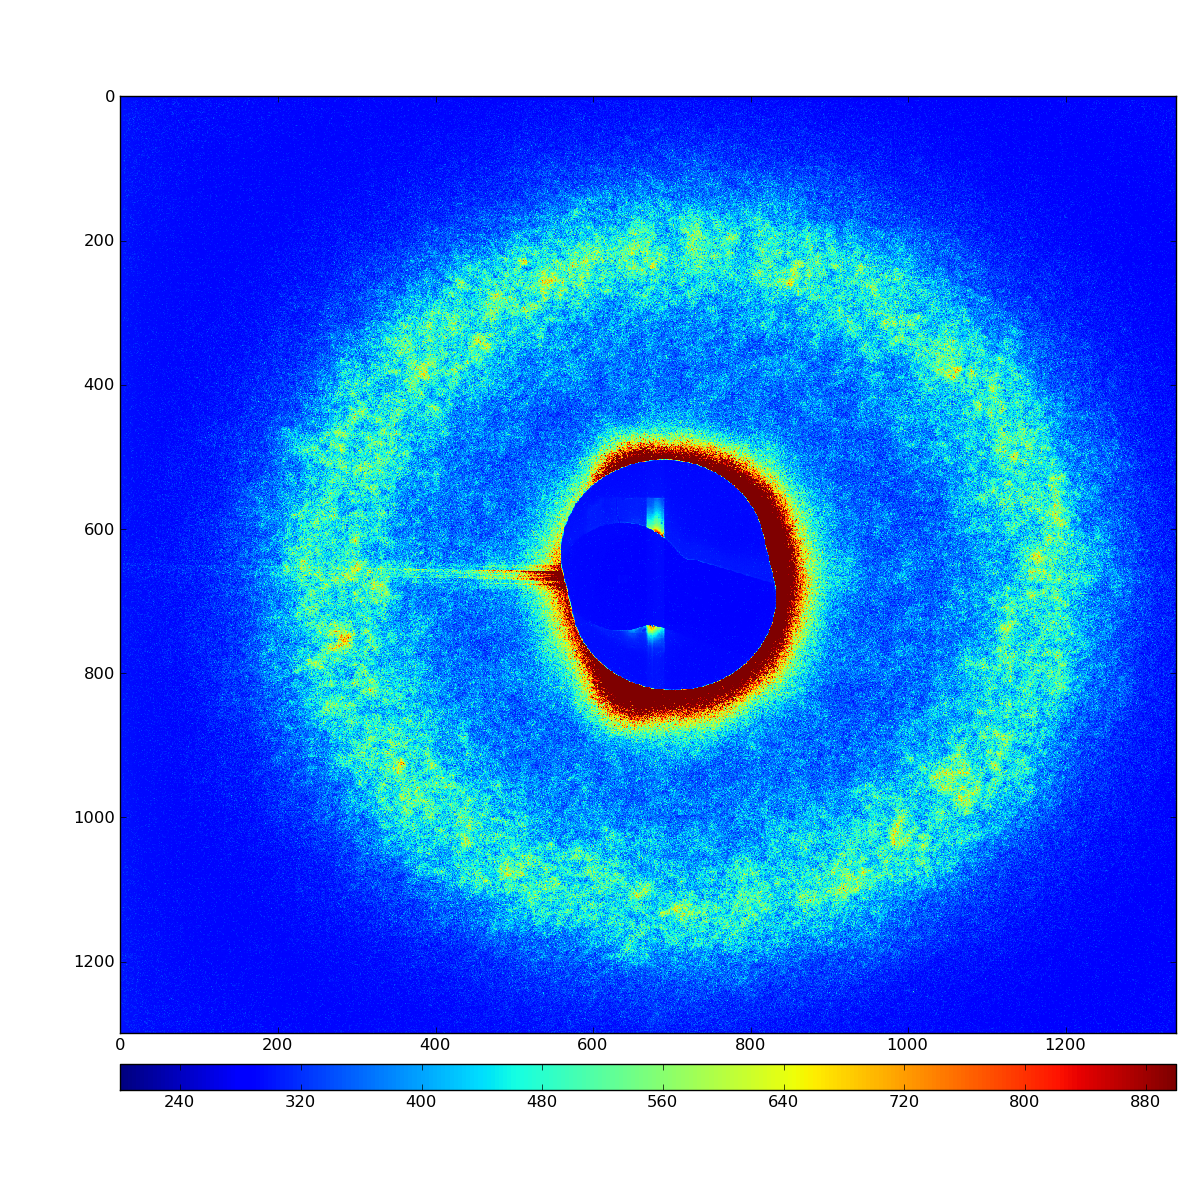
- Currently typical imaging devise is a Princeton camera with 1300x1340 pixels.
- Need to calculate
g2(tau)for each pixel, averaged over all possible image timestwith time differencetaubetween images. - A set of
taushould have about 30-100 points in log scale uniformly covering the run duration. - Use for example xcsi0112-r0015: 500 images with 8 sec delay between images.
Desired time for evaluation of the auto-correlation function should be comparable with run duration <1 hour. Currently this algorithm takes a few hours that can not be used for fast feedback in real time experiment.
Problems and tentative solutions
Based on 2012-10-03 meeting:
In order to be useful this application should do correct math, accounts for image mask, discards bad events (noisy and "bright" pixels), apply normalization etc., and have a convenient GUI. Below is a list of requirements, marked as ![]() , with suggested solutions, marked as
, with suggested solutions, marked as ![]() if exists or as
if exists or as ![]() if needs to be implemented.
if needs to be implemented.
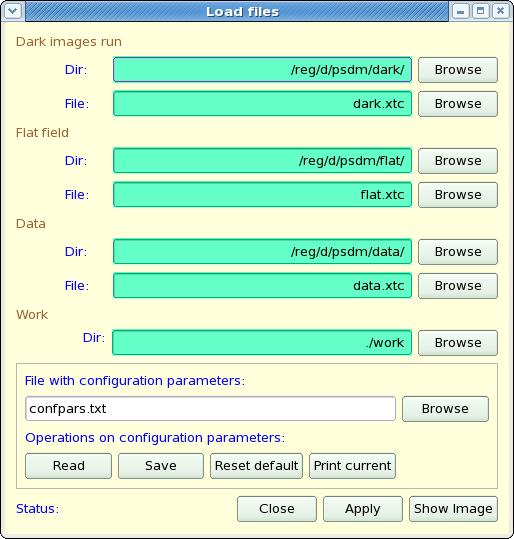
Pedestals
![]() "dark" run number should be provided by user and the imaging camera pedestals should be evaluated and applied for all runs until the "dark" run number has not changed.
"dark" run number should be provided by user and the imaging camera pedestals should be evaluated and applied for all runs until the "dark" run number has not changed.
![]() For pedestals evaluation: use available
For pedestals evaluation: use available ImgAlgos::ImgAverage psana module for "dark" run, which produces file with averaged over events pedestals and the file with their rms values.
![]() For pedestals subtraction: use
For pedestals subtraction: use ImgAlgos::ImgCalib psana module in the same job which evaluates correlators; the pedestals will be subtracted and corrected image will be retained in the event and used for correlator calculations.
Low level threshold
![]() Image pixel intensity physically can't be negative. Low amplitude noise should be suppressed by the threshold. The threshold amplitude should be provided by user (along with substituting amplitude).
Image pixel intensity physically can't be negative. Low amplitude noise should be suppressed by the threshold. The threshold amplitude should be provided by user (along with substituting amplitude).
![]() Add this feature to the
Add this feature to the ImgAlgos::ImgCalib psana module, right after pedestal evaluation.
Image filtering
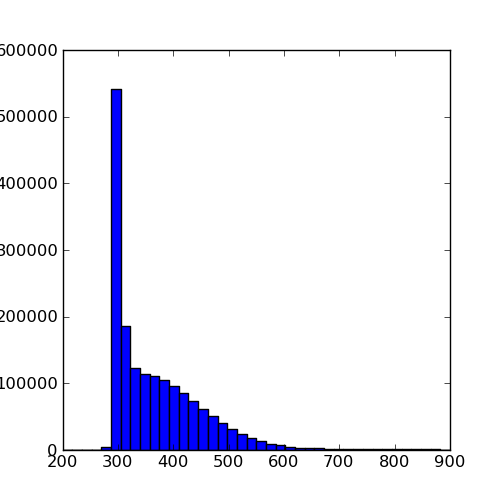
![]() Usually users use different type of intensity monitor signals in order to retain/discard image for/from further processing. Discarded images should not contribute into the correlators evaluation. The spectra of intensity monitors should be available for browsing. User should be able to select the intensity monitor(s) from the list and set low and high thresholds.
Usually users use different type of intensity monitor signals in order to retain/discard image for/from further processing. Discarded images should not contribute into the correlators evaluation. The spectra of intensity monitors should be available for browsing. User should be able to select the intensity monitor(s) from the list and set low and high thresholds.
![]() The filtering module may be implemented in psana. Based on selected intensity monitor(s) and thresholds it will decide to retain or discard event and accumulate spectral histograms. The histograms will be saved in file at the end of run.
The filtering module may be implemented in psana. Based on selected intensity monitor(s) and thresholds it will decide to retain or discard event and accumulate spectral histograms. The histograms will be saved in file at the end of run.
![]() Control GUI should be able to browse the intensity monitor histograms and set the thresholds.
Control GUI should be able to browse the intensity monitor histograms and set the thresholds.
Selection of intensity monitors
![]() It would be nice to have an algorithm like in XTC explorer
It would be nice to have an algorithm like in XTC explorer
![]() Possible options:
Possible options:
- run application as a plug-in for XTC Explorer,
- pyana module performing similar to XTC Explorer algorithm,
- stand-alone C++ module reading XTC datagrams,
- hardwired list of intensity monitors.
Dynamic mask
![]() Imaging camera may have permanently hot pixels or some pixels may be saturated during the run. User need to set a thresholds on hot pixels and high intensity.
Imaging camera may have permanently hot pixels or some pixels may be saturated during the run. User need to set a thresholds on hot pixels and high intensity.
If the pixel amplitude crosses the high intensity threshold at least once during the run, then this pixel should be excluded from further analysis. The same is valid for hot pixels, which shows above threshold intensity in large fraction of events.
![]() This can be done in psana module, which works before event selection algorithm. Two files of image size may be produced 1) for saturated and 2) for hot pixels.
This can be done in psana module, which works before event selection algorithm. Two files of image size may be produced 1) for saturated and 2) for hot pixels.
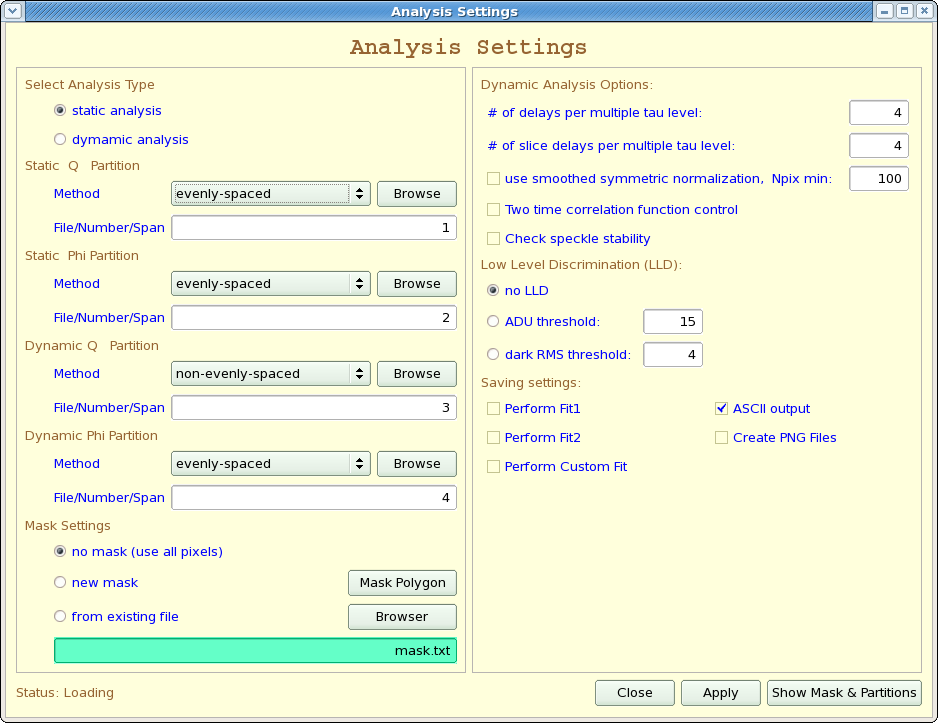
Static mask
![]() The beam-stopper region and some areas with fringes should be masked. It could be useful to have a graphical editor for mask.
The beam-stopper region and some areas with fringes should be masked. It could be useful to have a graphical editor for mask.
![]() See section for [GUI].
See section for [GUI].
Graphical editor for selected regions
![]() Sometimes it is useful to select good region of the image. It could be convenient to use a graphical editor, as for mask.
Sometimes it is useful to select good region of the image. It could be convenient to use a graphical editor, as for mask.
![]() See section for [GUI].
See section for [GUI].
Center of the image
![]() User should have an option to set a center of the rings for histograms.
User should have an option to set a center of the rings for histograms.
![]() See section for [GUI].
See section for [GUI].
Correct normalization of g2
![]() Evaluation of
Evaluation of g2 for image regions is not that simple as presented by the formula for a single pixel:
g2(tau) = <I(t)*I(t+tau)> / (<I(t)> * <I(t+tau)>),
In order to get physically meaningful results for g2, the correlators <I(t)> and <I(t+tau)> should be averaged in the fine rings around center with number of bins N2, which is order of 100, with dR down to 1-2 pixels.
Then the <I(t)*I(t+tau)> ![]() correlator should be averaged over bold rings intended for G2 evaluation. The number of these rings N1 should be order of 10.
correlator should be averaged over bold rings intended for G2 evaluation. The number of these rings N1 should be order of 10.
The N2 and N1 should be defined by user.
It might be useful to define the histogram region by the sector in the user-defined angular range.
![]() In order to have required normalization of correlators, it is not enough to save the
In order to have required normalization of correlators, it is not enough to save the g2 value only. So, the format of the resulting file has changed. Now for each value of tau the output file contains the <I(t)>, <I(t+tau)>, and <I(t)*I(t+tau)>, each for entire image written in binary for float format. Not all masks, selection regions, normalization etc. are available during correlators calculation, so correlators are evaluated for all pixels. Which pixels should be included in the G2 for each region can be decided at the final stage of processing. This approach allows to perform the most time consuming procedure - the correlators calculation once and do the analysis after that.
![]() See section for [GUI].
See section for [GUI].
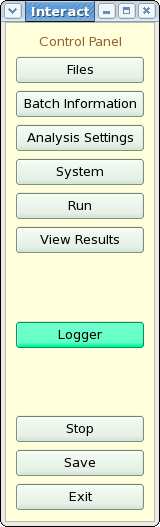
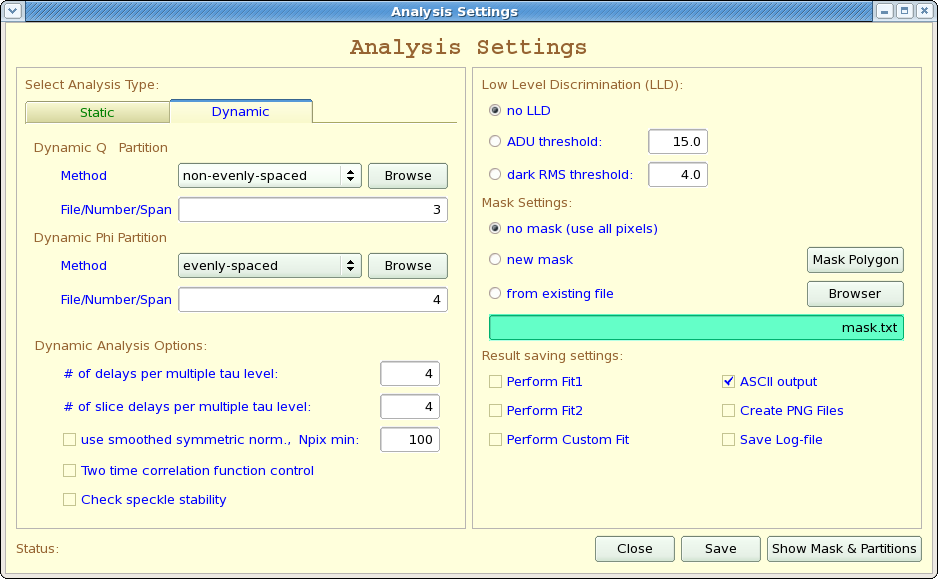
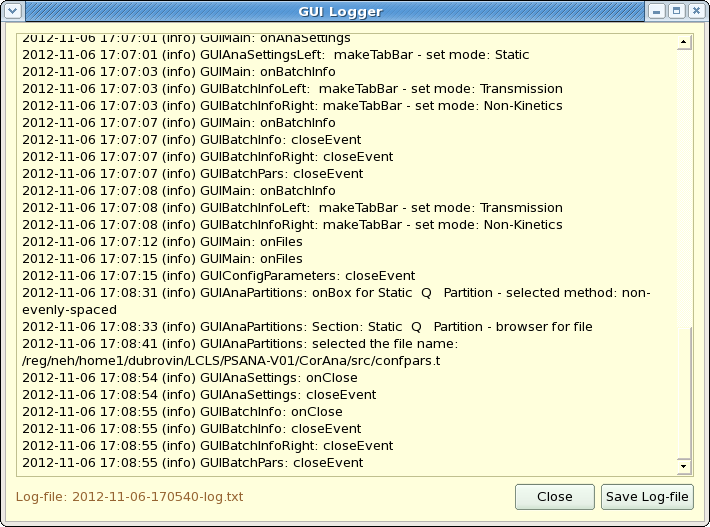
GUI
![]() In order to get an easy interface to all sub-processes, it seems to be useful to have a GUI with configuration of everything through the GUI.
In order to get an easy interface to all sub-processes, it seems to be useful to have a GUI with configuration of everything through the GUI.
![]() Well, presumably users will want different specific features in their analyses which can not be foreseen in implementation of GUI. It is pretty unlikely that everything in analysis can be done clicking on buttons in GUI. Then, it could be nice if user understand what he is doing step by step and have a monitoring at the end of each stage. We are doing science, not a standard pre-defined things... Most generic way to process data is to have a separate procedures with command line interface.
Well, presumably users will want different specific features in their analyses which can not be foreseen in implementation of GUI. It is pretty unlikely that everything in analysis can be done clicking on buttons in GUI. Then, it could be nice if user understand what he is doing step by step and have a monitoring at the end of each stage. We are doing science, not a standard pre-defined things... Most generic way to process data is to have a separate procedures with command line interface.
![]() Anyway, the browser/presenter of data stored in the files after pre-processing could be provided for a set of common plots.
Anyway, the browser/presenter of data stored in the files after pre-processing could be provided for a set of common plots.
All features listed in previous sections, such as static and dynamic mask, restriction of the region(s) of interest, selection of the image center, the binning scheme etc., can be done in the browser at the final stage of the analysis.
![]() Generic GUI as a shell for entire analysis can be implemented as an interface to the command line procedures:
Generic GUI as a shell for entire analysis can be implemented as an interface to the command line procedures:
- Each command line procedure may have a dedicated GUI for procedure configuration and monitoring.
- All procedures may be listed in the main GUI with a status sign.
- The main issue of this approach is a cross-configuration between separate procedures. This can be achieved if all procedures will have a common list of configuration parameters.
Unknown macro: {HTMLcomment}
Here is my comment
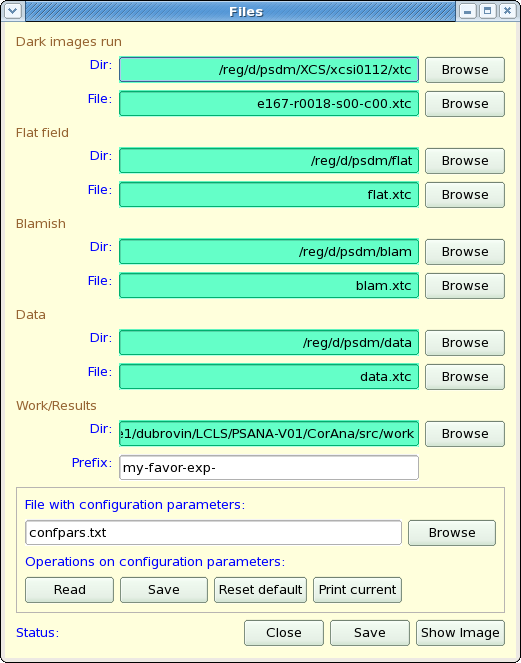
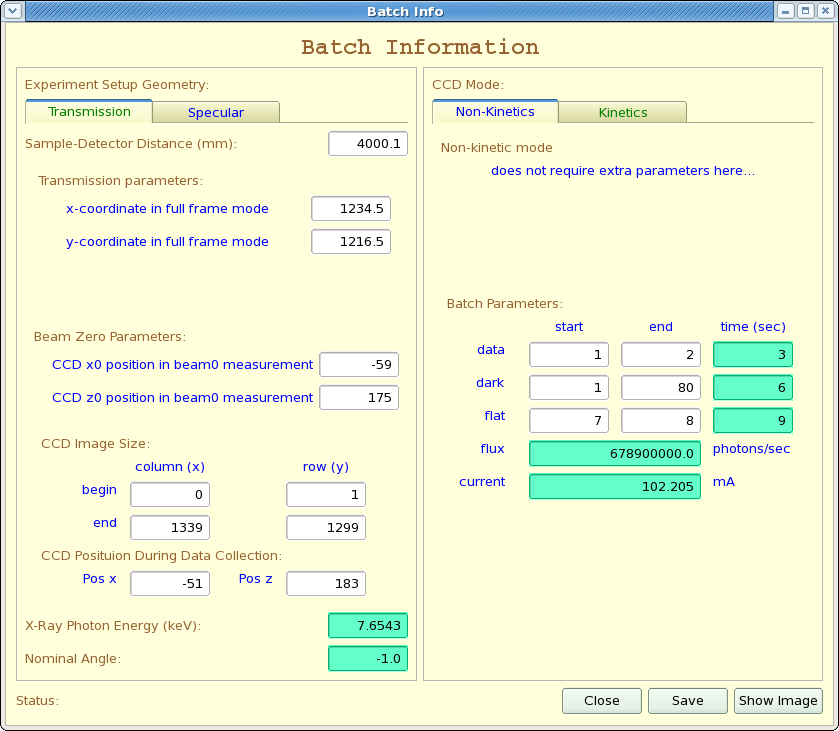
GUI Implementation
Version 1
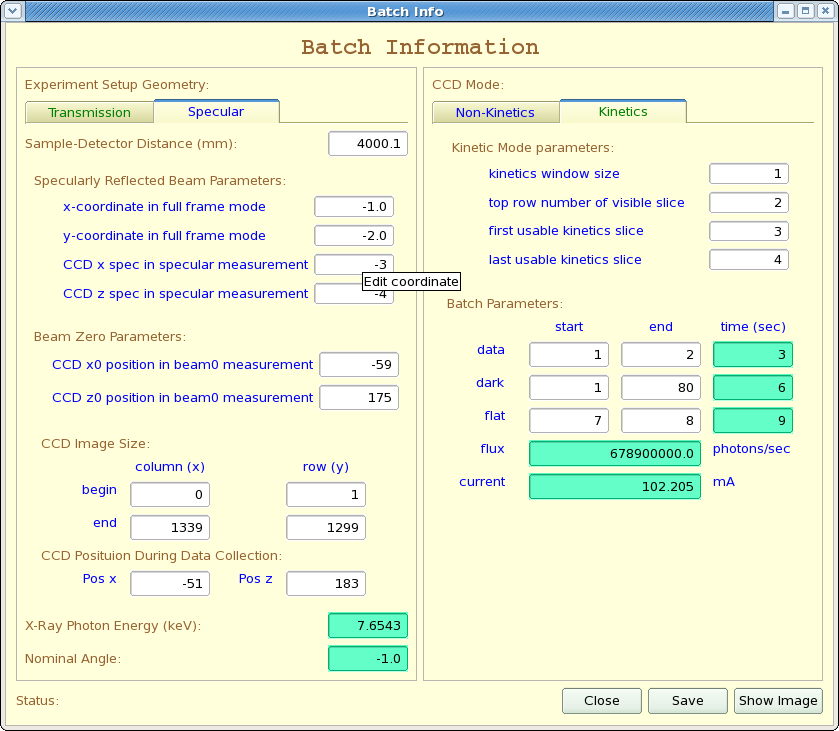
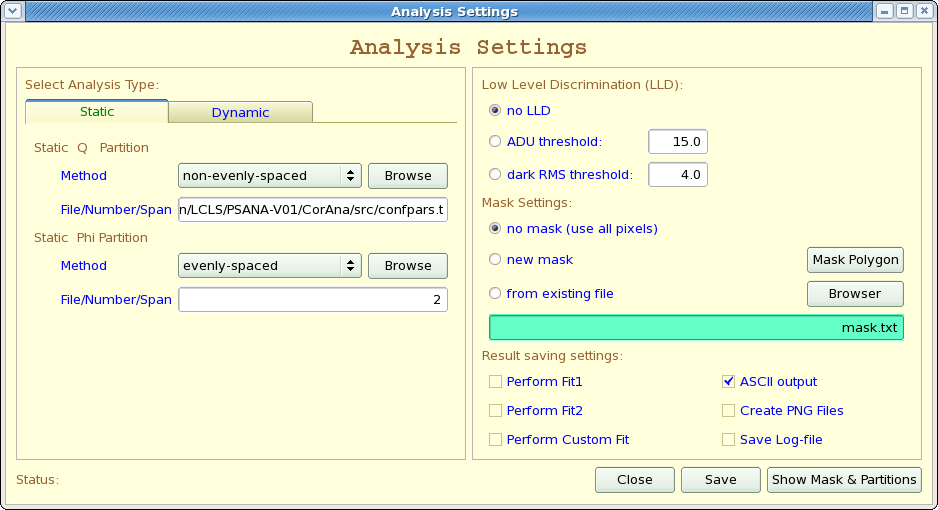
Version 2

Test for Pedestals
Algorithm
Basic idea is (1) to split image vs time for small parts in image, (2) to process each part on separate computer node, (3) to merge results at the end of processing. It is clear that significant speedup (about T/N_nodes_) is achieved at the 2nd stage. These three stages are performed in separate C++ applications. Wrapping python script allows to submit job by a single command. It takes care about file and sub-process management in this job, as described below.
Code location
All modules for this application resides in the [package ImgAlgos]:
Module |
Functionality |
|---|---|
ImgVsTimeSplitInFiles |
splitter |
CorAna |
base class with common methods |
CorAnaData |
data processing for split files |
CorAnaInputParameters |
provides storage for input parameters |
CorAnaMergeFiles |
merging algorithm |
CorAnaProcResults |
Example showing how to access results using C++ and produce a table for presentation |
CorAnaPars.py |
singleton class for parameter storage in the wrapping file manager |
CorAnaSubmit.py |
global methods for the file manager |
app/corana_submit |
pythonic script which defines the sequence of procedures |
app/corana.cpp |
main module for the part of image vs time correlation processing |
app/corana_merge.cpp |
main module for merging |
app/corana_procres.cpp |
main module for processing of results from correlator array |
data/psana-corana.cfg |
psana configuration file for ImgVsTimeSplitInFiles |
data/PlotCorAnaResults.py |
example of the python script which plots the resulting graphics |
Image splitting
Image splitting is implemented as a regular psana module [ImgAlgos::ImgVsTimeSplitInFiles].
Command to run interactively on psana#### or submit in batch from pslogin## node:
psana -c <config-file> <xtc-file-list>
bsub -q psfehq -o log-file 'psana -c <config-file> <xtc-file-list>'
For example:
psana -c ImgAlgos/data/psana-corana.cfg /reg/d/psdm/XCS/xcsi0112/xtc/e167-r0015-*
where ImgAlgos/data/psana-corana.cfg is an example of the configuration script for psana and /reg/d/psdm/XCS/xcsi0112/xtc/e167-r0015-* are the input xtc files for particular run.
A couple of limitations due to LCLS policy:
Interactive job can be run on psana#### computer, but the batch queues are not seen from psana#### nodes...
Batch job can be submitted from pslogin## computer, but data are not seen directly from pslogin## nodes...
Produces the files:
cor-ana-r0015-b0000.bin - file with a part of image vs time
cor-ana-r0015-b0001.bin
cor-ana-r0015-b0002.bin
cor-ana-r0015-b0003.bin
cor-ana-r0015-b0004.bin
cor-ana-r0015-b0005.bin
cor-ana-r0015-b0006.bin
cor-ana-r0015-b0007.bin
cor-ana-r0015-time.txt - list of time-records for all events in processed run.
cor-ana-r0015-time-ind.txt - list of time-records for all events in processed run with time index.
cor-ana-r0015-med.txt - file with metadata. In particular it has the original image size, number of image parts for splitting, number of images in run, etc.
Algorithms:
- The <int16_t> image data array is split for ordered number of equal parts (by the parameters
nfiles_outin psana-corana.cfg file) and each part is saved in the outputcor-ana-r0015-b####.binfile sequentially for all selected events. - The appropriate time record for selected event is saved in the file
cor-ana-r0015-time.txt. - At the end of the splitting procedure:
- the average time difference and its rms between sequential events is evaluated for all recorded time records.
- The file
cor-ana-r0015-time.txtis re-processed and for each record the time index is evaluated as unsigned value of<time-index> = (<event-time> + 0.5 <average-time-between-events>) / <average-time-between-events>
- Event record with time index is saved in the file
cor-ana-r0015-time-ind.txt
- All metadata parameters which are required for further processing, such as input parameters, image size,
<average-time-between-events, maximal value of the time index etc., are saved in filecor-ana-r0015-med.txt.
This approach allows to apply the modest event selection algorithms in psana pre-processing stage.
But, it still based on uniform time indexing...
Q: Is it really good assumption for this kind of experiments?
Time correlation processing
ImgAlgos/app/corana application
Command to run interactively on psana#### or submit in batch from pslogin## node:
corana -f <fname-data> [-t <fname-tau>] [-l <logfile>] [-h]
bsub -q psfehq -o log-file 'corana -f <fname-data> [-t <fname-tau>] [-l <logfile>] [-h]'
For example the interactive and batch mode commands:
corana -f cor-ana-r0015-b0001.bin -t my-tau.txt
bsub -q psfehq -o log-file 'corana -f cor-ana-r0015-b0000.bin'
Produce files:
cor-ana-r0015-tau.txt          - string of {{tau}} values for which the auto-correlation function is evaluated
cor-ana-r0015-b0000-result.bin - auto-correlators for the part of the image for all {{tau}} values
cor-ana-r0015-b0001-result.bin
cor-ana-r0015-b0002-result.bin
cor-ana-r0015-b0003-result.bin
cor-ana-r0015-b0004-result.bin
cor-ana-r0015-b0005-result.bin
cor-ana-r0015-b0006-result.bin
cor-ana-r0015-b0007-result.bin
Merging results
ImgAlgos/app/corana_merge application
Command to run interactively on psana#### or submit in batch from pslogin## node:
corana_merge -f <fname-data> [-t <fname-tau>] [-l <logfile>] [-h]
bsub -q psfehq -o log-file 'corana_merge -f <fname-data> [-t <fname-tau>] [-l <logfile>] [-h]'
For example:
corana_merge -f cor-ana-r0015-b0001-result.bin -t my-tau.txt
This procedure produces file:
cor-ana-r0015-image-result.bin
Example of how to get and process results
ImgAlgos/app/corana_procres
Command to run interactively on psana#### or submit in batch from pslogin## node:
corana_procres -f <fname-data> [-t <fname-tau>] [-l <logfile>] [-h]
bsub -q psfehq -o log-file 'corana_procres -f <fname-data> [-t <fname-tau>] [-l <logfile>] [-h]'
Basically it reads files with results and produces the histogram-like table *-hist.txt.
Automatic processing
ImgAlgos/app/corana_submit - is a wrapping script which allows to run all of above procedures by a single command from pslogin## node and it keeps eye on processing of jobs in batch and doing the file management. Command to start:
corana_submit [-c <config-file>] [-t <fname-tau>] [-x] <xtc-file-list>
For example:
corana_submit -c ImgAlgos/data/psana-corana.cfg -t my-tau.txt /reg/d/psdm/XCS/xcsi0112/xtc/e167-r0015-s00-c00.xtc
This script sequentially performs operations for single run as follows:
- Initialize all parameters
- Run psana to split image for files
- Check that all split files are produced
- Submit job for time-correlation processing
- Check that all processed files are produced
- Submit job for merging
- Check that merged file is produced
- Submit job for test processing of the file with results
- List all created files
- Clean-up files in the work directory
- List of preserved files
The next to last procedure deletes all intermediate split- and log- files.
In debugging mode this procedure may be turned off.
Manual sequential processing
In case of manual processing of all scripts, commands need to be issued in a right order. Commands corana, corana_merge, and corana_procres should have the same list of parameters. This is important, because all file names for these procedures are generated by the same base class ImgAlgos/src/CorAna.cpp
Right sequence of commands to run interactively on psana####
psana -c <config-file> <xtc-file-list>
corana         -f <fname-data> [-t <fname-tau>] [-l <logfile>] [-h]
corana_merge   -f <fname-data> [-t <fname-tau>] [-l <logfile>] [-h]
corana_procres -f <fname-data> [-t <fname-tau>] [-l <logfile>] [-h]
or submit in batch from pslogin## node:
bsub -q psfehq -o log-file 'psana -c <config-file> <xtc-file-list>'
bsub -q psfehq -o log-file 'corana         -f <fname-data> [-t <fname-tau>] [-l <logfile>] [-h]'
bsub -q psfehq -o log-file 'corana_merge   -f <fname-data> [-t <fname-tau>] [-l <logfile>] [-h]'
bsub -q psfehq -o log-file 'corana_procres -f <fname-data> [-t <fname-tau>] [-l <logfile>] [-h]'
The corana batch jobs can be submitted and run on separate butch nodes in parallel. All other procedures can be submitted when previous is successfully finished and all necessary files are produced.
The corana_procres command is optional and is currently used for test purpose only. But, it may be replaced by real analysis code.
File formats
- File with split-image data for selected events
cor-ana-r0015-b000N.bin:
Currently this file contains<uint16_t>amplitude for each pixel in binary format for:<data-for-img-partN-of-img1> <data-for-img-partN-of-img2> ... <data-for-img-partN-of-imgLast>
- File with metadata parameters
cor-ana-r0015-med.txt:IMAGE_ROWS 1300 IMAGE_COLS 1340 IMAGE_SIZE 1742000 NUMBER_OF_FILES 8 BLOCK_SIZE 217750 REST_SIZE 0 NUMBER_OF_IMGS 500 FILE_TYPE bin DATA_TYPE uint16_t TIME_SEC_AVE 8.088413 TIME_SEC_RMS 0.063639 TIME_INDEX_MAX 499
- File with image time records
cor-ana-r0015-time.txt:where each record has:1 0.000000 0.000000 20120616-080236.671607864 5366 0 2 8.026429 8.026429 20120616-080244.698036743 8255 1 3 16.144788 8.118359 20120616-080252.816395836 11177 2 4 24.154835 8.010048 20120616-080300.826443448 14060 3 ...<image-in-file#> <t(sec)-from-the-1st-event> <dt(sec)> <time-stamp> <fiducials> <event#-since-configure>
- File with image time records and evaluated time index
cor-ana-r0015-time-ind.txt:where each record has:1 0.000000 0.000000 20120616-080236.671607864 5366 0 0 2 8.026429 8.026429 20120616-080244.698036743 8255 1 1 3 16.144788 8.118359 20120616-080252.816395836 11177 2 2 4 24.154835 8.010048 20120616-080300.826443448 14060 3 3 5 32.281937 8.127102 20120616-080308.953545010 16985 4 4 ...<image-in-file#> <t(sec)-from-the-1st-event> <dt(sec)> <time-stamp> <fiducials> <event#-since-configure> <time-index-starting-from-0>
- File with split-image correlators for each value of
taucor-ana-r0015-b000N-result.bin:
Currently it saves<float>correlator for each pixel in binary format for:<corr-for-img-partN-of-tau1> <corr-for-img-partN-of-tau2> ... <corr-for-img-partN-of-tauLast>
my-tau.txt:contains the1 3 5 7 9 10 12 14 16 18 20 24 28 30 32 36 40 ... 160 180 200 240 280 300 320 360 400
tauvalues presented in terms of number of ordered images in the file.
Quick start guide
We assume that everything is set up to work on LCLS analysis farm, otherwise see [PCDS:Computing] and [Account Setup].
How to run this procedure
If the version of the [package ImgAlgos] is available as a current software release, then you may run the script command(s) directly, for example:
cd <your-favorite-directory>
mkdir work_corana
sit_setup
corana_submit [-c <config-file>] [-t <fname-tau>] [-x] <xtc-file-list>
If the code in the [package ImgAlgos] has been recently changed and the updated release is not yet available, then one need to create the local release directory, get the latest/HEAD version of the package, and compile the code as shown below:
cd <your-favorite-directory>
newrel ana-current myReleaseDirectory
cd myReleaseDirectory
sit_setup
addpkg ImgAlgos HEAD
scons
Where to find results
The procedure will produce a bunch of files in the work_corana directory. If everything is OK, then all spit - and log- files will be removed at the end of automatic corana_submit procedure. The most important files are preserved for further analysis:
File name tail |
Format |
Content |
|---|---|---|
*-image-result.bin |
binary for <float> |
correlators for all image pixels for all tau values |
*-time-ind.txt |
text |
time records for all selected events/images |
*-tau.txt |
text |
the list of tau intervals |
*-med.txt |
text |
meta data parameters |
*-hist.txt |
text |
Histogram array with correlators averaged for ring regions of the image for all |
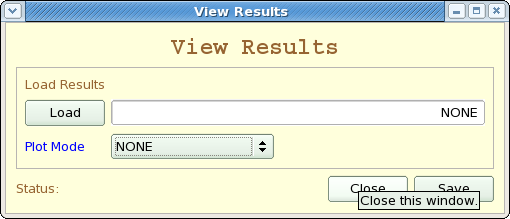
How to look at results
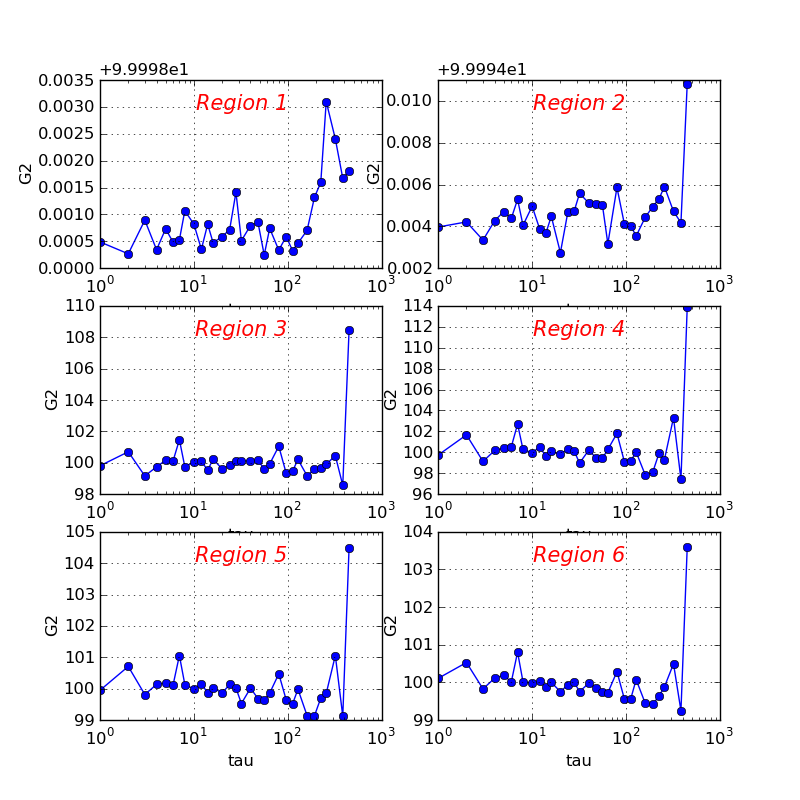
It is assumed that all files listed in previous section may be used for further analysis, depending on particular goals. The optional script corana_procres is designed as an example of how to access data from C++ code. Class CorAnaProcResults produces the file *-hist.txt
A simple python script shows how to plot this file:
./ImgAlgos/data/PlotCorAnaResults.py work_corana/cor-ana-r0015-hist.txt
Another option is to use python script for direct processing of the resulting files.
This is not elaborated yet.
Q: What kind of further processing is desired and what tools are going to be used?
Overview
Content Tools