Introduction
In analysis of any experimental data it is useful to check what is written in data files. To perform this check LCLS users need in flexible interactive tool. In this note we describe the Event display which works with HDF5 files. Before developing this Event display we have evaluated a couple of currently available generic tools which also work with HDF5 data presentation, HDFView and ViTables. Both of these tools have numerous pros and cons, but definitely, as is they can not cover all LCLS-specific graphical demands. After discussion of the platform for the event display we came to conclusion that the most clean and compact code could be written on Python with broad exploitation of standard libraries for graphics and GUIs, such as matplotlib and PyQt4, respectively. Below we overview the features and current status of the Event display project.
Event display features
This program is designed to access the LCLS data in HDF5 files and present them in printable or graphical formats. Currently the Event display can perform many tasks, as follows.
- Select the input HDF5 file
- Display entire HDF5 file structure
- Print attributes and data structure of each HDF5 item (group or data set)
- Select the data-records for graphical presentation
- Select type of figures and plot
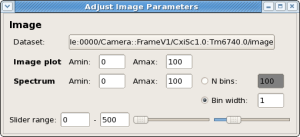
- Image and spectra for any camera
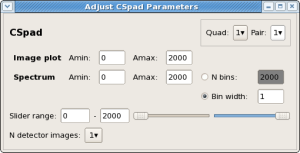
- Image and spectra for CSpad detector
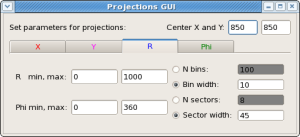
- X, Y, R, and ? projections of any 2D images
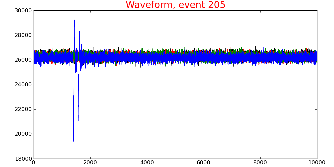
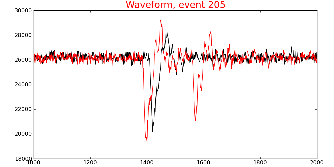
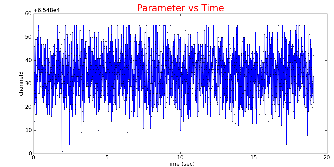
- Waveforms
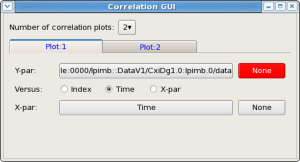
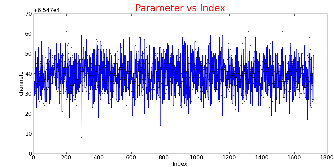
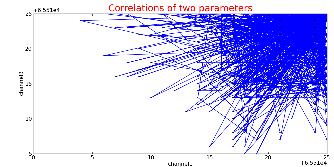
- Correlations between scalar parameters
- Event averaging
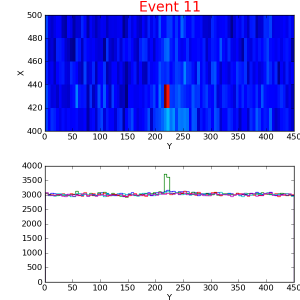
- Event selection using amplitude thresholds in specified regions of images
How to get a copy and run this program?
We assume that everything is set up to work on LCLS analysis farm, otherwise see Computing and Account Setup.
Being on psana0### one may get source code and build executable:
cd <your-favorite-directory>
newrel ana-current myVersionOfTheEventDisplay
cd myVersionOfTheEventDisplay
sit_setup
addpkg EventDisplay       (at this stage you need to have access to yakut.slac.stanford.edu)
scons
When these stages are passed successfully, the Event display can be started by the command
evtdisplay
If you are going to use the HDF5 files from Lustre file system, this program should be run on psana0###.
Event Display GUIs
Execution of this program begins with displaying of the Main GUI. All other GUIs and plots can be lunched
by clicking on mouse starting from the Main GUI. Next section explains what can be done through the Event display system of GUIs.
Main GUI

HDF5 tree item selection GUI

What to display GUI

The bottom part of the What to display GUI can be selected by the tub-bar (or selecting appropriate check boxes) for
CSpad, Image, Wave, Correlation GUIs

and projection plots, which can be also selected by the tab bar for
X, Y, R, and ? projection GUIs


GUI for manipulation with configuration parameters

Event selection GUI

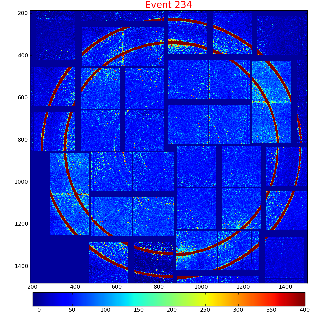
Image of the detector
Run 430: 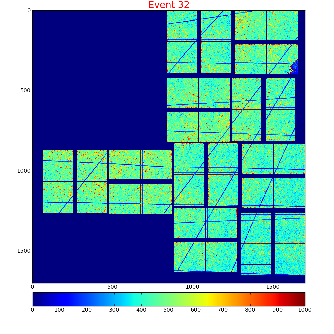 Run 587:
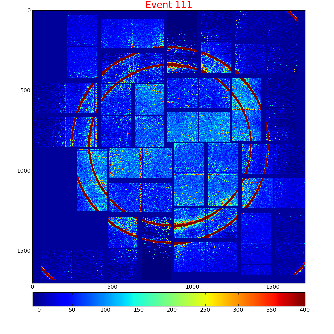
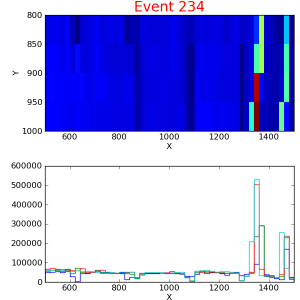
Zoomed-in CSpad image with selection window and averaged image
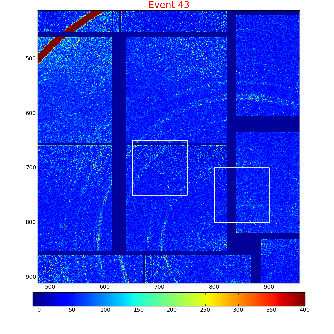

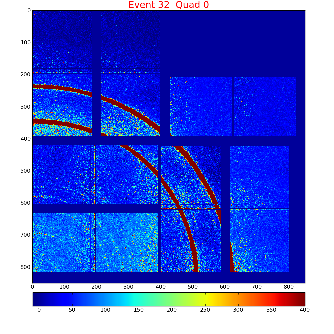
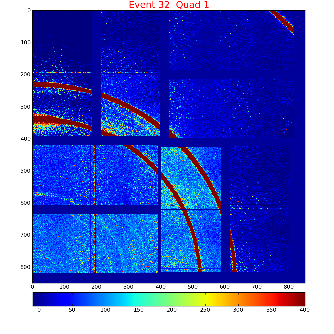
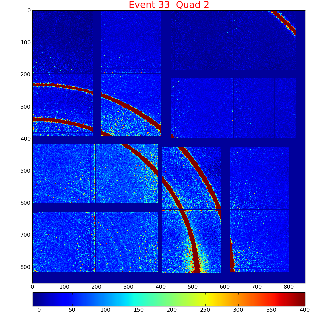
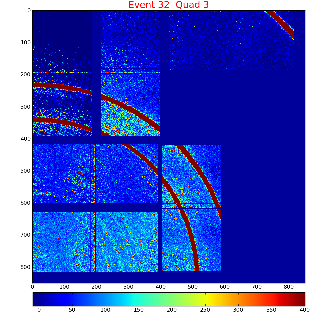
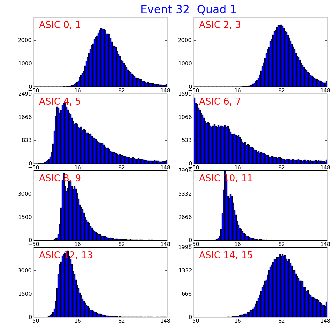
Image of the quad
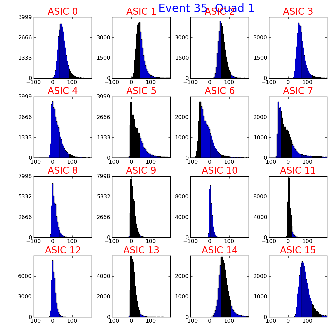
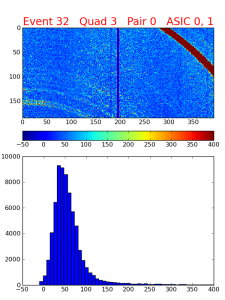
Spectra of ASICs and 2x1 pairs, image and spectrum of pair
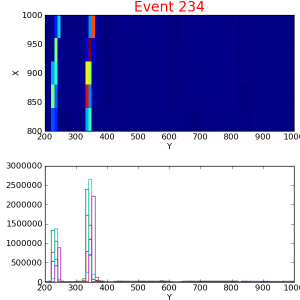
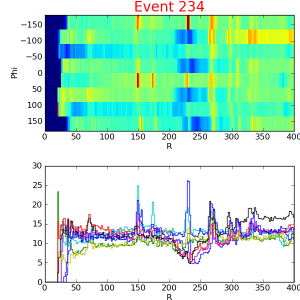
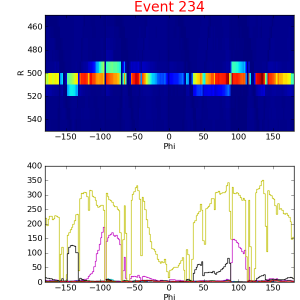
X, Y, R, and Phi projections of CSpad


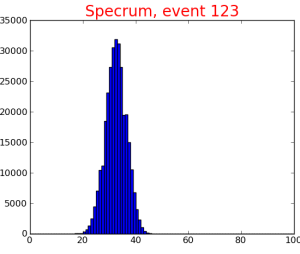
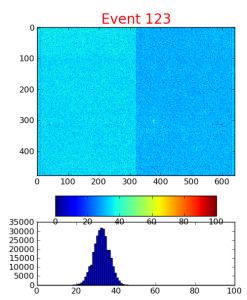
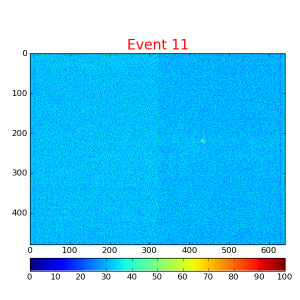
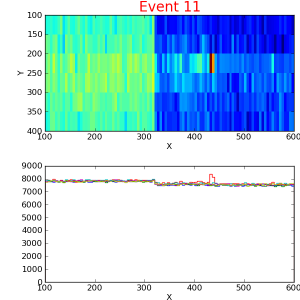
Plots for camera images
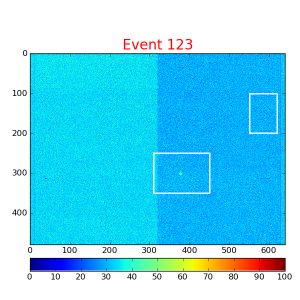
Entire camera image (white box shows the selection window), zoomed-in camera image, spectrum of amplitudes and combined plot for image and spectrum

Camera image and X, Y, R, and Phi projections


Plots for waveforms
For auto and manual adjustment of the range parameters
Correlation plots
Overview
Content Tools