This note is about an old version of this program.
Please see HDF5 Explorer - Old for current version.
Introduction
In analysis of experimental data it is useful to test content of the data files. To perform this task LCLS users need in flexible interactive tool. We have evaluated a couple of currently available generic tools which present HDF5 data, HDFView and ViTables. Both of these tools have numerous pros and cons, but, definitely, as is they can not cover all LCLS-specific graphical demands; HDFView has very primitive graphics and can not plot LCLS camera images, ViTables does not have any graphics at all, except for GUI. Extension of these packages for LCLS needs is possible, but requires significant intervention in the code of these quite specific applications. In order to keep flexibility in implementation of graphical algorithms we decided to develop our own Event displays for XTC and HDF5 file formats. After discussion of the platform for the Event display we came to conclusion that most clean and compact code can be written on Python with broad exploitation of standard libraries for HDF5 access, graphics, and GUIs, such as h5py, matplotlib, and PyQt4, respectively. In this note we overview features, functionality, and status of the Event display which works with HDF5 files. XTC Explorer - Old has its own documentation.
Event display features
This program is designed to access LCLS data in HDF5 files and present them in printable and graphical forms. Event display can perform many tasks, as follows.
- Select the input HDF5 file
- Display entire HDF5 file structure
- Print attributes and data structure of each HDF5 item (group or data set)
- Select the data-records for graphical presentation
- Select type of figures and plot
- Image and spectra for any camera
- Image and spectra for CSpad detector
- X, Y, R, and Phi projections of any 2-D images
- Waveforms
- Correlations between scalar parameters
- Event averaging
- Apply the event selection using amplitude thresholds in specified regions of images
- Save and retrieve the configuration parameters
How to get a copy and run this program
We assume that everything is set up to work on LCLS analysis farm, otherwise see Computing (including Analysis) and Account Setup.
Being on psana0### one may get a source code and build executable:
cd <your-favorite-directory>
newrel ana-current myVersionOfTheEventDisplay
cd myVersionOfTheEventDisplay
sit_setup
addpkg EventDisplay       (at this stage you need to have access to yakut.slac.stanford.edu)
scons
When these stages are passed successfully, the Event display can be started by the command
evtdisplay
This command lunches the graphical user interface (GUI) beginning from the Main GUI. All other GUIs and plots can be lunched by clicking on mouse starting from the Main GUI.
If you are going to use the HDF5 files from Lustre file system, this program should be run on psana0###.
Event Display GUIs
System of GUIs provides a convenient uniform control on execution of the Event display program.
This section explains a functionality of the system of GUIs.
Main GUI

Main GUI is a central control unit of the Event display. Each button or field in this or any other Event display GUI can be activated by clicking on mouse left button. Meaning and functionality of the Main GUI buttons and fields can be listed as follows.
Unknown macro: {highlight} File:
- is used to indicate the HDF5 file path and name. This is a fast method to change the file name, but
Unknown macro: {highlight} this is not a recommended way
as an error prone due to possible typos at edition of this field.
- opens standard menu to navigate over file system and to select the HDF5 file path and name. This
Unknown macro: {highlight} is a recommended way
to choose the data file.
- open / close the HDF5 tree and item selection GUI.
- open / close the What to display GUI.
- open / close the Selection GUI.
- open / close the Configuration GUI, and saves current configuration in the configuration file.
- closes all windows and exits program. The same operation is defined for the
button in the top-right corner of the GUI window.
Middle section of the Main GUI, contained in the rectangular frame, is intended for operation with a few event drawing modes. Meaning and functionality of these buttons and fields are quite intuitive;
Unknown macro: {highlight} Apply selection
- check box defines if the selection condition set in the Selection GUI are applied. Selection algorithm works for the "Draw", "Slide show", and "Average" modes.
Unknown macro: {highlight} Current event:
- sets the current event number, which is used in "Drawing", "Slide show", and "Average" modes.
Unknown macro: {highlight} Span:
- sets the number of events for span interval. This number is used in "Drawing", "Slide show", and "Average" modes. Left and right arrow-buttons decrements and increments the span value by one unit, respectively.
- button resets current event and span to 0 and 1, respectively.
Unknown macro: {highlight}
- draws previous, current, or next event, respectively. In case of the "next" and "previous" button, an increment and decrement is defined by the span field. If the "Apply selection" check box is checked, this procedure is repeated recursively until the selection condition is fulfilled.
Draw:
Unknown macro: {html} <INPUT type="button" value="Previous"></INPUT> <INPUT type="button" value="Current"></INPUT> <INPUT type="button" value="Next"></INPUT>
Unknown macro: {highlight}
- buttons starts or stops the slide show, beginning from current event with interval defined by the span field. If the "Apply selection" check box is checked, this procedure shows events with fulfilled selection condition.
Slide show:
Unknown macro: {html} <INPUT type="button" value="Start"></INPUT> <INPUT type="button" value="Stop"></INPUT>
Unknown macro: {highlight}
- this procedure loops over "number of events" beginning from current and calculate the per-event average images and waveforms. If the "Apply selection" check box is checked, this procedure accounts only for events with fulfilled selection condition. In this case the "number of events" actually means the number of selected event.
Unknown macro: {html} <INPUT mce_style="background-color: #e6ffe6;" style="background-color: rgb(230, 255, 230);" type="button" value="Average"></INPUT>
over
Unknown macro: {html} <INPUT align="middle" size="14" type="text" value="number of events"></INPUT>
events
- draw the correlation plots correlation plots.
HDF5 tree and item selection GUI
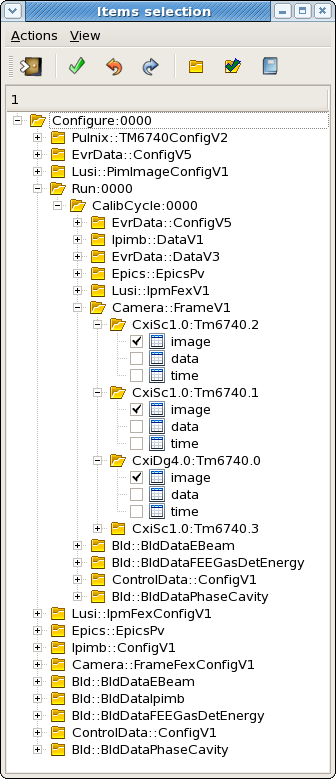
HDF5 tree and item selection GUI shows the HDF5 file tree structure, which resembles the file system tree. Control buttons of this GUI are presented by the icons on tool bar and repeated in the menu bar. Their meaning and functionality from left to right on tool bar are presented as follows.

Unknown macro: {highlight} Exit
- closes the GUI window, the same as
button in the top-right corner of this window.

Unknown macro: {highlight} Check
- saves all currently checked items for current configuration.

Unknown macro: {highlight} Reset
- resets all check boxes in unchecked state.

Unknown macro: {highlight} Retrieve
- restores checked items from current configuration.


Unknown macro: {highlight} Expand / collapse
- expands / collapses folders from root to the final data items.

Unknown macro: {highlight} Expand / collapse checked
- expands / collapses the folders for currently checked data items only.

Unknown macro: {highlight} Print
- prints the structure of the HDF5 file tree (does not add too much to the graphical presentation of the HDF5 tree).
This GUI by itself gives an excellent opportunity to explore and check a structure of the HDF5 file. Clicking on any item of this tree, prints associated information for this item and its additional attributes, if available.
All datasets, which you plan to use in graphical presentations, have to be checked in their individual check boxes. When a desired list of datasets is chosen, it needs to be passed to the current configuration by clicking on the
Unknown macro: {highlight} Check
button.
What to display GUI
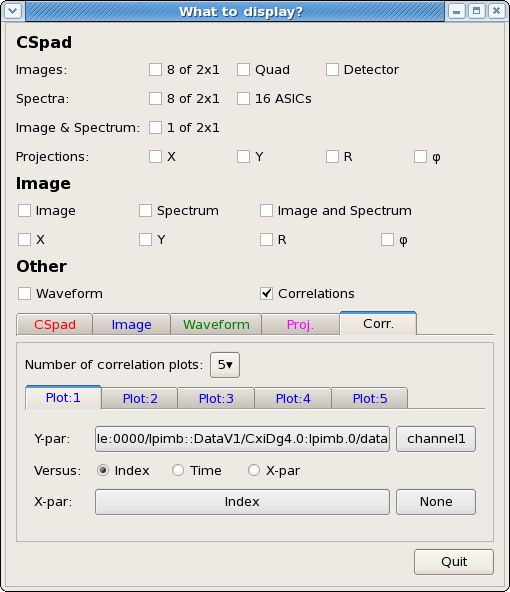
What to display GUI is intended to select plots for drawing and to set specific plot parameters. Desired plots can be selected by marking the check boxes in the top part of this GUI. When the check-mark is set, the relevant plot parameters appear in the bottom part of the GUI. Tab bar in the middle also allows to switch between the parameter definition GUIs. Check boxes for plots are grouped in a few sections as follows.
CSpad
These plots present the CSpad image datasets, for example
/Configure:0000/Run:0000/CalibCycle:0000/CsPad::ElementV2/CxiDs1.0:Cspad.0/data,
which should be checked in the HDF5 tree and item selection GUI.
Unknown macro: {highlight}
- turns on/off images of 8 quad's 2x1 sensors, aligned quad image, and aligned CSpad detector image, respectively.
Images:
Unknown macro: {html} <INPUT checked="checked" type="checkbox"></INPUT>
[8 of 2x1 ]
Unknown macro: {html} <INPUT checked="checked" type="checkbox"></INPUT>
[Quad]
Unknown macro: {html} <INPUT checked="checked" type="checkbox"></INPUT>
[Detector ]
Unknown macro: {highlight}
- turns on/off spectra of 8 quad's 2x1 sensors and 16 of separate ASICs'.
Spectra:
Unknown macro: {html} <INPUT checked="checked" type="checkbox"></INPUT>
[8 of 2x1]
Unknown macro: {html} <INPUT checked="checked" type="checkbox"></INPUT>
[16 ASICs]
Unknown macro: {highlight}
- turns on/off image and spectrum for a single 2x1 sensor.
Image & Spectrum:
Unknown macro: {html} <INPUT checked="checked" type="checkbox"></INPUT>
[1 of 2x1]
Unknown macro: {highlight}
- turns on/off relevant projection 1-D histograms of the CSpad detector image.
Projections:
Unknown macro: {html} <INPUT checked="checked" type="checkbox"></INPUT>
[X ]
Unknown macro: {html} <INPUT checked="checked" type="checkbox"></INPUT>
[Y ]
Unknown macro: {html} <INPUT checked="checked" type="checkbox"></INPUT>
[R ]
Unknown macro: {html} <INPUT checked="checked" type="checkbox"></INPUT>
[Phi]
Images
These plots present the Camera image datasets, for example
/Configure:0000/Run:0000/CalibCycle:0000/Camera::FrameV1/CxiSc1.0:Tm6740.0/image,
which should be checked in the HDF5 tree and item selection GUI.
Possible plots are:
Unknown macro: {highlight}
Unknown macro: {html} <INPUT checked="checked" type="checkbox"></INPUT>
[Image ]
Unknown macro: {html} <INPUT checked="checked" type="checkbox"></INPUT>
[Spectrum ]
Unknown macro: {html} <INPUT checked="checked" type="checkbox"></INPUT>
[Image and Spectrum ]
and projections:
Unknown macro: {highlight}
Unknown macro: {html} <INPUT checked="checked" type="checkbox"></INPUT>
[X ]
Unknown macro: {html} <INPUT checked="checked" type="checkbox"></INPUT>
[Y ]
Unknown macro: {html} <INPUT checked="checked" type="checkbox"></INPUT>
[R ]
Unknown macro: {html} <INPUT checked="checked" type="checkbox"></INPUT>
[Phi]
Other
These plots present different other datasets.
Unknown macro: {highlight}
- is intended for the "waveform" datasets, for exampleUnknown macro: {html} <INPUT checked="checked" type="checkbox"></INPUT>
[Waveform]
/Configure:0000/Run:0000/CalibCycle:0000/Acqiris::DataDescV1/AmoETOF.0:Acqiris.0/waveforms.
Unknown macro: {highlight}
- is intended for multi-parameter datasets, for exampleUnknown macro: {html} <INPUT checked="checked" type="checkbox"></INPUT>
[Correlations]
/Configure:0000/Run:0000/CalibCycle:0000/Ipimb::DataV1/CxiDg1.0:Ipimb.0/data (channel0, channel1, ...),
/Configure:0000/Run:0000/CalibCycle:0000/Ipimb::DataV1/CxiDg1.0:Ipimb.0/time (seconds, nanoseconds), etc.
The bottom part of the What to display GUI is intended to set parameters for particular plots trough the sub-GUIs, which can be switched by clicking on the tub bar buttons
Unknown macro: {highlight}
or selecting appropriate check boxes.
Unknown macro: {html} <INPUT mce_style="color:red" style="color: red;" type="button" value="CSpad"></INPUT> <INPUT mce_style="color:blue" style="color: blue;" type="button" value="Image"></INPUT> <INPUT mce_style="color:green" style="color: green;" type="button" value="Waveform"></INPUT> <INPUT mce_style="color:magenta" style="color: magenta;" type="button" value="Proj."></INPUT> <INPUT mce_style="color:black" style="color: black;" type="button" value="Corr."></INPUT>
CSpad, Image, Wave, Correlation GUIs
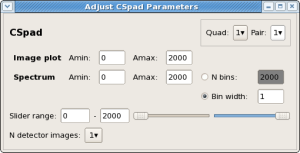

These sub-GUIs have more or less uniform layout of fields and buttons for monitoring and editing parameters as follows.
CSpad sub-GUI is intended to set parameters for the CSpad image and spectra plots. All CSpad plots presents only one dataset, checked in the HDF5 tree and item selection GUI. (It is unlikely that users will work with more than one CSpad detector simultaneously.)
Unknown macro: {highlight}
- sets the minimal and maximal amplitude for image and spectrum plots.Image plot / Spectrum Amin:
Unknown macro: {html} <INPUT align="middle" size="4" type="text" value="0"></INPUT>
Amax:
Unknown macro: {html} <INPUT align="middle" size="4" type="text" value="2000"></INPUT>
These amplitudes can be edited directly or set simultaneously by sliders. The slider range can also be adjusted by editing of two fields.
Unknown macro: {highlight} N detector images :
- sets the number of images (windows) for entire CSpad detector. Multiple images can be useful if it is necessary to zoom-in different parts of the detector simultaneously, is it is presented on zoomed-in CSpad images.
Two radio buttons
Unknown macro: {highlight}
Unknown macro: {html} <INPUT checked="checked" type="radio"></INPUT>
Bin width:
and
Unknown macro: {highlight}
Unknown macro: {html} <INPUT type="radio"></INPUT>
N bins:
- defines a primary value for the spectrum histogram, the number of bins or the bin width. The white field allows to adjust selected value, while the grey field shows the other value for monitoring purpose.
Unknown macro: {highlight}
- sets the quad number [0,3] and pair number [0,7] which are used in partial CSpad plots.
Quad:
Unknown macro: {html} <INPUT type="button" value="1?"></INPUT>
Pair:
Unknown macro: {html} <INPUT type="button" value="3?"></INPUT>
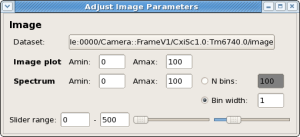
Image sub-GUI is intended to set parameters for camera images and associated spectra. It has about the same set of parameters as for CSpad.
The number of datasets with images may exceed one. By default all checked in the What to display GUI Camera datasets will be presented on plots separately. Otherwise the dataset name should be chosen from the fall-down menu in the field
Unknown macro: {highlight}
Dataset:
Unknown macro: {html} <INPUT size="30" type="button" value="All"></INPUT>
Waveform sub-GUI is intended to set parameters for the waveform images.
Unknown macro: {highlight} Number of windows :
- sets the number of windows for the waveform plots.
Each window (plot) presents the waveforms for a single dataset, selected by the field
Unknown macro: {highlight}
Dataset:
Unknown macro: {html} <INPUT size="30" type="button" value="Click here to select the dataset"></INPUT>
Each window (plot) may have up to four waveforms of different colors. Association of the waveform index and color can be done trough the buttons
Unknown macro: {highlight}
WF: Black
Unknown macro: {html} <INPUT type="button" value="0"></INPUT>
Red
Unknown macro: {html} <INPUT type="button" value="1"></INPUT>
Green
Unknown macro: {html} <INPUT type="button" value="3"></INPUT>
Blue
Unknown macro: {html} <INPUT type="button" value="None"></INPUT>
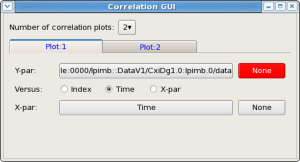
Correlation sub-GUI is intended to set parameters for the correlation images.
Unknown macro: {highlight} Number of correlation plots:
- sets the number of correlation plots (windows).
... - tab bar switches between parameter sets for different plots.
Radio buttons
Unknown macro: {highlight}
- switch between correlating parameter for X axis.
Unknown macro: {html} <INPUT checked="checked" type="radio"></INPUT>
Index
Unknown macro: {html} <INPUT type="radio"></INPUT>
Time
Unknown macro: {html} <INPUT type="radio"></INPUT>
X-par
Unknown macro: {highlight}
- set the dataset and parameter name for Y or X axis, respectively.
Y/X-par:
Unknown macro: {html} <INPUT type="button" value="dataset name"></INPUT><INPUT type="button" value="parameter name"></INPUT>
X, Y, R, and Phi projection sub-GUIs
The X, Y, R, and Phi projection sub-GUIs are intended to set parameters for image projection plots. Currently the same set of parameters is used for CSpad detector and camera images. (We assume that user will not need in projection plots for different detectors simultaneously.)
Projection sub-GUI, selected by the button
, has its own tab bar for four type of projection plots,
Unknown macro: {highlight}
Unknown macro: {html} <INPUT mce_style="color:red" style="color: red;" type="button" value="X"></INPUT> <INPUT mce_style="color:magenta" style="color: magenta;" type="button" value="Y"></INPUT> <INPUT mce_style="color:blue" style="color: blue;" type="button" value="R"></INPUT> <INPUT mce_style="color:green" style="color: green;" type="button" value="Phi"></INPUT>


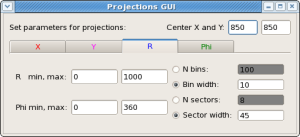

These sub-GUIs have uniform layout of fields and buttons for monitoring and editing parameters for the projection plots as follows. The list of parameters for each projection plot consists of minimum and maximum value of each dimension, the number of bins or bin width for histogram along the projected dimension, and the number of slices (or rings, or sectors) and their widths for other dimension. The number of plotted 1-D histograms is equal to the number of slices for X and Y (rings for Phi, or sectors for R) projections, respectively.
For R and Phi projections it is necessary to set a center of the polar coordinates in original Cortesian coordinate frame of the image array in pixels,
Unknown macro: {highlight}
Center X and Y
Unknown macro: {html} <INPUT size="3" type="text" value="200"></INPUT><INPUT size="3" type="text" value="300"></INPUT>
Configuration GUI
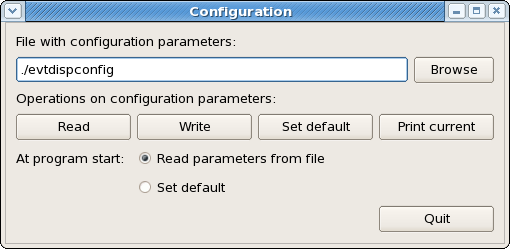
Configuration GUI manipulates with a set of configuration parameters.
- sets the file name for configuration parameters.
- reads configuration parameters from the file with indicated name and set them as current.
- writes current configuration parameters in the file with indicated name.
- set current configuration parameters to their default values.
- print current values of configuration parameters.
- close this GUI window, the same as
button in the top-right corner.
Two radio buttons
Unknown macro: {highlight}
and Unknown macro: {html} <INPUT checked="checked" type="radio"></INPUT>
Read parameters from file
Unknown macro: {highlight}
switch between pre-defined in file and default parameters at program start. If the file with configuration parameters does not exist, the default parameters are used automatically.
Unknown macro: {html} <INPUT type="radio"></INPUT>
Set defult
Selection GUI
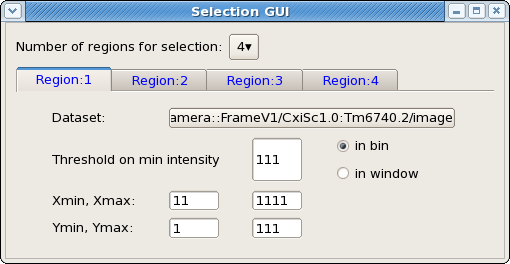
Selection GUI sets parameters for the event selection algorithm based on amplitude threshold in image region(s).
Unknown macro: {highlight} Number of regions for selection :
- sets the number of regions (boxes) for selection algorithm. If the number of regions more than one, events are selected by logical OR of all conditions.
... - tab bar switches between parameters of different regions.
Unknown macro: {highlight}
- selects the dataset with image. In case of CSpad an entire detector image is assumed.
Dataset :
Unknown macro: {html} <INPUT type="button" value="dataset name"></INPUT>
Unknown macro: {highlight}
- sets the threshold in ADC units.
Threshold on min intensity :
Unknown macro: {html} <INPUT size="3" type="text" value="value"></INPUT>
Two radio buttons
Unknown macro: {highlight}
and Unknown macro: {html} <INPUT checked="checked" type="radio"></INPUT>
in bin
Unknown macro: {highlight}
- switch between two methods of the threshold test condition.
Unknown macro: {html} <INPUT type="radio"></INPUT>
in window
Unknown macro: {highlight}
- sets the box range in image which is used to check the threshold condition.
X/Ymin, X/Ymax:
Unknown macro: {html} <INPUT size="3" type="text" value="0"></INPUT> <INPUT size="3" type="text" value="1000"></INPUT>
button in the top-right corner - close this GUI window.
Example of plots
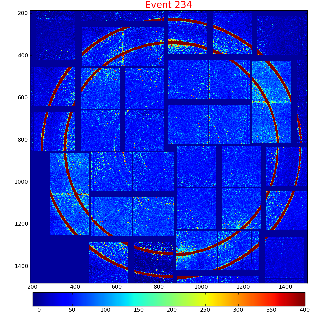
Image of the CSpad detector
Run 430: 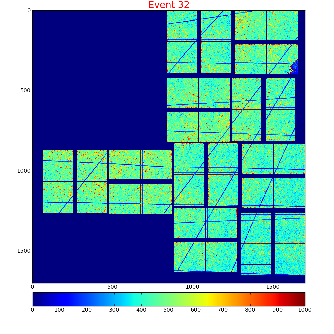 Run 587:
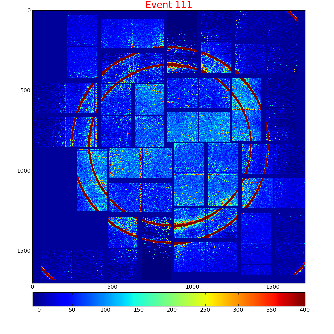
Plots can be turned on/off in What to display GUI.
Parameters for this plot can be set in CSpad sub-GUI.
Zoomed-in CSpad image with selection window and averaged image
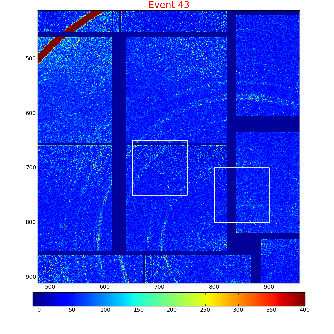

CSpad image can be dynamically zoomed-in. To get zoomed-in image one has to specify the window for zoomed region; click on mouse-left button in one corner of the desired region, hold it, move mouse to another corner, and release the mouse button. If you do this operation quite slow (before release button) the black dash-line rectangle will show up to indicate the selected region. Zoomed window parameters are saved for next events. Clicking on other mouse buttons in this window will restore the full-size CSpad image.
Zoomed images can be zoomed-in again using the same method.
White rectangles show the selection regions, which can be set in the Selection GUI.
The number of windows for these plots can be changed in the
CSpad sub-GUI by the
Unknown macro: {highlight} N detector images :
parameter.
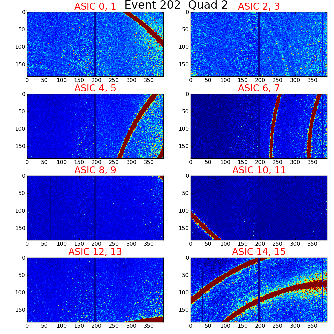
Image of the quad
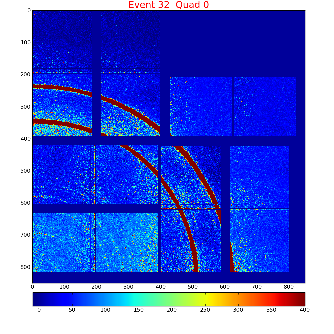
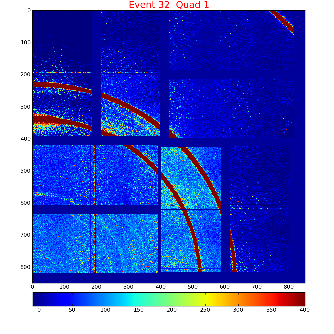
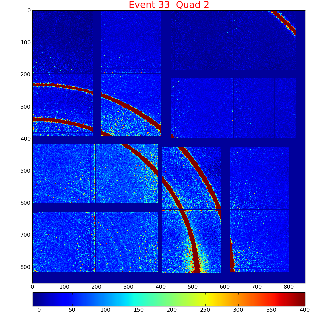
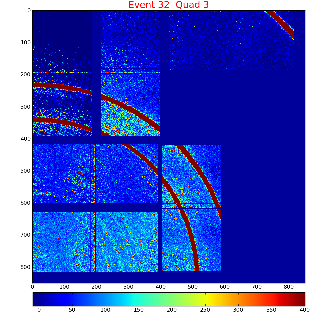
Plots can be turned on/off in What to display GUI.
Parameters for this plot can be set in CSpad sub-GUI.
Spectra of ASICs and 2x1 pairs, image and spectrum of pair
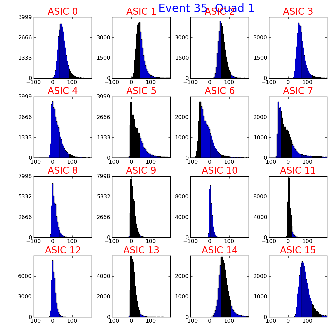
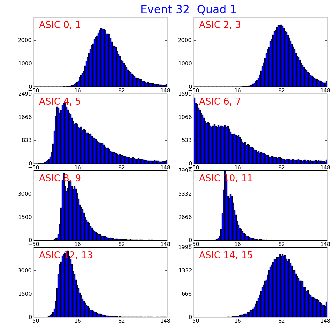
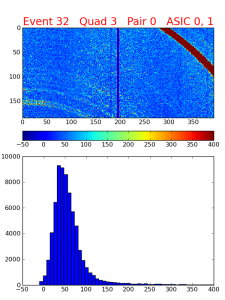
Plots can be turned on/off in What to display GUI.
Parameters for these plots can be set in CSpad sub-GUI.
CSpad 2x1 sensor Image and Spectrum plot can be dynamically adjusted by clicking left/right-mouse button on color bar in order to select min/maximal amplitude for image and spectrum. Clicking on central button restores original plot parameters.
X, Y, R, and Phi projections of CSpad


Plots can be turned on/off in What to display GUI.
Parameters for these plots can be set in X, Y, R, and Phi projection sub-GUIs.
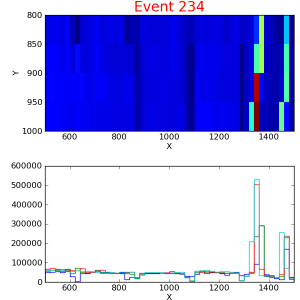
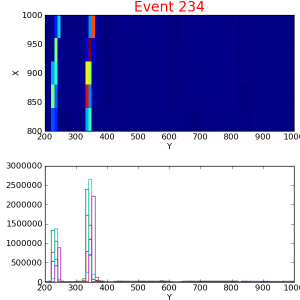
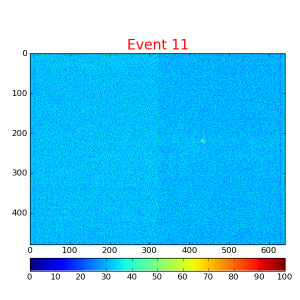
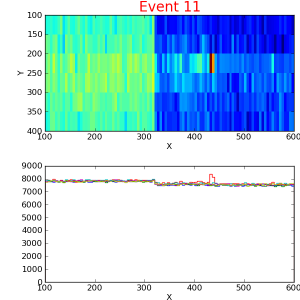
Plots for camera images
Entire camera image (white box shows the selection window), zoomed-in camera image, spectrum of amplitudes and combined plot for image and spectrum
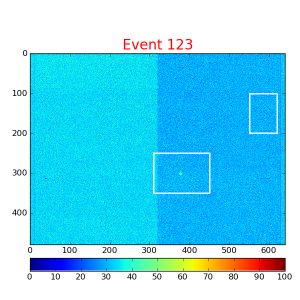

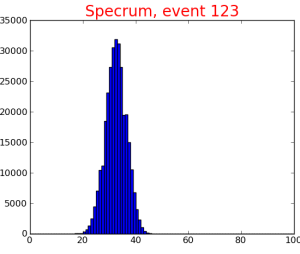
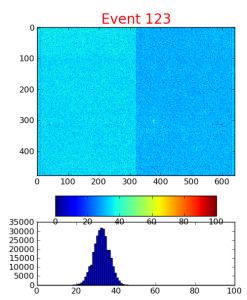
Plots can be turned on/off in What to display GUI.
Parameters for this plot can be set in Image sub-GUI.
White rectangles show the selection regions, which can be set in the Selection GUI.
Camera image can be dynamically zoomed-in (the same way like CSpad image). To get zoomed-in image one has to specify a window for zoomed region; click on mouse-left button in one corner of the desired region, hold it, move mouse to another corner, and release the button. If you do this operation quite slow (before release button) the black dash-line rectangle will show up to indicate the selected region. Zoomed window parameters are saved for next events. Clicking on other mouse buttons in this window will restore the full-size camera image.
Camera Image and Spectrum plot can be dynamically adjusted by clicking left/right-mouse button on color bar in order to select min/maximal amplitude for image and spectrum. Clicking on central button restores original plot parameters.
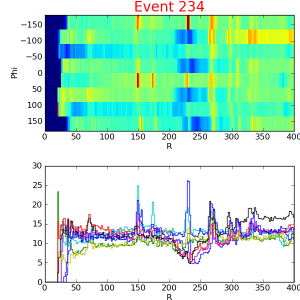
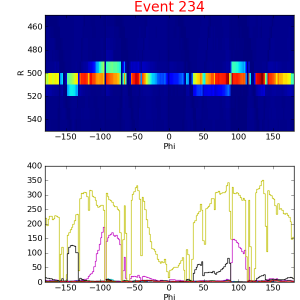
Camera image and X, Y, R, and Phi projections
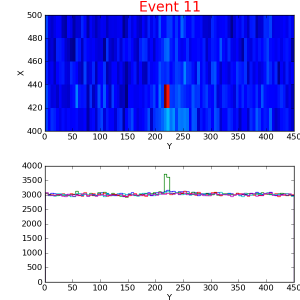


Plots can be turned on/off in What to display GUI.
Parameters for these plots can be set in X, Y, R, and Phi projection sub-GUIs.
Plots for waveforms
For auto and manual adjustment of the range parameters
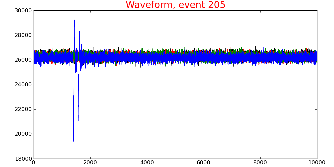
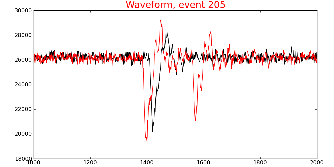
Plots can be turned on/off in What to display GUI.
Parameters for these plots can be set in Wavefom sub-GUI.
Correlation plots
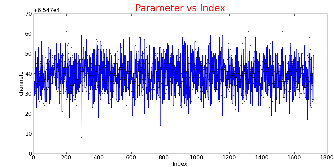
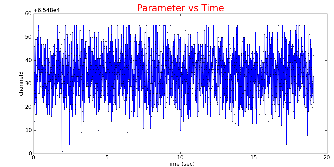
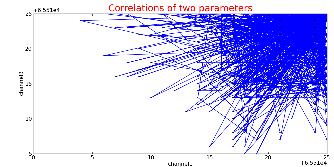
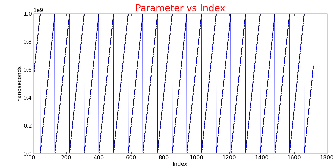
Plots can be turned on/off in What to display GUI.
Parameters for these plots can be set in Correlation sub-GUI.
Overview
Content Tools