...
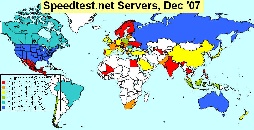
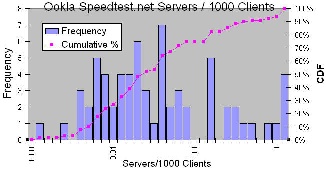
At the time of the data, Ookla speedtest.net had 193 servers in 68 countries. The most servers/country were US (54), Australia (7), Russia(6), Brazil, Canada, Romania (5). A map of the locations of the servers and the number of servers / country is seen below. Shown in the middle is the number of servers/country for countries that had clients. About 39% of the countries with clients also have one or more servers. On the right is a histogram (with logarithmic bin widths) of the Servers / 1000 clients for countries with servers. The leading countries with this metric are those with the smaller number of clients, e.g. Mali (6.8), Liechenstein(2.5), Maldives(1.5), Bahamas(0.95), Faroe Islands(0.77), Bermuda(0.49), Cyprus(0.33), Honduras(0.29), Qatar(0.26), Nicaragua(0.23).
Map of Ookla servers Servers | Ookla Servers/country with clients | Histogram of servers / country 1000 clients | |
|---|---|---|---|
| | | |


The data is also archived together with the location of the client. This is determined based on the client IP address. Speedtest.net uses GeoIP databases from MaxMind to position the client and by default locate the closest server since the transfer speed depends on the TCP window and TCP is not usually optimized for increased RTT. While the information in MaxMind's GeoIP databases is very accurate, it is not perfect. More information on Ookla's speed test can be found here.
Ookla then uses the 95th percentile speeds for the IP address of each client. This way if a connection speed improves over time (or a better testing server for the region is added), it will improve the overall results. The same can be said for degradation of speed. These 95th percentile speeds are then what are averaged to determine the speeds shown in their data set. The ip_addresses column is the number of unique IP addresses from a specific country that have taken a test at Speedtest.net. The file provided contained aggregated data with one line for each country. It included data from 174 countries. The columns contained: the Top Level Domain, the Country name, the number of IP addresses, the average donload speed in kbits/s, the average upload speed in kbits/s. The data for each country was from >= 100 IP addresses.
Results
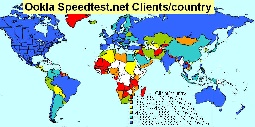
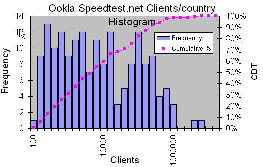
A rough summary of the results shows: The US has the most IP addresses (clients) = 5.7M, followed by the UK (2.5M), Canada(890K), Germany(84-K), Italy(835K), Australia(607K), Poland(556K), Mexico(481K), Russia(442K). A map of Clients/country is shown below. The lowest number of clients/country are French Polynesia(100), Greenland(102), Zambia(106), Burkina Faso(107), Haiti (108), Madagaskar(118), Northern Mariana Islands(121), Belize(130), Mali(146), Mauritania(149). A frequency histogram (with logarithmic bin widths) of clients/country is shown to the right. the relative flatness of the distribution (with logarithmic bins) indicates that the fall off in clients/country is exponential in nature.
Clients per country Map | Clients per country Histogram |
|---|---|
| |
|
Highest download speed is Japan=11Mbits/s, followed by Sweden, Latvia, Romania, Netherlands, Bulgaria, Singapore, Germany, France, US. Slowest download speed is Cameroon (199kbits/s) followed by Mauritius, Botswana, Angola, Madagascar, Nepal, French Polynesia, New Caledonia, Tanzania, Kenya (i.e. bottom 5 in Africa). Fastest upload is Japan (5.1Mbits/s) followed by Russia, Romania, Sweden, Bulgaria, Latvia, Hong Kong, Lithuania, S. Korea, Moldova. The large number of Eastern European countries is interesting and not understood. The slowest download speeds are Madagascar (70kbits/s), followed by Yemen, Angola, Cameroon, New Caledonia, Botswana, Uruguay, Nepal, Zambia, French Polynesia (276 kbits/s). 50% of the slowest 10 download speed countries are in Africa.The median upload speed (303kbis/s) is 1/3 of the median download speed. Currently the African representation by country is only 26 (out of I think 54). It will be interesting to see if this improves as more measurements are made.
A map of the Ookla dowmload download and upload throughputs measured for clients in the various countries of the world is shown below. The poor coverage for Sub-Saharan Africa (there was no data for countries in white) is seen as is the much better performance for developed regions such as N. America, Europe, Japan and Australaisia compared to developing regions. Also on the right we show a map of the ratios for upload/download.
...