...
If for some reason, the assumptions are violated, then we can simply use the Kolmogorov-Smirnov two-sample test.
For all the cases the null hypothesis is: there is no difference between icmp ping and tcp ping samples.
Below are few examples. Please see the download links at the bottom to for more examples.
| Code Block |
|---|
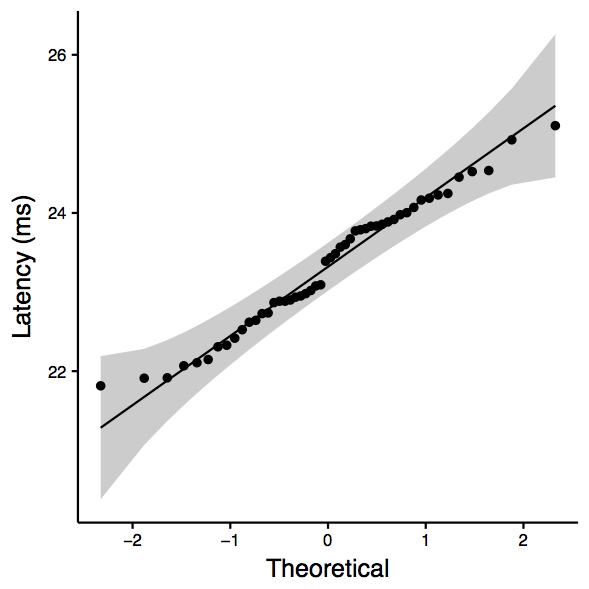
mit.edu: Two-sample Kolmogorov-Smirnov test data: sub_df$ping_avg and sub_df$nping_avg D = 0.28, p-value = 0.03968 alternative hypothesis: two-sided Shapiro-Wilk normality test data: sub_df$ping_avg W = 0.97335, p-value = 0.315 Shapiro-Wilk normality test data: sub_df$nping_avg W = 0.98432, p-value = 0.7418 [1] "ANOVA Summary" Df Sum Sq Mean Sq F value Pr(>F) tool 1 5.48 5.481 8.218 0.00508 ** Residuals 98 65.35 0.667 --- Signif. codes: 0 ‘***’ 0.001 ‘**’ 0.01 ‘*’ 0.05 ‘.’ 0.1 ‘ ’ 1 |
| mit.edu: qqplot for ping | mit.edu: qqplot for nping | mit.edu: boxplot | ||
|---|---|---|---|---|
 | view-file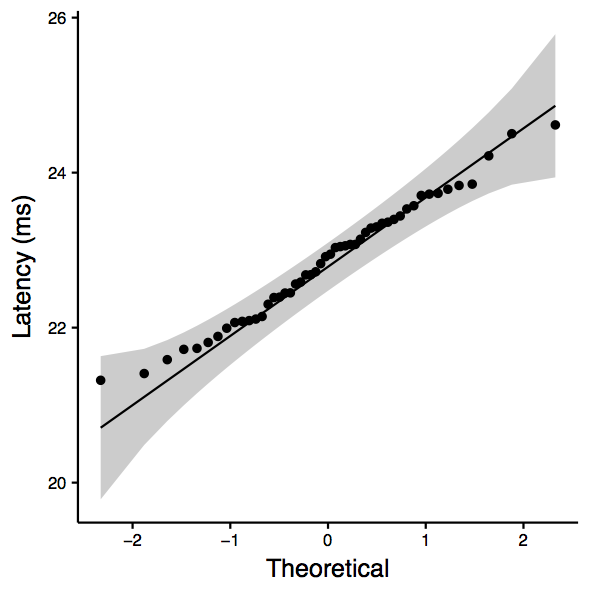 | |||
|
| |||
| View file | ||||
| name | 2018-03-02-slac-v4-uk-mit.edu-boxplot.pdf | height | 250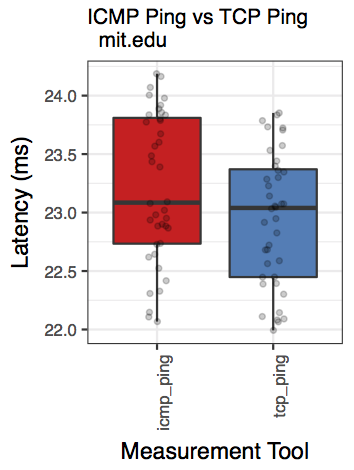 |
Observation: KS test tells us that we cannot reject the null hypothesis (that they are the same). Note that the p-value is marginal (i.e., close to 0.05).
| Code Block |
|---|
www.globalone.com.br: Two-sample Kolmogorov-Smirnov test data: sub_df$ping_avg and sub_df$nping_avg D = 0.68, p-value = 2.668e-11 alternative hypothesis: two-sided Shapiro-Wilk normality test data: sub_df$ping_avg W = 0.84507, p-value = 1.141e-05 Shapiro-Wilk normality test data: sub_df$nping_avg W = 0.96575, p-value = 0.1547 [1] "ANOVA Summary" Df Sum Sq Mean Sq F value Pr(>F) tool 1 547.9 547.9 71.71 2.52e-13 *** Residuals 98 748.8 7.6 --- Signif. codes: 0 ‘***’ 0.001 ‘**’ 0.01 ‘*’ 0.05 ‘.’ 0.1 ‘ ’ 1 |
| mit.eduwww.globalone.com.br: qqplot for pingmit.edu | www.globalone.com.br: qqplot for nping | mit.eduwww.globalone.com.br: boxplot | ||
|---|---|---|---|---|
view-file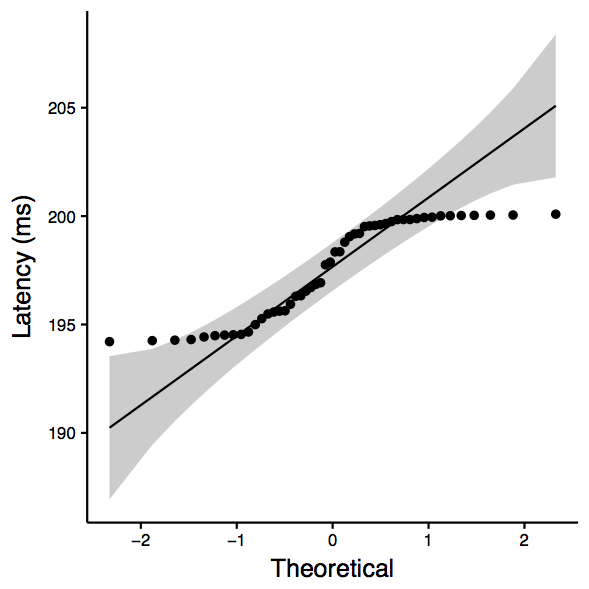 | ||||
|
| |||
| View file | ||||
| name | 2018-03-02-slac-v4-uk-mit.edu-boxplot.pdf | height | 250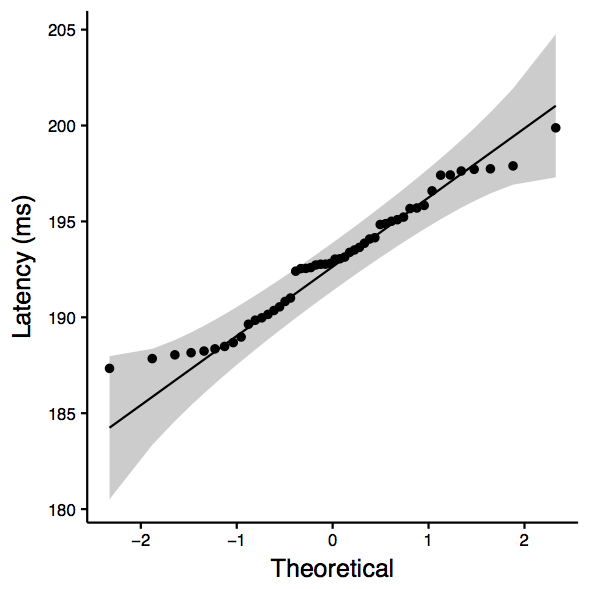 | 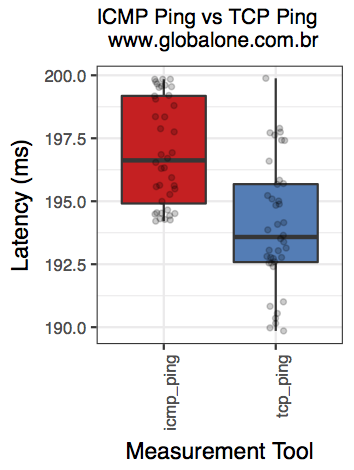 |
Observation: KS test tells is that we can reject the null hypothesis (that there is not enough evidence to confim that they are the same.)
Analysis script
Once the logs from Les' script are available, they may be passed onto the analyze.r script for processing and generating output. I am attaching an example of processed output here.
...