Page History
...
/reg/d/psdm/cxi/cxi06216/scratch/<username>/psocake/r0022/mask.txt (2D text)
You can load the user-defined mask using the "Load user-defined mask" button and selecting mask.npy.
Peak finding
...
To find the Bragg peaks on the detector, set the "Algorithm" to "Droplet".
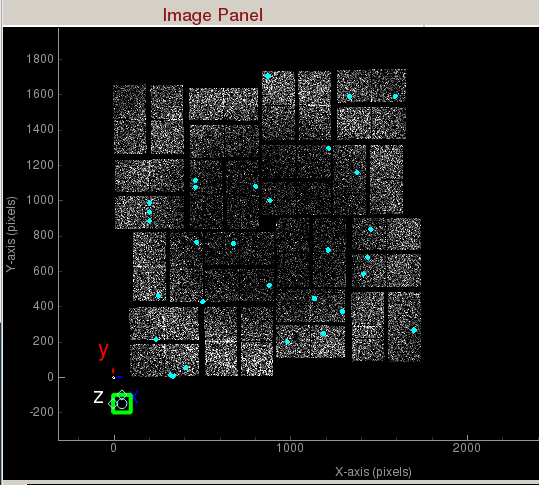
Examine the peak found by zooming in with the middle mouse scroll (or a two finger slide on a Mac touchpad). Notice that the Bragg peaks are composed of 2 to 5 connected pixels. Setting the radius to 2 sets a 5x5 cyan boundary around the Bragg peaks.
- Set npix_min: 2
- Set npix_max: 5
- radius: 2
Hover the mouse pointer over the Bragg peaks to study the intensities. Notice that the weaker pixel intensities inside a Bragg peak is around 80 ADUs. The sum of the Bragg peak pixels are above 400 ADUs.
- Set amax_thr: 80
- Set atot_thr: 400
Move the green square over the water ring to study the level of background noise on the ROI Histogram panel. Notice that the water ring intensities go up to around 160 ADUs. Signal seems to be around 4 times stronger than the noise.
- thr_low: 160
- thr_high: 160
- son_min: 4
You can jump to other events to see if your peak parameters are well tuned. Once you are happy, launch the peak finder job on our cluster.
The output directory on the peak finder panel should already be automatically set to: /reg/d/psdm/cxi/cxi06216/scratch/<username>/psocake
Since we are analyzing run 22, /r0022 directory will be generated under the output directory.
The current setting will analyze run 22 on psanaq with 24 CPUs. Number of events to process set to 0 analyzes all the events. Click "Launch peak finder".
The CXIDB filename being generated is: cxi06216_0022.cxi
Looking at peaks found
Once you have launched the peak finder job, let's look at the images that have Bragg peaks.
In the small data panel, type the CXIDB filename:
- filename: /reg/d/psdm/cxi/cxi06216/scratch/<username>/psocake/r0022/cxi06216_0022.cxi
- metric_dataset: /entry_1/result_1/nPeaksAll
This should load a plot of all the peaks found so far for each event. Click "Refresh" to update the plot.
You can click on the red plot marker to display the corresponding image. These lysozyme diffraction patterns have between 15 to 60 peaks.
Indexing
Psocake Layout
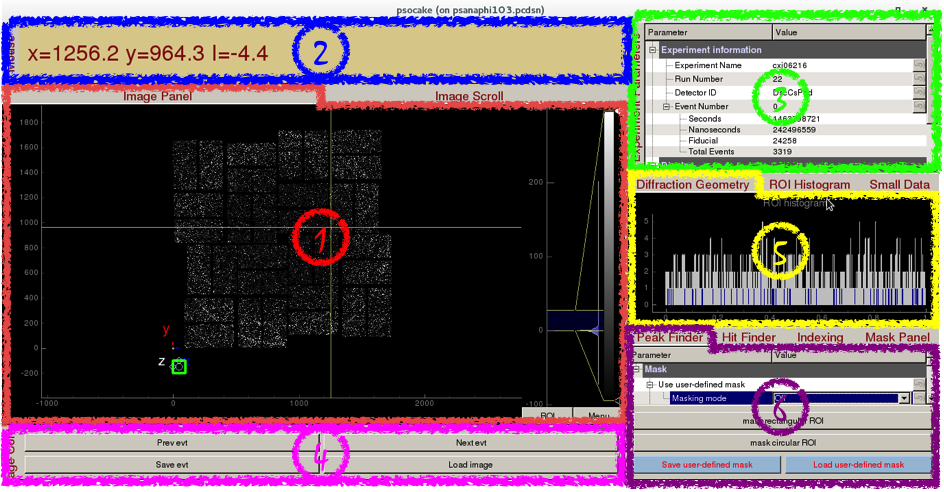
- Image Panel / Image Scroll
- Mouse Panel
- Experiment Parameters
- Image Control
- Diffraction Geometry / ROI Histogram / Small Data
- Peak Finder / Hit Finder / Indexing / Mask Panel
...
Overview
Content Tools