Content

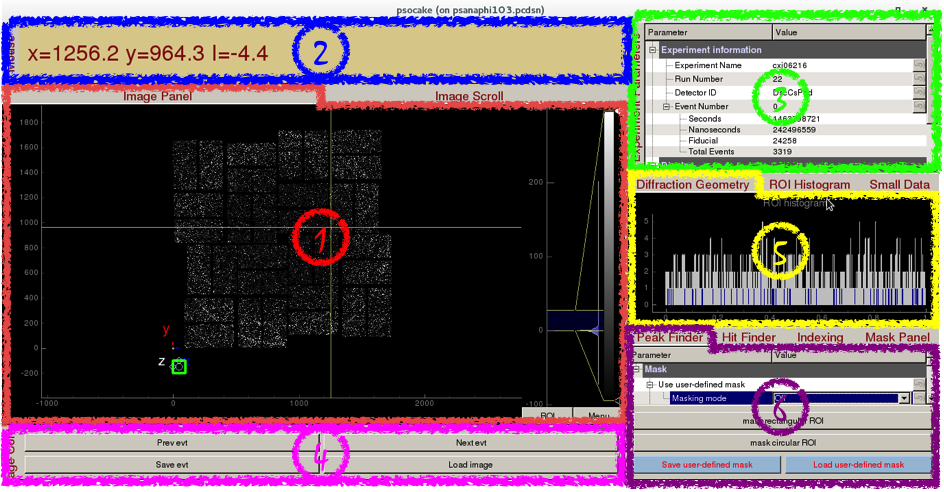
Psocake Layout


  1. Image Panel / Image Scroll
  2. Mouse Panel
  3. Experiment Parameters
  4. Image Control
  5. Diffraction Geometry / ROI Histogram / Small Data
  6. Peak Finder / Hit Finder / Indexing / Mask Panel


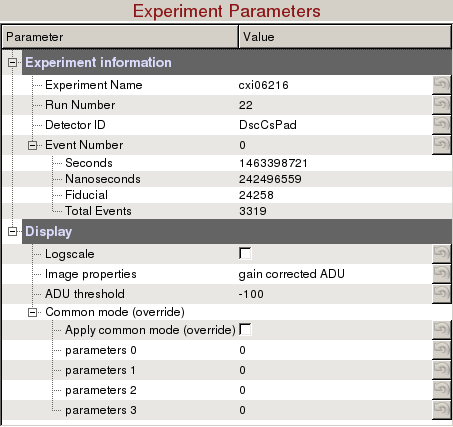
  1. Experiment Parameters

    Experiment information requires 4 fields to uniquely identify a detector image:

    Display
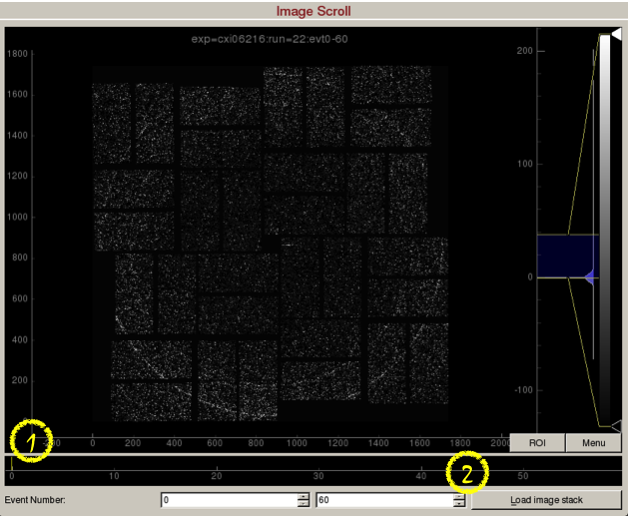
  2. Image Panel / Image Scroll

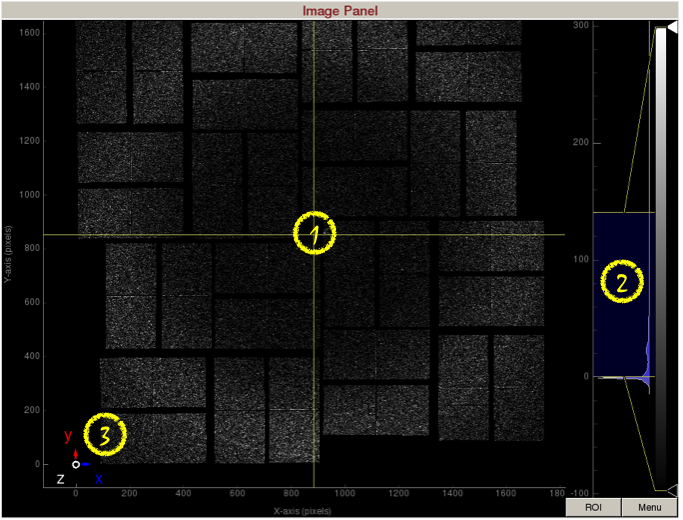
    Image panel displays the detector image.
    1) Display area shows the assembled detector image. This area can be panned by dragging with the mouse, and zoomed in/out using the middle mouse wheel.
    2) Intensity histogram can be used to adjust image contrast. The intensity histogram can be zoomed in/out using the middle mouse wheel. The blue shaded area selects the region of the intensity histogram to display on screen. You can drag the blue shaded area up/down to change the maximum/minimum display values. You can also drag the two yellow horizontal bars up/down to change the maximum/minimum display values. The white and black triangles can be dragged up/down to change the mapping between pixel value and display color.
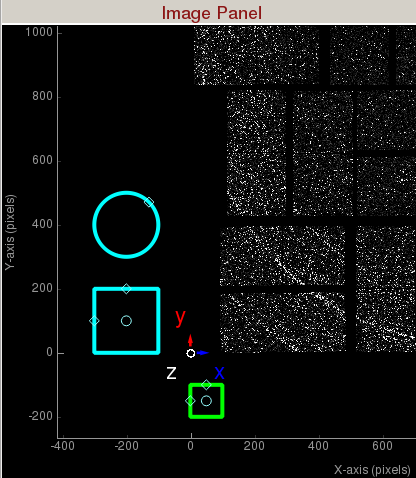
    3) Coordinate marker shows the lab coordinates of the detector. Z-axis is coming out of the screen.

    Image scroll is used for viewing a stack of images.
    1) Scroll bar to set the event on display. Alternatively, press the spacebar to play/stop the movie. 
    2) "Load image stack" button will load 60 frames starting from event number 0. These values are adjustable.

  3. Mouse Panel


    Mouse panel displays the pixel x-coordinates, y-coordinates, and intensity.
    It will also display "Masking Mode", if masking mode is turned on.

  4. Image Control


    Image control has 4 buttons.
    Prev/Next evt: Click to goto previous/next event.
    Save evt/Load image: Click to save/load a Numpy image of the detector.

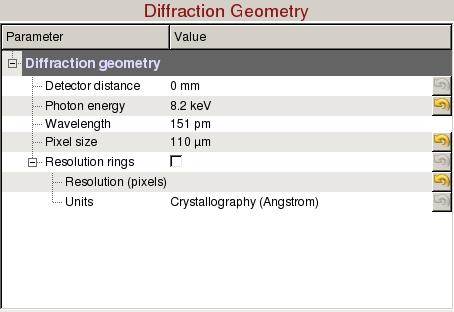
  5. Diffraction Geometry


    Diffraction Geometry can be used to optimize the detector distance and draw resolution rings:
  6. ROI Histogram


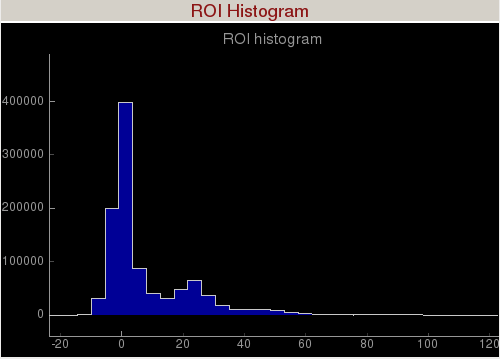
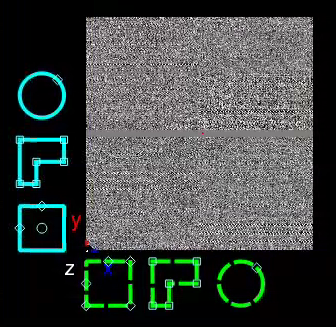
    Region of Interest (ROI) Histogram panel histograms the pixel intensities inside the green square (shown in the figure below), green polygon, and green circle. The green ROI can be moved around (by clicking inside the ROI and dragging) to study the intensity distribution of a region of interest. You can zoom in/out of the plot using the mouse scroll or a two-finger slide up/down on a Mac track pad. You can reset the plot by clicking on "A" at the lower left corner of the plot. The diamond handles on the green ROI can be dragged to resize the ROI. The green square will display the ROI in assembled and unassembled shapes in your terminal. The green circle will display the centre position of the ROI in your terminal. You can add extra vertices in the green polygon by right clicking on an edge. (Left click on a vertex to remove it.)


    The green square is the region of interest for intensity histogramming. Note the cyan circle , cyan polygon, and cyan square are for mask generation.
  7. Small Data


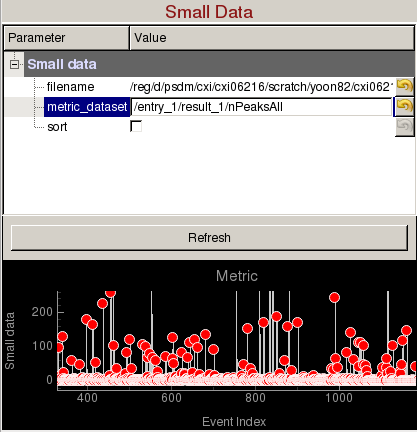
    Small Data panel can be used to plot a metric vs event number and display images from specific events of interest:
    • filename: Name of an hdf5 file (cxidb or NeXus files are OK).
    • metric_dataset: Dataset inside the hdf5 file containing the small data. It is recommended that the small data is recorded for all events in the run. If not, then the hdf5 file needs to contain /event dataset to identify which events were recorded (e.g. If /entry_1/results_1/smallData is the dataset containing  /entry_1/results_1/event is an array of event numbers with the same length).
    • sort: Ascending sort of the small data. You can still click on the red markers to display the corresponding image.
    Metric plots event number vs small data. Click on a red marker to display the corresponding image. You can zoom in/out using the mouse scroll or a two-finger slide up/down on a Mac track pad. You can reset the plot by clicking on "A" at the lower left corner of the plot.
  8. Peak Finder


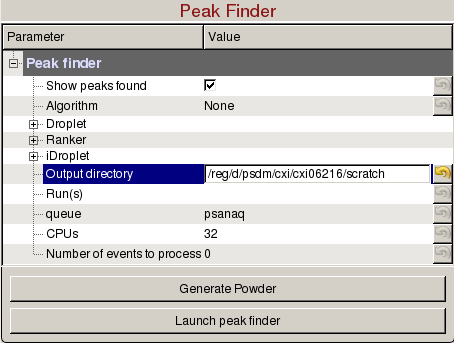
    Peak Finder panel is used to tune peak finding parameters for detector images with peaks, generate powder patterns, and launch peak finding jobs on the computing cluster:
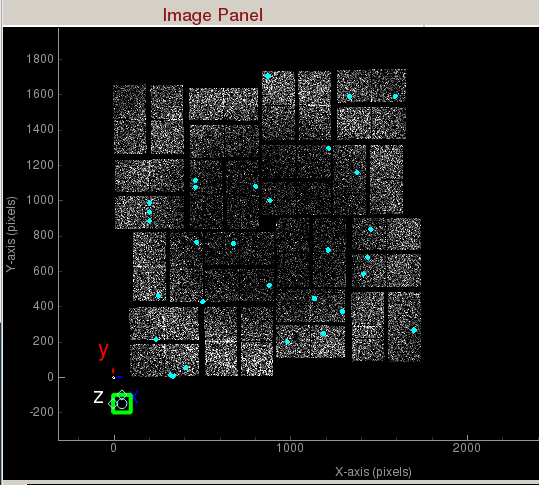

    Peaks found are shown in cyan.

  9. Hit Finder


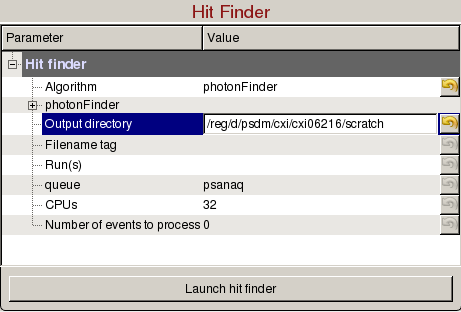
    Hit Finder panel is used to tune hit finding parameters for detector images without peaks, and launch hit finding jobs on the computing cluster:
  10. Indexing


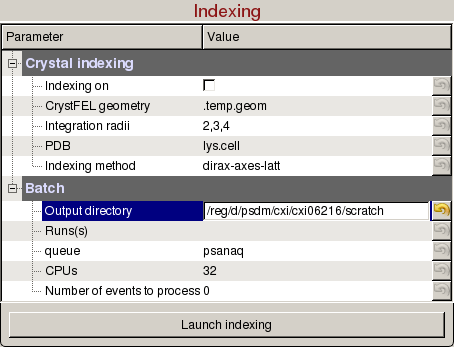
    Indexing panel is used to tune indexing parameters for crystal diffraction patterns, and launch indexing jobs on the computing cluster:
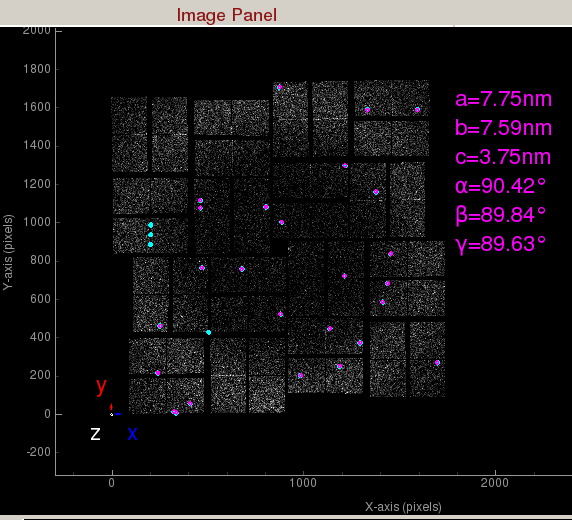
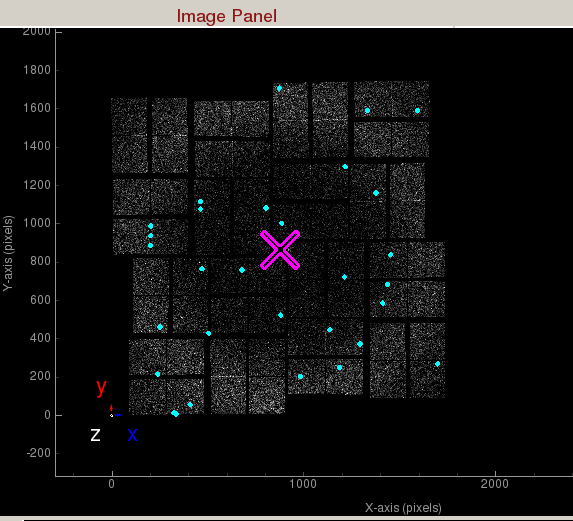
    Indexed peaks are shown in magenta. Peaks found are shown in cyan. Each indexed peak are represented by the integration rings. The unit cell parameters are displayed on the side. A failed indexing result will be displayed as a big X.
  11. Mask Panel


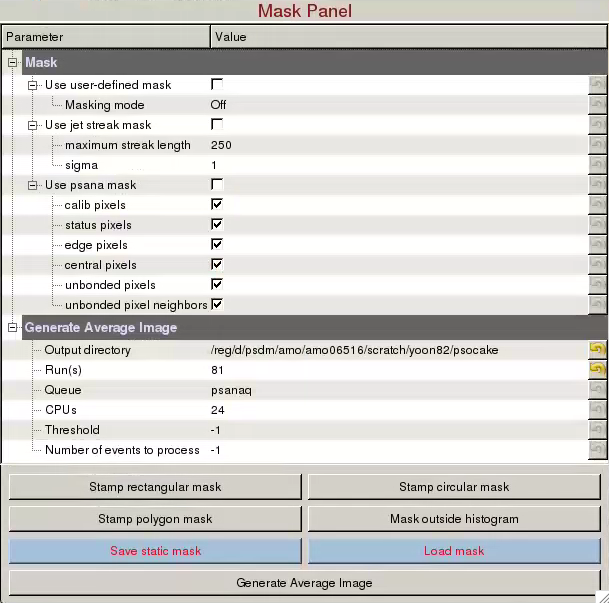
    Mask Panel is used to generate masks on the assembled detector:

    Generate Average Image is used to generate average (mean,max,std,sum) images of the run:
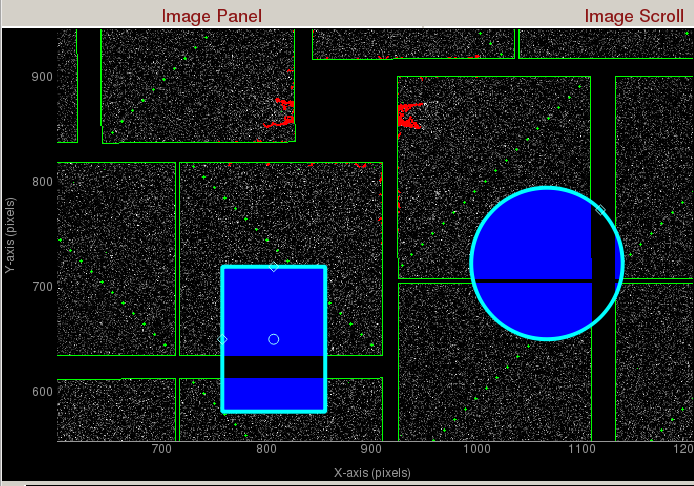


    Zoomed in display of a CsPad detector. User-defined masks are shown as blue. Jet streaks are shown as red. Psana mask is shown as green.