...
The SLAC End Station A Test Beam (ESTB) was re-establishing in 2014 to take small fraction of SLAC LCLS beams into End Station test beam line. The operation is largely parasitic to the LCLS operations with electron beams in the 5-13 GeV range depending on the LCLS operation energy. From the FACET/ESTB portal, you can navigate to info on proposals, new user registrations etc. ESTB beam schedule mostly just follow the LCLS Run schedule (which may be not always up to date). The CALADIUM EUDET telescope owned by Carleton University has been installed at the end of ESTB as a precision tracking telescope with 6 planes of CMOS/MIMOSA sensors (1152x576 18.4x18.4um pixels) with ~3 micron spatial resolution. User Device Under Test (DUT) can be mounted on a movable stage in the middle of the telescope. For ATLAS pixel test beam users, a HSIO2/RCE based DUT readout will be provided as a standard readout utility.
...
The list of sessions below may be incomplete (welcome to add missing sessions). Links behind each session dates below navigates to activities on individual sessions. In case of confluence wiki access issue in either viewing or editing the Event log page yourself, if only needs a trivial registration to gain access.
Latest Run 17 LCLS/ESTB (2018 Fall schedule)
- Dec/13-18/2018: T578 HGTD
- Dec/10-12/2018: T539 sharing T-577 period. [Event log]
- Nov/2-7/2018: T539 + T545 ITk Pixel. [Event log]
- Oct/3-7/2018: T578 HGTD
- May/30-Jun/5/2018 T545 + T539: Joint ITk pixel session with first RD53A module (+T578 parasitic). [Event log]
- Apr/5-9/2018 T578: UCSC HGTD run with first ESTB beam after kicker magnet upgrade. [Event log] [Report]
- Sep/26-Oct/4/2016 T-545 + T-539: Joint ITk pixel session for new ITk devices and some additional irradiated IBL FE-I4 module runs. Event log
- May/30-Jun/5/2018 T545 + T539: Joint ITk pixel session with first RD53A module. Event log Apr/5-9/2018 T578: UCSC HGTD run with first ESTB beam after kicker magnet upgrade. [Event log] [Report]
- Sep/26-Oct/4/2016 T-545 + T-539: Joint ITk pixel session for new ITk devices and some additional irradiated IBL FE-I4 module runs. Event log
- Jul/7-19/2016 T-539 + T-545: Combined ITk pixel session and continued irradiated FE-I4 module tests. Event log
- May/05-10/2016 T-539: Data with irradiated IBL FE-I4 modules for simulation model. Event log
- Jan/12-25/2016 T-534: Recommissioning of CALADIUM telescope and ATLAS DUT readout.
- Oct/2015 Caladium installation: 151030_caladium_at_slac_report.pdf, 151030_caladium_pictures.pdf
- May/01-15/2014 T-516: Various ATLAS ITk pixel upgrade samples.
...
An example of EUDET+DUT setup as of 2016 is shown below when running EUDAQ-1.5. The upgrade in May/2018 to EUDAQ-1.7 has changed the TLU-NI USB connection for the TLUProducer to TLU-DUTserver. There are variations of DUT readout e.g. RD53 test readout for two session in 2016 and 2018 used YARR in place of the HSIO2+SunServer combination for DUT readout.
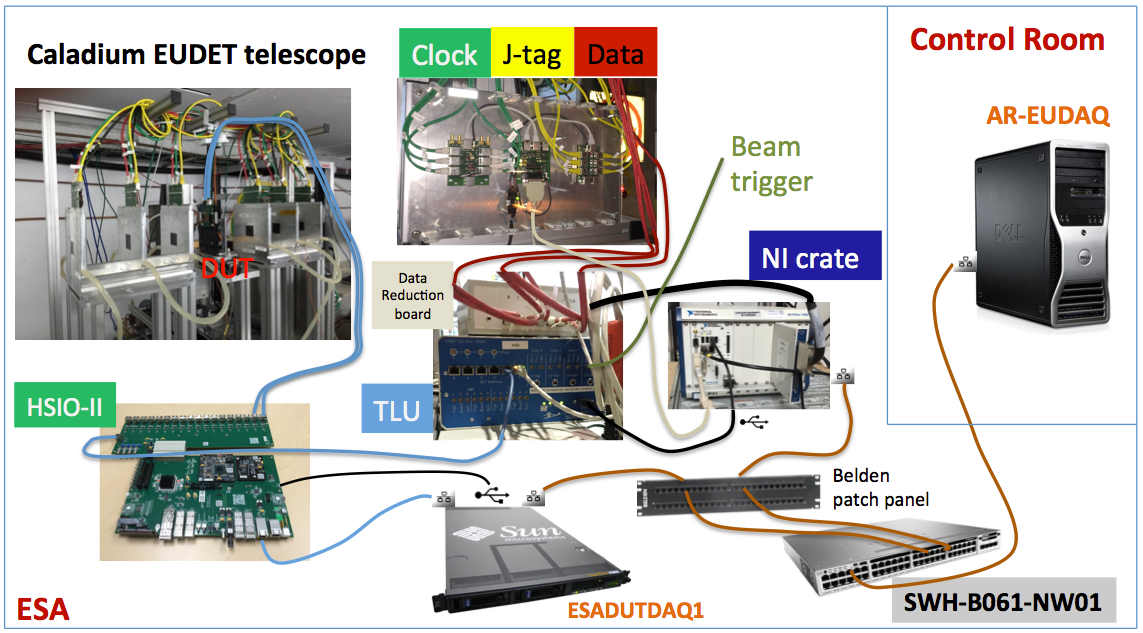
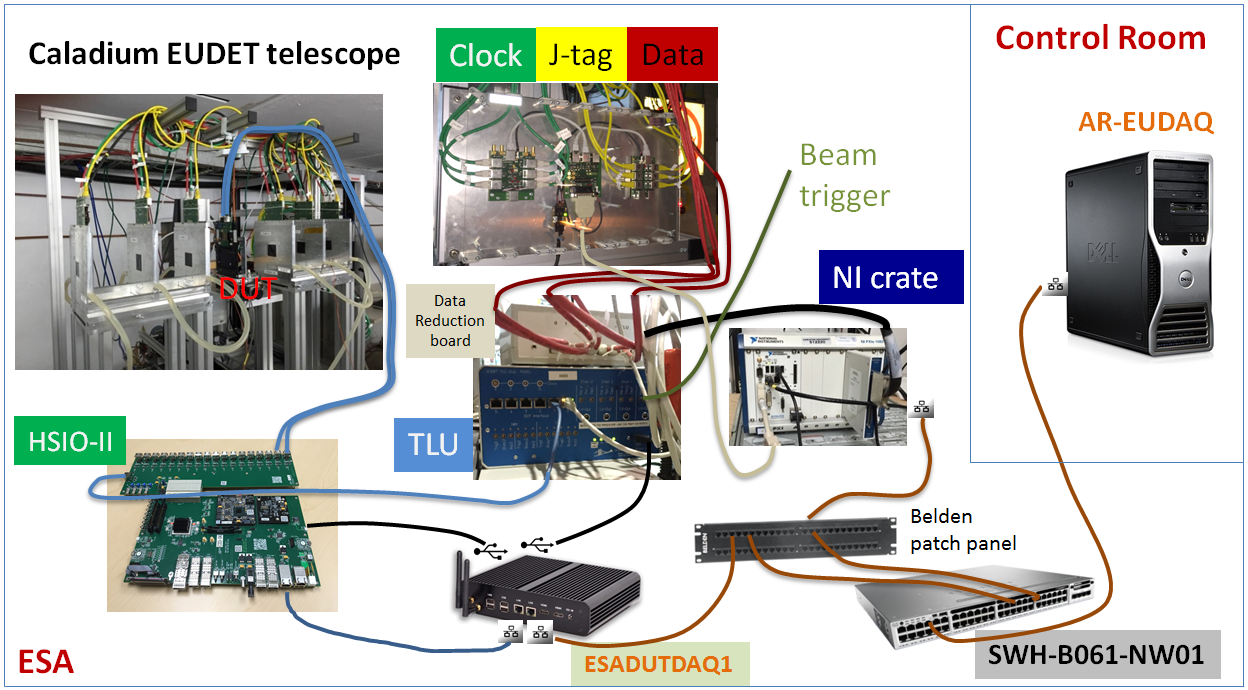
The Caladium telescope control and DAQ is handled by the National Instrument (NI) crate which collects data via the TLU with data producers from the telescope itself and the DUT. The DUT readout is upgraded to has a simpler baseline arrangement with just the HSIO-II controlled by the ESADUTDAQ1 server node via a direct private ethernet link. Due to the very short ESTB bunches, there is no need for additional triggers within the bunch and the DAQ is simply driven by the bunch crossing beam trigger. The SWH-B061-NW01 network switch in the middle of the ESA hall support the ESA-RESTRICTED local network 172.27.104.* (port 25-48) where both the NI crate and ESADUTDAQ1 reside on. The EUDAQ console PC AR-EUDAQ in the ESA Control Room and several other nodes e.g. AR-ESAUX2 are connected to the ESATESTFAC public subnet 172.27.100.* (port 1-24) on the same switch, but can also see the local ESA-RESTRICTED subnet. The connection from the NI crate and ESADUTDAQ1 to the switch are routed through the Belgen patch panel inside the tunnel near the optical table.
The current version of EUDAQ on the DESY/CERN telescopes is 1.7 so we have updated the version at SLAC in May 2018.
...
...
Telescope operation (EUDAQ v1.7)
...
- Start chiller: 18 Celsius
- Switch on power supply: 8V constant --> check 2.0 A
- Switch on NI crate and TLU

1. Start sensors

- Remote access to NI crate:
-- Open Terminal
-- source access_NI_crate.sh
-- Login: telescope PWD: telescope+

- Start MI26.exe (upper icon on the NI crate Desktop)
-- Open .mcf threshold file, typically 6 (CALADIUM config files are in C:\opt\mimosas\config_files)
-- Press "Reset" --> 2.0 Amps
-- Press "All" --> 2.8 Amps
-- Press "Read" --> 2.8 Amps
-- Press "Start" --> check 3.6 Amps

2. Open Labview FPGA interface on NI crate, if not already open
- Double click MimosaDAQ (second upper icon on the Desktop)

3. Start EUDAQ on AR-EUDAQ:

- Open a second Terminal (login
-as cd /opt/install/eudaq/eudaq-1.7 (need to make a shortcut -BPN 6/1/2018)tfuser with default dir /home/tfuser/)
- cd eudaq
- source setup_eudaq.sh
- ./STARTRUN
- wait approx. 20 sec. until all Connections ping (unitializeduninitialized)

4. OpenStart TLUproducer on TLUproduceresadutdaq1 computer.  N.B. this is currently the YARR computer but we need to change this when the YARR folks are not at SLAC! (-BPN 6/1/2018)
- (if not done already: ssh -Y pixel@172.27.104.52; there is an ssh key so no password should be needed. pwd is: testbeam if sshkey fails)
- cd /local/pixel/eudaq/eudaq-1.7/bin
- ./TLUProducer.exe -r 172.27.100.8:44000
- (if not done already: start a terminal on ar-eudaq and ssh -Y beam@esadutdaq1 (ask Su Dong or others for password)
- cd eudaq/bin
- ./TLUProducer.exe -r ar-eudaq:44000
--> check in eudaq Run Control, that Produce TLU is connected

5. Start DUT data producer(s) if not running telescope by itself.
   - For standard RCE based DUT readout, starting from an ar-eudaq console terminal
       ssh -Y esadutdaq1 -l beam   [pw=TestBeamUser]
       cd ~/daq/rce
       source ./scripts/setup-env.sh
rceOfflineProducer -r 0 -i 192.168.1.1 -d ar-eudaq --> check in eudaq Run Control, that Produce TLU is connected
5. Start DUT data producer(s) if not running telescope by itself.
- For standard RCE based DUT readout, this should be just starting rceOfflineProducer on esadutdaq1.
   - For YARR based readout (for beam rigger runs), login
 to pixel@172.27.104.52 as in  the TLUProducerssh case,-XY thenpixel@esadutlbnl1 (pw=Testbeam)
       cd YarrEudaqProducer
     bin/YarrProducer -h configs/controller/specCfgExtTrigger.json -c configs/connectivity/example_rd53a_setup.json -s configs/scans/rd53a/std_exttrigger.json -r 172.20.100.8/start_1.sh
6. Configure EUDAQ in eudaq Run Control
- select init file (canshould just use the default example) and init; then select Config file
  (Caladium only exercise config: no-beam: ni_autotrig;
   beam: ni_coins, June test beam 2018, ni_coins_YARR)
- Press Config
- wait till all Connections are green (OK)

7. Start Run
- Press Start (wait till all green)
--> check, that Trigger and Event Built numbers are increasing
--> check OnlineMonitor, and reset (upper left x-button)

8. Stop
- Re-configure (5.) and Re-Run (6.)
OR
- Terminate and press "Reset" in MI26.exe at NI crate to stop sensors --> check 2.0 Amps
EUDAQ Online Framework
The EUDAQ software operation involves 3 types of main entities:
Telescope operation (EUDAQ v1.5)
0. In ESA:
...
| Entity | Location | Node name | IP | OPS | Processes |
|---|---|---|---|---|---|
| Run Control PC | Control room | ar-eudaq | 172.27.100.8 | RHEL 6 | euRun,LogCollector,DataCollector,NIProducer,OnlineMonitor |
| NI Crate | Caladium Rack | ni-eudaq | 172.27.104.9 | Win 7 | EUDAQ, MimosaDAQ, LV FPGA |
| DUT/RCE | Caladium Rack | esadutdaq1 | 172.27.104.45 | Centos 7 | TLUProducer, rceOfflineProducer |
| DUT/YARR | near Caladium | esadutlbnl1 | 172.27.104.52 | SLC 6 | YarrProducer |
Typically, there is only one type of DUT server in operation at any time and that DUT server is also serving the TLUProducer (new arrangement as of Jun/2018).
The operation directory structure on ar-eudaq: user always login as tfuser for EUDAQ operation.
- EUDAQ release and operation base: /opt/install/eudaq/eudaq-1.7
- EUDAQ configuration: /opt/install/eudaq/eudaq-1.7/conf
- Raw data directory: /opt/install/eudaq/eudaq-1.7/data/run***.rawdata
- Online monitoring histograms: /opt/install/eudaq/eudaq-1.7/bin/run*.root (needs manual save to store)
- Online monitoring archive: /home/tfuser/Desktop/yyyymon_onlinemon/ (recommend to copy online mon history root files here)
Pixel DUT RCE Readout
While the DUT readout can be of variety of ways, the RCE readout setup is provided for at least ATLAS pixel users as a standard utility. As of July/2018, the DUT RCE readout is upgrading to HSIO-II setup with EUDAQ-1.7, with the dedicated ESADUTDAQ1 server also upgraded to a fanless Kingdel PC residing the beam tunnel in the EUDET rack next to the NI crate as the DUT RCE readout host. HSIO-II has the DTM mezzanine with the Gen-3 ZYNQ based RCE operating Centos-7 on the ARMS CPU that communicates with external world via its native 1Gb/s Ethernet. More general information on HSIO-II/RCE can be found on the RCE Development Lab Twiki. If the RCE readout setup with HSIO-II is dissembled and reinstalled, it is important to remember two important grounding connections to ensure LVDS communications have proper DC reference levels:
- For HSIO2-module communication: Ground wire between HSIO2 LV supply Molex pigtail and pixel module LV PSU ground
- For HSIO2-TLU communication: Lemo cable between TLU trig0 TTL and any of the HSIO2 main board LEMO bank socket
If you are not running the system from the ESA console next to the EUDET, but from some public nodes at SLAC, you need to first hop onto an ESA public machine on the 172.27.100 subnet and login as yourself e.g.
ssh -Y ar-esaux2 At least calibration actions will need X window displays so that the -Y qualifier through out is necessary. Then continue to hop onto the DUT readout node as dedicated user beam:
  ssh -Y esadutdaq1 -l beam     [pw=TestBeamUser]
  cd ~/daq/rce
  source ./scripts/setup-env.sh
For normal EUDAQ data taking, you need to start and announcing RCE DAQ as a data producer to EUDAQ run control node ar-eudaq with just one command:
rceOfflineProducer -r 0 -i 192.168.1.1 -d ar-eudaq If everything is run smoothly, once you brought up the overall DAQ with EUDET through EUDAQ run control node ar-eudaq, you should see the RCE data producer show up in the producer list.
Pixel Calibrations
Before taking an serious beam runs, it is advisable check the modules through calibration. Some sensors are known to need different threshold tunes at different temperatures, so that some calibration runs are expected to be a frequent activity between beam runs. The HSIO reboot will automatically bring up the calibserver on the RCE side to be always ready for it. If you suspect the calibserver ran into trouble or something messed on the RCE, doing a rebootHSIO may be the simplest way to recover. After the regular login process to ESADUTDAQ1, you can launch calibration GUI from ~/daq/rce after executing the ./scripts/setup-gen3.sh once for the session:
calibGui The operations steps of calibrations are explained briefly in the RCE pixel calibration instruction Twiki , while the functionality details of the calibrations are described in the ATLAS pixel calibration manual. The most commonly used are DIGITAL_TEST and THRESHOLD_SCAN. The new Gen-3 HSIO-II based readout uses a simplified process communication scheme which limits the calibration to one instance of calibserver on RCE and one instance of calibGUI on UNIX host ESADUTDAQ1. It will reject duplicate starters and issue an error message. In case you wanted to run caliGUI from the ESA pit but another session is open in the counting house with noone attending, you can just kill it after checking the process list with ps. The default calibration repository is under /home/tbslac/pixelrce/rce/moduleconfigs/.
In case you want to debug some calibration related problems that can benefit e.g. looking at the calibserver console printout, you can logon to the rce from an esadutdaq1 window:
    ssh root@rce0    (pw=root)
    rce> export PATH=/root/pixelrce/bin:$PATH; export LD_LIBRARY_PATH=/root/pixelrce/lib:$LD_LIBRARY_PATH
    rce> calibserver
DUT DAQ Configuration
The DUT integration is controlled through setup of EUDAQ configuration files with names like ni_coins.cfg etc. residing in /home/tfuser/eudaq/conf folder (also Desktop folder) on the EUDAQ console node ar-eudaq. The data logging also goes to the data directory in the same folder. These configuration info are not only passed on to the RCE producer to configure the DUT, but also interpreted by the EUDAQ to derive online monitoring for the DUT together with the telescope. A general example of telescope + DUT configuration can be found here (not SLAC ESTB), while some explanations of the various configuration items related to the RCE producer can be found here.
Pixel DUT YARR Readout
In addition to RCE, we also have integrated the YARR (Yet Another Rapid Readout) system into the EUDAQ system in ESA. Here are some instructions.
ssh -XY pixel@esadutlbnl1 (pw=Testbeam)cd YarrEudaqProducer
./start_1.sh
In addition to starting the producer, one needs to modify the DUTMask in the .conf. Add +4 to include YARR. There is no need to add anything else because the configuration is currently hard-coded into the producer (and the Latency = 43 and Trig Count = 3 seem good so there should not be a need to touch this).
To fully kill this producer if it gets stuck or when terminating the run control, do a ctrl+Z to move it to the background and then kill in the usual way with ps ux | grep yarr. Then, kill -9 <pid> where <pid> is the id of the producer from the ps aux.
After stopping a run, there will be some offline plots in ~/yarr-eudet/eudaq/data. There is also a simple script for offline analysis:
cd ~/yarr-eudet/eudet ../src/bin/read_rawData data<file>.raw #<file> is <Dutname>_<runnumber>
On occasion, you the trigger counter will increase, but no events will be built. This could be because the chip is in a funny state. We can reconfigure the chip and power cycle:
to run a digital scan
    cd
    cd Yarr/src
    ./test_digi_1.sh
    qpdfview data/last_scan/*.p*
check that they look okay (note that syncrhonous is off). To power cycle
    minicom -D /dev/ttyUSB1
    ctrl-a z
    ctrl-a e
    ++addr 3
to check what you are talking to:
*IDN?should be Agilent Technologies ... To turn it off:
OUTPUT OFF OUTPUT ON ctrl-a z xEUDAQ Online Framework
The EUDAQ software operation involves 3 types of main entities:
| Entity | Location | Node name | IP | OPS | Processes |
|---|---|---|---|---|---|
| Run Control PC | Control room | ar-eudaq | 172.27.100.8 | RHEL 6 | euRun,LogCollector,DataCollector,NIProducer,OnlineMonitor |
| NI Crate | Caladium Rack | ni-eudaq | 172.27.104.9 | Win 7 | EUDAQ, MimosaDAQ, LV FPGA |
| DUT/RCE | Caladium Rack | esadutdaq1 | 172.27.104.45 | SLC 6 | rceOfflineProducer, (TLUProducer) |
| DUT/YARR | near Caladium | esadutlbnl1 | 172.27.104.52 | SLC 6 | YarrProducer, TLUProducer |
Typically, there is only one type of DUT server in operation at any time and that DUT server is also serving the TLUProducer (new arrangement as of Jun/2018).
The operation directory structure on ar-eudaq: user always login as tfuser for EUDAQ operation.
- EUDAQ release and operation base: /opt/install/eudaq/eudaq-1.7
- EUDAQ configuration: /opt/install/eudaq/eudaq-1.7/conf
- Raw data directory: /opt/install/eudaq/eudaq-1.7/data/run***.rawdata
- Online monitoring histograms: /opt/install/eudaq/eudaq-1.7/bin/run*.root (needs manual save to store)
- Online monitoring archive: /home/tfuser/Desktop/yyyymon_onlinemon/ (recommend to copy online mon history root files here)
Pixel DUT RCE Readout
While the DUT readout can be of variety of ways, the RCE readout setup is provided for at least ATLAS pixel users as a standard utility. As of Apr/2016, the DUT RCE readout is upgrading from old the Gen-1 RCE + HSIO setup to a simpler HSIO-II setup, with the dedicated ESADUTDAQ1 Sun server residing the beam tunnel near the EUDET area as the DUT RCE readout host. HSIO-II has the DTM mezzanine with the Gen-3 ZYNQ based RCE operating an Arch-Linux based ARMS CPU that communicates with external world via its native 1Gb/s Ethernet. More general information on HSIO-II/RCE can be found on the RCE Development Lab Twiki.
If you ar not running the system from the ESA console next to the EUDET, but from some public nodes at SLAC, you need to first hop onto an ESA public machine on the 172.27.100 subnet and login as yourself e.g.
ssh -Y ar-esaux2 At least calibration actions will need X window displays so that the -Y qualifier through out is necessary. Then continue to hop onto the DUT readout node as dedicated user tbslac:
  ssh -Y esadutdaq1 -l tbslac
  cd ~/daq/rce
  source ./scripts/setup-gen3.sh
For normal EUDAQ data taking, you need to start and announcing RCE DAQ as a data producer to EUDAQ run control node ar-eudaq with just one command:
rceOfflineProducer -r 0 -d 172.27.100.8 If everything is run smoothly, once you brought up the overall DAQ with EUDET through EUDAQ run control node ar-eudaq, you should see the RCE data producer show up in the producer list. If RCE producer seems to be not behaving correctly even upon restarting, you can reboot the HSIO from the ESADUTADQ1 console with the command:
rebootHSIO -r 0 After ~ half a minute, you can restart the rceOfflineProducer as instructed above. In the very rare event that this still doesn't get you out of trouble due to the problem with the FPGA side of HSIO-II, you can power cycle the HSIO-II remotely from the EPICS controlled power strip which has a dedicated socket for the HSIO-II.
Pixel Calibrations
Before taking an serious beam runs, it is advisable check the modules through calibration. Some sensors are known to need different threshold tunes at different temperatures, so that some calibration runs are expected to be a frequent activity between beam runs. The HSIO reboot will automatically bring up the calibserver on the RCE side to be always ready for it. If you suspect the calibserver ran into trouble or something messed on the RCE, doing a rebootHSIO may be the simplest way to recover. After the regular login process to ESADUTDAQ1, you can launch calibration GUI from ~/daq/rce after executing the ./scripts/setup-gen3.sh once for the session:
calibGui & The operations steps of calibrations are explained briefly in the RCE pixel calibration instruction Twiki , while the functionality details of the calibrations are described in the ATLAS pixel calibration manual. The most commonly used are DIGITAL_TEST and THRESHOLD_SCAN. The new Gen-3 HSIO-II based readout uses a simplified process communication scheme which limits the calibration to one instance of calibserver on RCE and one instance of calibGUI on UNIX host ESADUTDAQ1. It will reject duplicate starters and issue an error message. In case you wanted to run caliGUI from the ESA pit but another session is open in the counting house with noone attending, you can just kill it after checking the process list with ps. The default calibration repository is under /home/tbslac/pixelrce/rce/moduleconfigs/.
In case you want to debug some calibration related problems that can benefit e.g. looking at the calibserver console printout, you can logon to the rce from an esadutdaq1 window:
    ssh root@rce0    (pw=root)
    rce> export PATH=/root/pixelrce/bin:$PATH; export LD_LIBRARY_PATH=/root/pixelrce/lib:$LD_LIBRARY_PATH
    rce> calibserver
DUT DAQ Configuration
The DUT integration is controlled through setup of EUDAQ configuration files with names like ni_coins.cfg etc. residing in /home/tfuser/eudaq/conf folder (also Desktop folder) on the EUDAQ console node ar-eudaq. The data logging also goes to the data directory in the same folder. These configuration info are not only passed on to the RCE producer to configure the DUT, but also interpreted by the EUDAQ to derive online monitoring for the DUT together with the telescope. A general example of telescope + DUT configuration can be found here (not SLAC ESTB), while some explanations of the various configuration items related to the RCE producer can be found here.
Pixel DUT YARR Readout
In addition to RCE, we also have integrated the YARR (Yet Another Rapid Readout) system into the EUDAQ system in ESA. Here are some instructions.
ssh -XY pixel@esadutlbnl1 (ask Timon or Ben for the password or don't close the terminal) cd yarr-eudet/eudaq bin/yarr-fe65p2-producer -n YARR -r 172.27.100.8In addition to starting the producer, one needs to modify the DUTMask in the .conf. Add +4 to include YARR. There is no need to add anything else because the configuration is currently hard-coded into the producer (and the Latency = 43 and Trig Count = 3 seem good so there should not be a need to touch this).
To fully kill this producer if it gets stuck or when terminating the run control, do a ctrl+Z to move it to the background and then kill in the usual way with ps ux | grep yarr. Then, kill -9 <pid> where <pid> is the id of the producer from the ps ux.
After stopping a run, there will be some offline plots in ~/yarr-eudet/eudaq/data. There is also a simple script for offline analysis:
cd ~/yarr-eudet/eudet ../src/bin/read_rawData data<file>.raw #<file> is <Dutname>_<runnumber>
Infrastructure Utilities
...