Page History
...
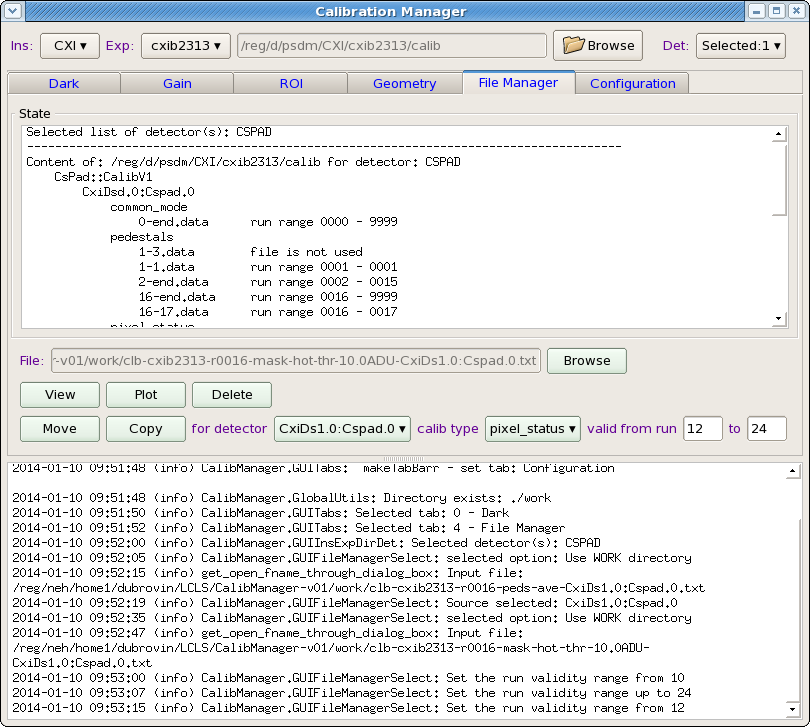
- Instrument/Experiment/Detector selection panel,
- Tab-bar with switching application panel,
- Log-book information panel.
| Anchor | ||||
|---|---|---|---|---|
|
Instrument/Experiment/Detector selection panel
...
which help to set associated parameters. Each of these buttons must be sequentially clicked and desired value should be selected from drop-down menu. After experiment name is selected, the default calibration directory appears in the next-right information field. This top-level calibration directory will be used as a destination path for deployment of all calibration files. Optional button Browser launch directory selection dialog window which allows to set different from default destination calibration directory. At first setting the sequence of operations in this panel is guided by the next enabled green button. Already enabled buttons can be re-selected at any time. For tools like Dark or Gain the list of calibrated detectors is selected by the check boxes in the pop-up panel
| Anchor | ||||
|---|---|---|---|---|
|
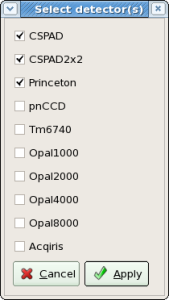
and the title of the Detector button shows how many detectors are selected. For File Manager tool only one detector should be selected.
...
- xtc Files - prints in the Log book panel the list of available xtc files,
- Sources DB - prints in the Log book panel the list of available data sources found in DB,
- Sources XTC - prints in the Log book panel the list of available data sources found at the xtc file scan,
- O/Files - prints in the Log book panel the list of files associated with dark run processing and their current status,
- Show cmd - prints in the Log book panel the list of deployment commands, and
- More options check box - if it is marked then more buttons show up:
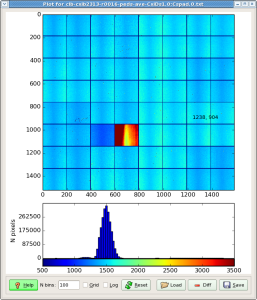
- View - launch text-file viewer and
- Plot - plots image from selected from pop-up menu file. In case of files containing CSPAD array with shape=[32*185,388] image is currently generated as a table for all sensors:
| Anchor | ||||
|---|---|---|---|---|
|
ROI
Application panel under ROI (Region Of Interest) tab has a minimal number of control fields, which allow to specify the file with image and open/close Mask Editor UI in separate window.
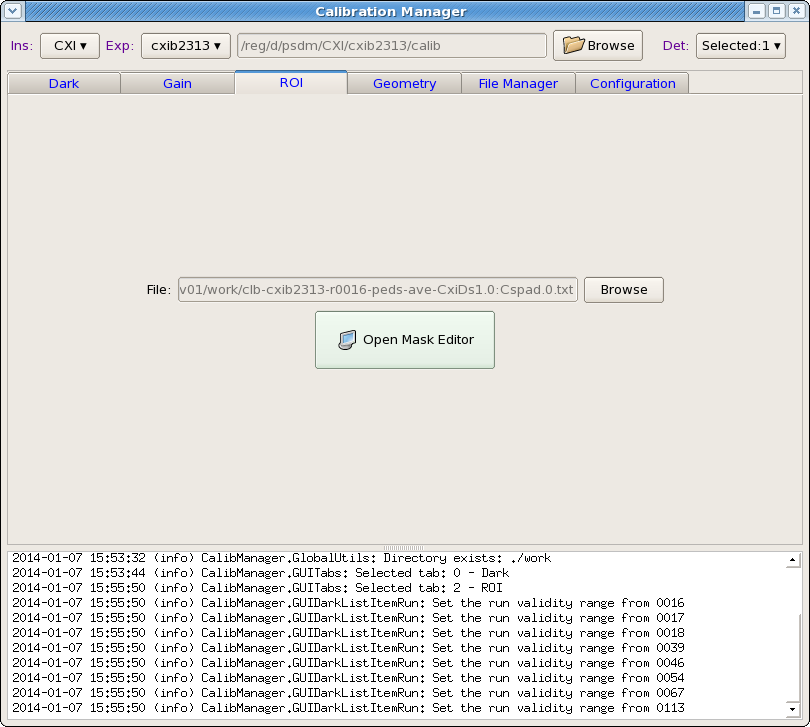
Then the When launched, Mask Editor works as completely independent application. The Mask Editor allows to draw on image any number of a few geometry figure types and finally generate and save positive or negative mask for loaded image.
...
| Anchor | ||||
|---|---|---|---|---|
|
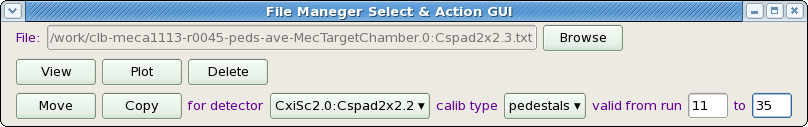
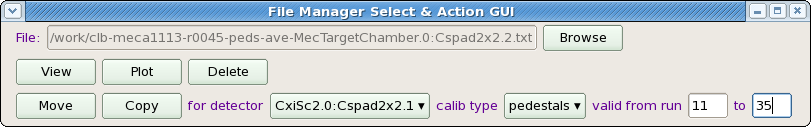
File Manager
...
File manager tool consists of Status panel and control panel:
File manager control panel contains a set of control fields with functionality as follows.
- Button Browse - launches the file selection window which helps to select any calibration file in any location. Location is hinted in the intermediate pop-up window. Selected file is displayed in the next-left information field.
- View button - opens/closes the file viewer in separate window.
- Plot buttons - opens/closes the plotter window and plots the file as 2-d image (if applicable).
- Delete button - deletes the selected file from disc.
- Move/Copy buttons - perform associated actions on selected file. The destination directory and file name is defined by the Instrument/Experiment/Detector selection panel and next-right filelds:
- for detector selection button - sets the destination detector name from drop down menu,
- calibration type selection button - sets the destination calibration type, and
- two editable fields - set the run range for destination calibrationfile.
| Anchor | ||||
|---|---|---|---|---|
|
Configuration
Configuration table tool has its own tab bar switching between panels with set sets of parameters.
Two panels are implemented currently:
| Anchor | ||||
|---|---|---|---|---|
|
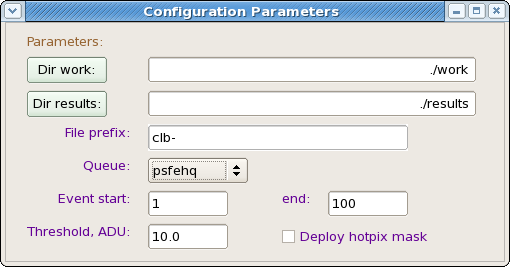
Configuration Parameters
This panel has a few active fields:
- Dir work button - launch directory selection window for
workdirectory. Selected directory shows up in the next right information field. - Dir results button - launch directory selection window for
resultsdirectory. Selected directory shows up in the next right information field. This directory is not currently in use. - File prefix editable field - sets common prefix of all files created in the work directory, excluding the log file.
- Queue combo box - sets the queue name for batch jobs from available list containing psnehq, psfehq, etc.
- Event start/end editable fields - set the first and last event in current run for calibration processing job.
- Threshold, ADU editable field - sets the threshold on RMS in ADU (Analog to Digit Units) for hot pixel mask. If RMS for pixel exceeds this threshold - pixel is marked as hot in the hot pixel mask file.
- Deploy hotpix mask check box - if checked - hotpixel mask file will be deployed along with pedestal file at click on Deploy button in the List of run items.
| Anchor | ||||
|---|---|---|---|---|
|
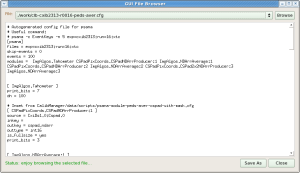
Configuration File
...
Configuration File
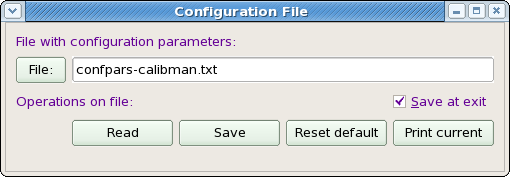
This panel is intended for manipulation with configuration file, which contains a list of configuration parameters for entire project. The panel has a few active fields:
- File button and next right editable field - allows to select/type-in the configuration file name.
- Read, Save, Reset default buttons - perform associated operations on parameters at click.
- Print current - dumps current list of configuration parameters in the Log-book panel.
Confirmation windows
There is a bunch of confirmation popup windows with modal-style dialog. Appropriate selection need to be done by clicking on possible continuation buttons.
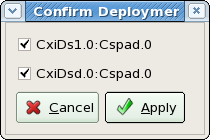
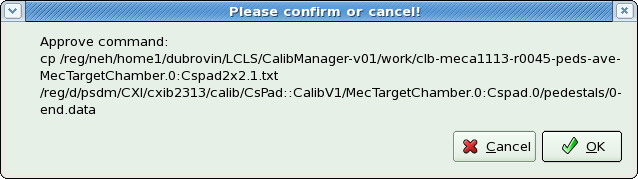
| Note |
|---|
Modal dialog assumes that one of the buttons in this type of dialog window need to be clicked, otherwise UI will be frozen. |
Project status
Current status corresponds to:
...
- Set correct queue which will be used for batch jobs: click on tabs: Configuration -> Parameters, select Queue combo box.
- Click on tab Dark.
- Set Instrument, Experiment, from combo boxes and click on Select button to select Detector(s) from pop-up window.
- Set filter for runs using combo boxes to the right from labels Show runs and for detectors.
- For runs in the table, which you want to calibrate, click on button Go, relax and wait until button Deploy show-up to the right from button button. A few buttons Go can be clicked sequentially for different runs in order to run appropriate jobs in batch simultaneously.
- Change validity range if necessary, click on Deploy button. If everything is ok, it is done!
Known problems and ways around
...
- AFS token is expired for your terminal session. Batch system will complain. Use aklog command.
- work directory is missing... make it manually in accordance with selected or default path in Configuration -> Parameters, Dir work
- Before launching
calibmanapplication, first executekinitandaklogcommands. - job on data from NEH/FEH are submitted to the wrong butch queue psfehq/psnehq. Set appropriate queue.
- DB has a list of sources (detectors) which does not coincide with what is written in xtc file. After job is submitted, check the list of detectors found in xtc scan and check only available detectors in the Detector selection menu.
References
Calibration management tool developement notesDescription ofCalibration database- Mask Editorbutton
Overview
Content Tools