...
- The initial audiences were:
- Chin Fang for part of the Zettar demonstration of file transfer at the Super Computing 2014
- Renan Souza for the UFRJ , Maria Campos and her team at UFRJ for the PingER Linked Open data project.
- Ibrahim Abaker of UM for his Big Data project
- This The hourly data was chosen rather than the raw data since it is cleaner having been through several filters.
- The hourly data is in: /nfs/slac/g/net/pinger/pingerreports/hep/<metric>/ directory with the file name <metric>
<size><by><yyyy><mm>-<dd>.txt.gz
- The hourly data is in: /nfs/slac/g/net/pinger/pingerreports/hep/<metric>/ directory with the file name <metric>
The raw (daily gathered data from all the monitoring hosts) is close to 400GBytes. This includes:
- /nfs/slac/g/net/pinger/pinger_mon_data/ping-<YYYY>-<MM>.txt (15GB) SLAC measurements
- /nfs/slac/g/net/pinger/pinger2/data/ping-<YYYY>-<MM>.txt (8GB) SLAC measurements
- /nfs/slac/g/net/pinger/pingerdata/ (375GB) data gathered at SLAC
- We ignore these data in the rest of this web page.
- /nfs/slac/g/net/pinger/pinger_mon_data/ping-<YYYY>-<MM>.txt (15GB) SLAC measurements
Volume of data
There are roughly 100,000 files. The volumes of the files are shown below.
| Uncompressed Volume of files per Year for all metrics | Uncompressed Volume for 3 metrics | Volume of uncompressed data by metric |
|---|---|---|
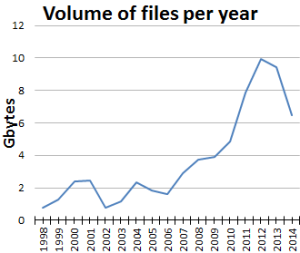 |  | 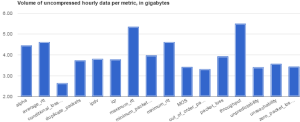 |
Compression
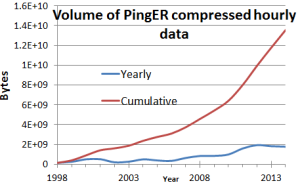
If I multiply the file size times the frequency to get the bytes in each bin, and then sum I get 11,566,219,714 Bytes from compressed and 58,434,764,384 from uncompressed. This is ~ a compression ratio of 5:1. The graph below also shows that Uncompressed files are larger than compressed.
| Volume of compressed data by metric | Frequency of files by size from compressed & uncompressed data | Cumulative & yearly compressed data volumes |
|---|---|---|
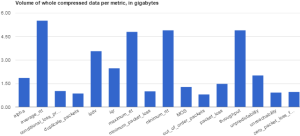 | 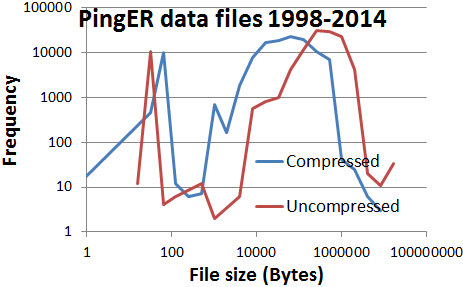 |  |
Missing data
There are two types of missing data:
...
| Missing files/year by metric | Total number of dots per year | Dots per metric |
|---|---|---|
 |  |  |
Spreadsheets
Hourly file data analysis from Renan and Christiane, see also
https://docs.google.com/spreadsheets/d/1357xGkpYFeW0DcnDB-i7ZER2RBhjdQHEbmMDOvdc7bA/edit?usp=sharing