Page History
...
Adjust the mask parameters using editor window and click on "Apply" button again. Mask image will have changed according to set parameters.
RoiArch
Simple example
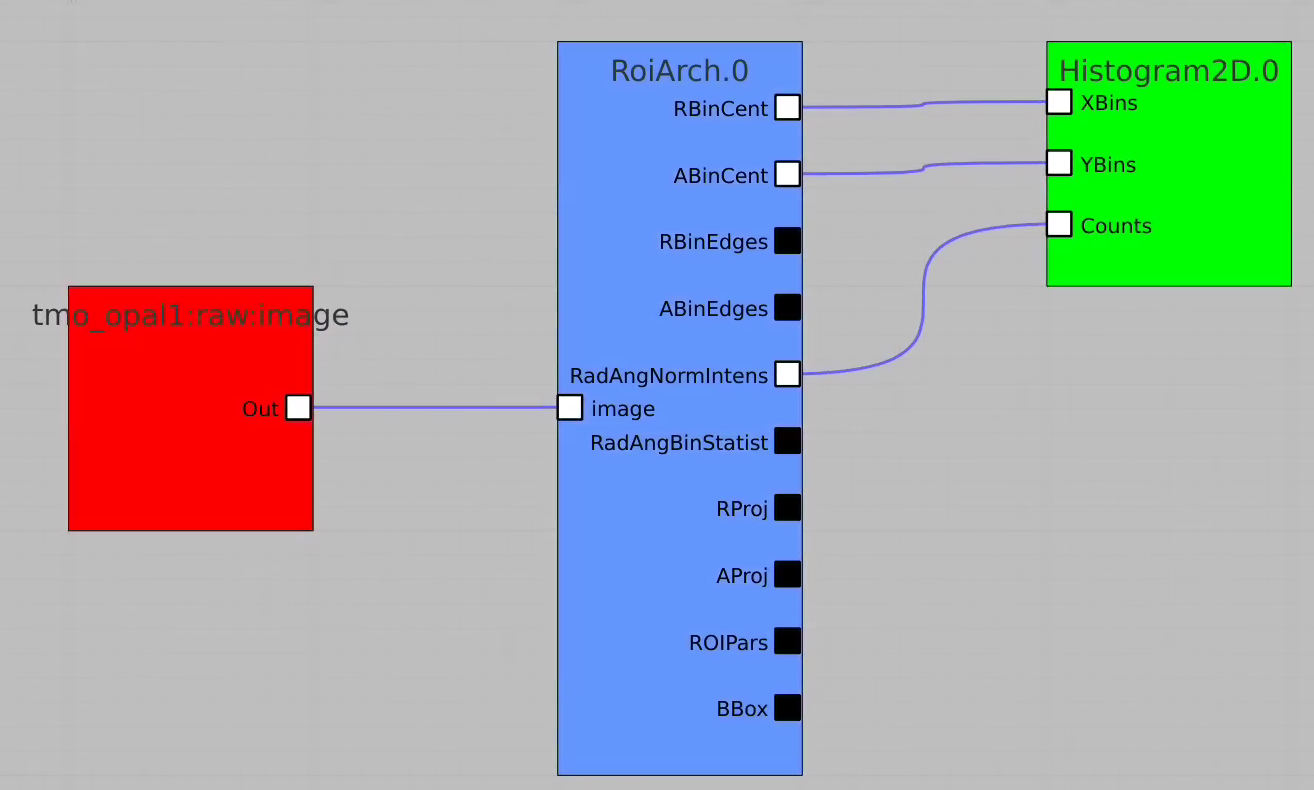
In simple case we use 2D image as input array without mask and ImageViewer with bin numbers in stead of actual scales for radial and angular dimensions.
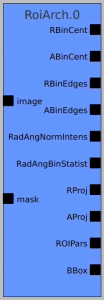
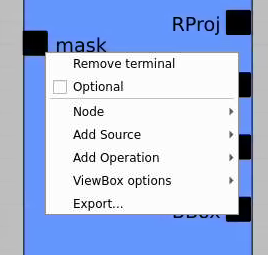
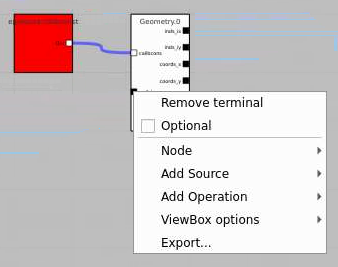
First, bring RoiArch to the flowchart, right-click on input "mask" terminal and select "Remove terminal" on pop-up window. (Currently ami2 does not work with optional terminals).
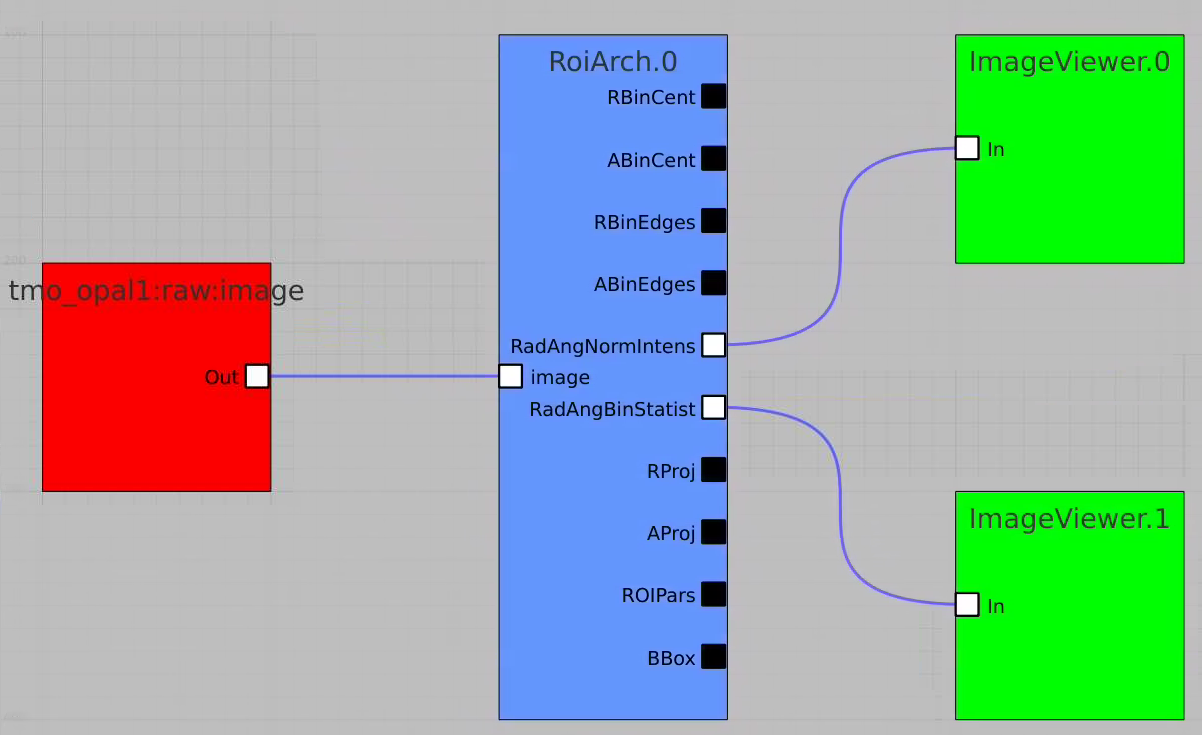
Bring other control nodes to the flowchart and connect them as shown below and click on "Apply" button.
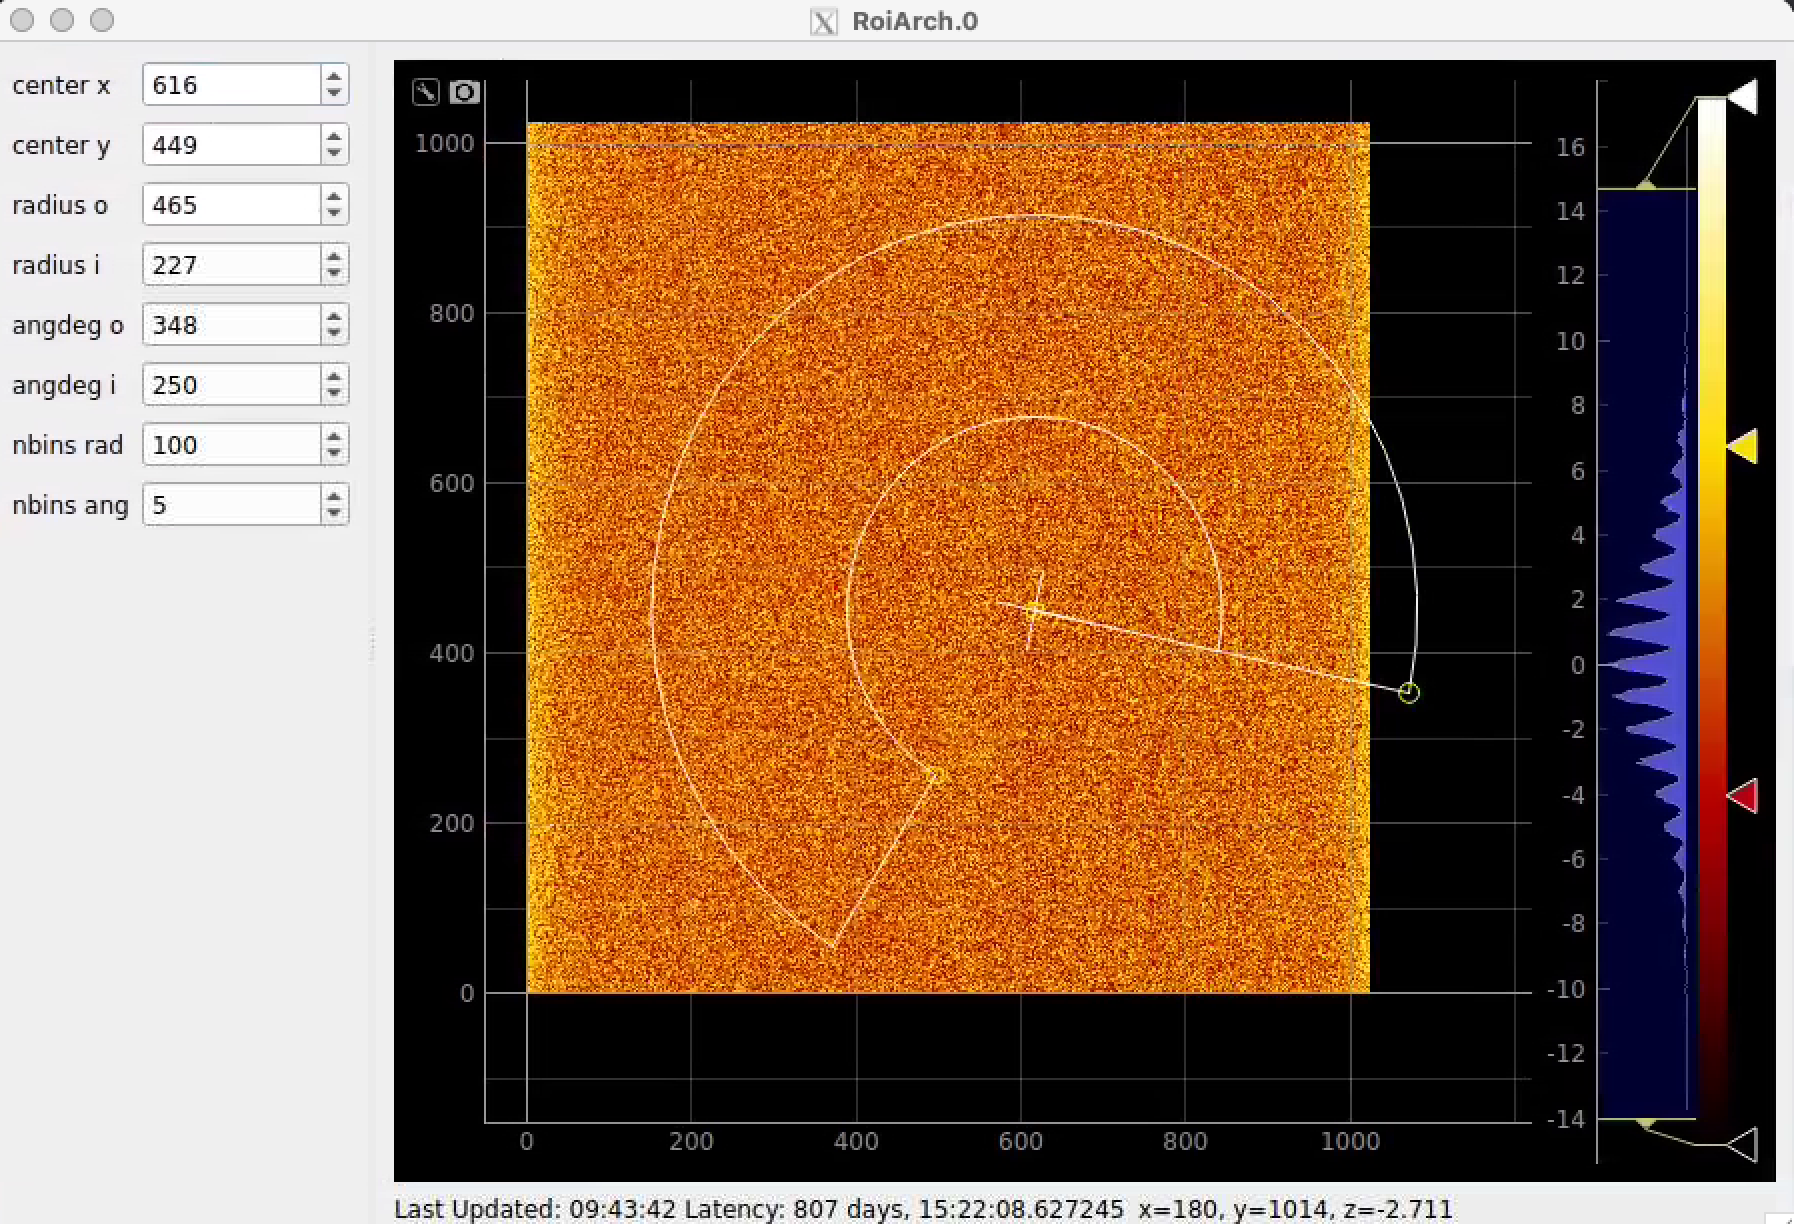
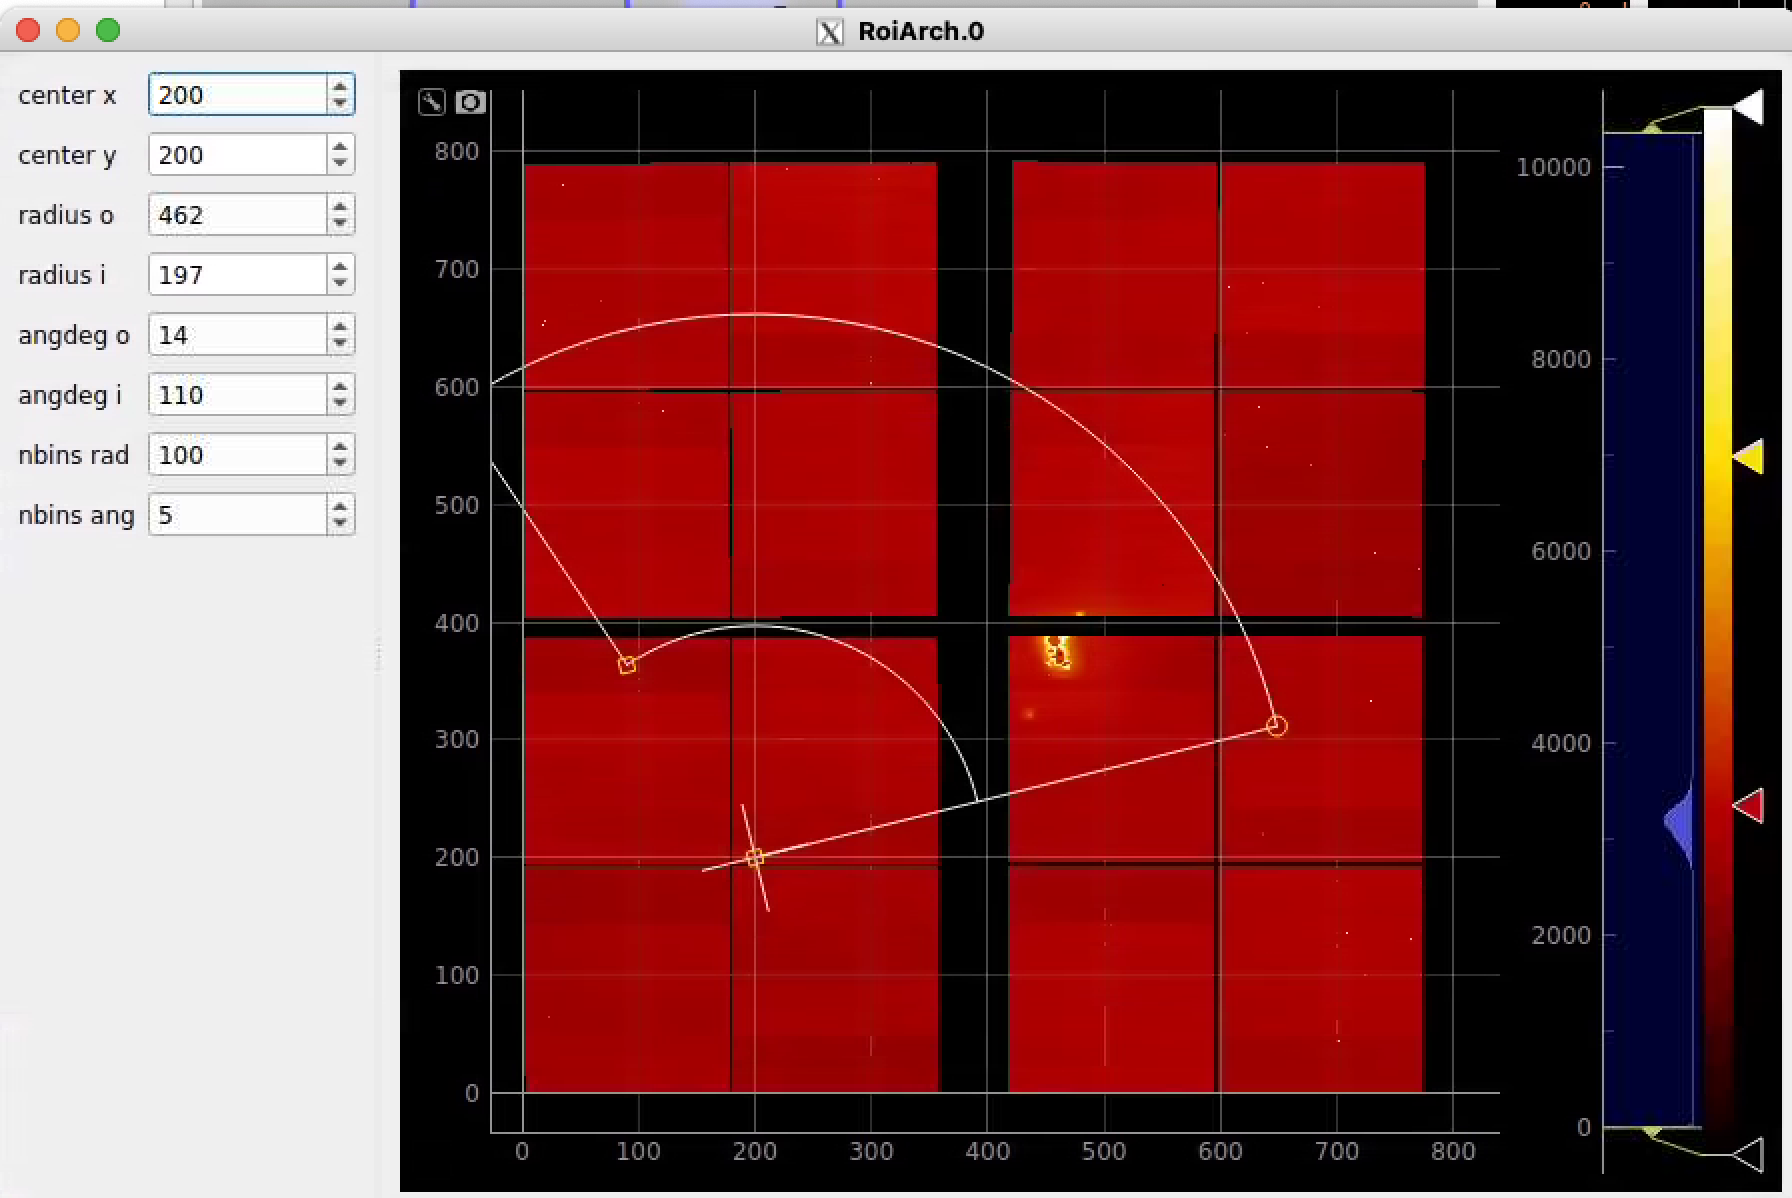
Click on RoiArch control node and adjust desired ROI region on pop-up window.
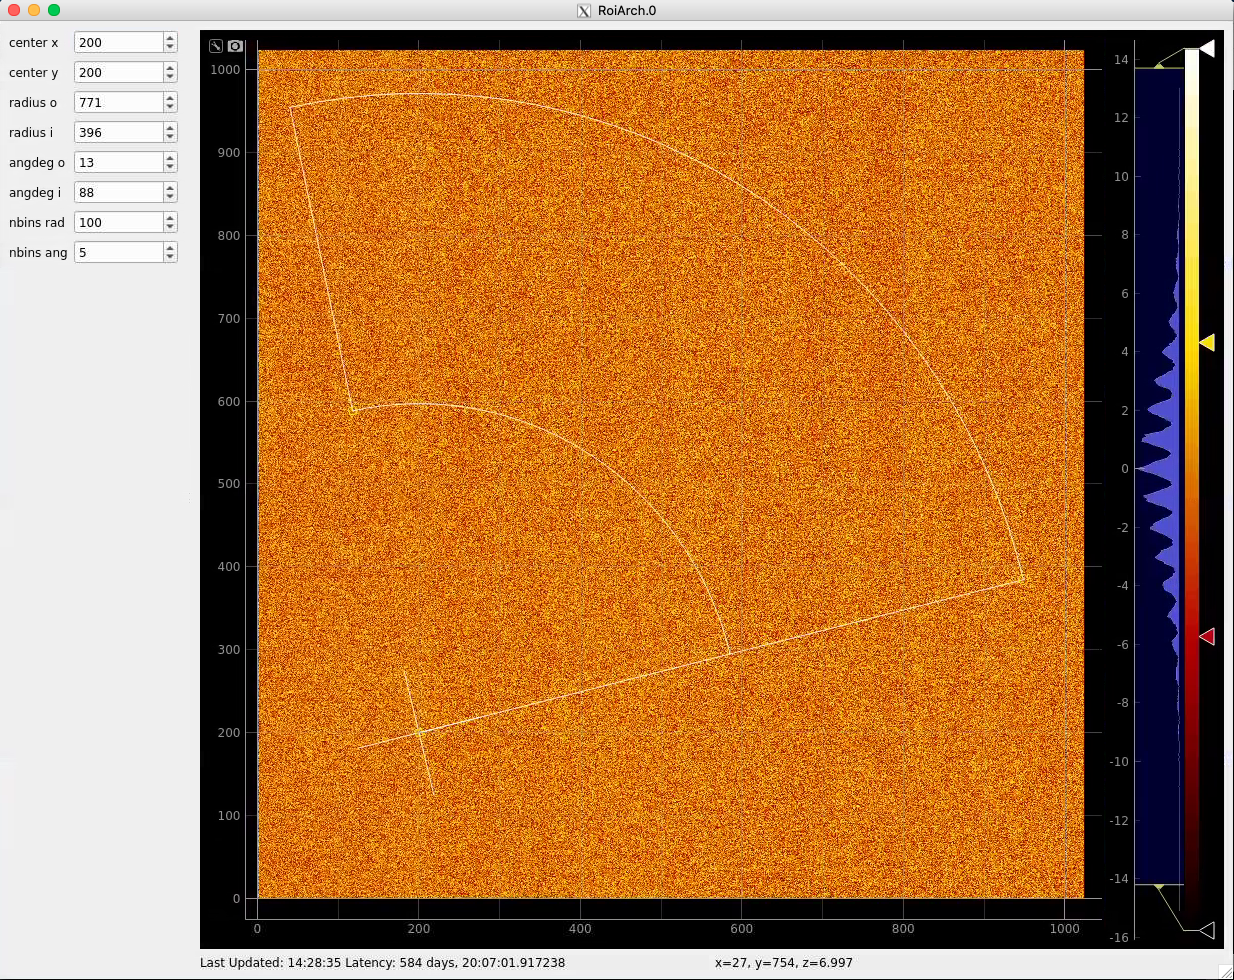
Image can be moved and zoomed by click-and-drag and scrolling mouse, respectfully.
ArchROI can be adjusted using 3 control points for center, external radius and entire rotation, internal radius and arch angular size. Alternatively, ArchRoi parameters can be adjusted using editor for parameters in the left side of the window. Click on "Apply" button after mask parameters are set.
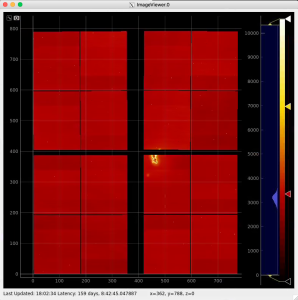
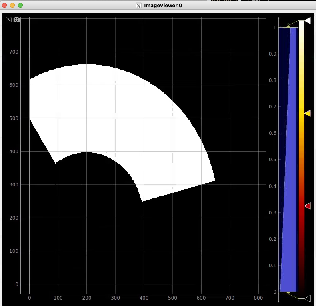
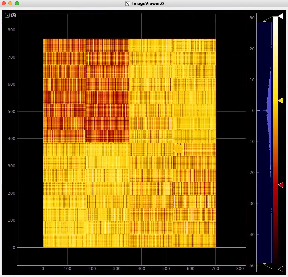
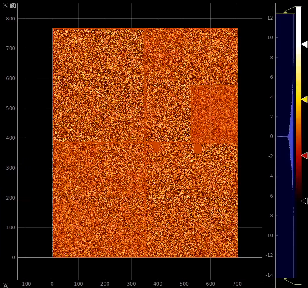
Then click on ImageViewer.0 and ImageViewer.1 control nodes to see images for r-angle per pixel normalized intensity and associated pixel per bin statistics.
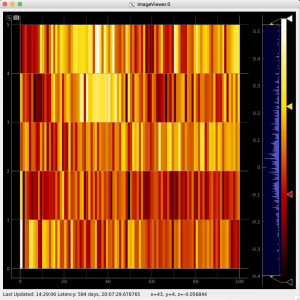
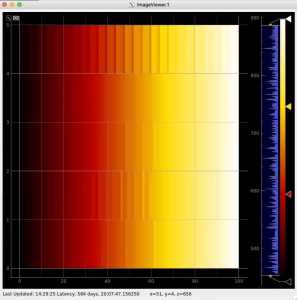
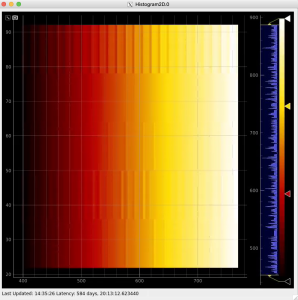
Plot radial-angular distribution with scales scale
R-angular plot with scales for normalized intensity
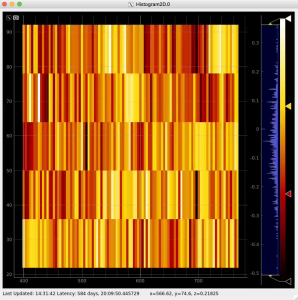
R-angular plot with scales for per-bin pixel statistics
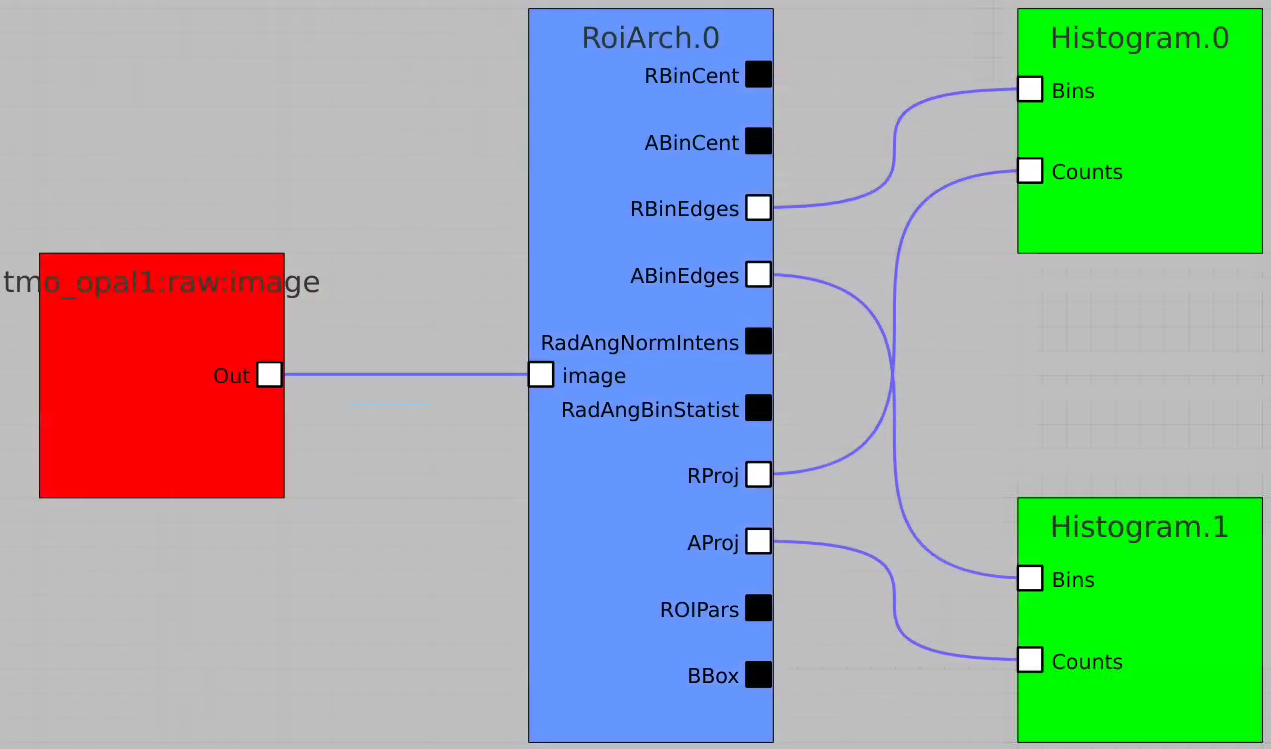
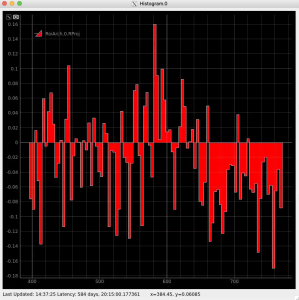
Radial and angular projections with normalized per pixel intensity
Arrays of N+1 bin edges should be used for 1D histograms
Apply mask
Bring RoiArch to the flowchart, connect th Mask.0 control node output (2D) Mask with RoiArch "mask" input terminal.
Then build other control nodes as in previous examples, click on "Apply" button, etc.
Geometry and Detector Image
Command to test
Geometry and Detector Image
Command to test
| Code Block | ||
|---|---|---|
| ||
ami-local -b 1 -f interval=1 psana://exp=uedcom103,run=7,dir=/cds/data/psdm/prj/public01/xtc |
Use geometry with image
Select optional geometry file
By default geometry data comes from DB associated with experiment or detector. Optional geometry file can be specified through the click on Geometry Control Node to deal with parameters window.
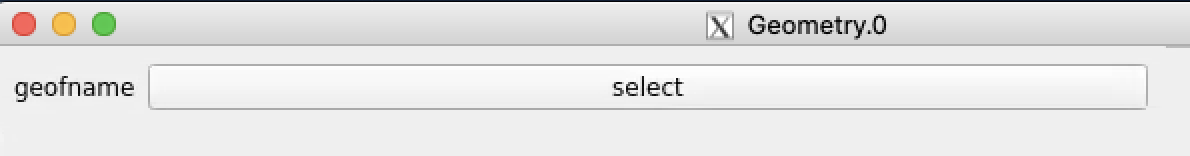
Click on "select" button and select desired geometry file, e.g.
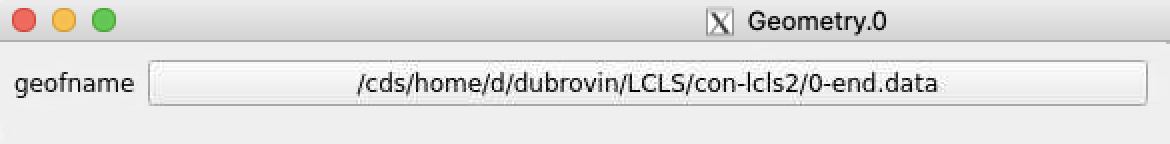
Use Geometry without input array
Add the Geometry Control Node as usually and remove input terminal for arr3d. Click on "Apply" and use any geometry output parameters except "image".
RoiArch
Simple example
In simple case we use 2D image as input array without mask and ImageViewer with bin numbers in stead of actual scales for radial and angular dimensions.
First, bring RoiArch to the flowchart, right-click on input "mask" terminal and select "Remove terminal" on pop-up window. (Currently ami2 does not work with optional terminals).
Bring other control nodes to the flowchart and connect them as shown below and click on "Apply" button.
Click on RoiArch control node and adjust desired ROI region on pop-up window.
Image can be moved and zoomed by click-and-drag and scrolling mouse, respectively.
ArchROI can be adjusted using 3 control points for center, external radius and entire rotation, internal radius and arch angular size. Alternatively, ArchRoi parameters can be adjusted using editor for parameters in the left side of the window. Click on "Apply" button after mask parameters are set.
Then click on ImageViewer.0 and ImageViewer.1 control nodes to see images for r-angle per pixel normalized intensity and associated pixel per bin statistics.
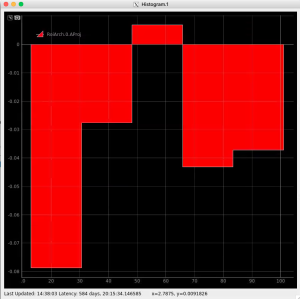
Plot radial-angular distribution with scales scale
R-angular plot with scales for normalized intensity
R-angular plot with scales for per-bin pixel statistics
Radial and angular projections with normalized per pixel intensity
Arrays of N+1 bin edges should be used for 1D histograms
Apply mask
Bring RoiArch to the flowchart, connect th Mask.0 control node output (2D) Mask with RoiArch "mask" input terminal.
Then build other control nodes as in previous examples, click on "Apply" button, etc.
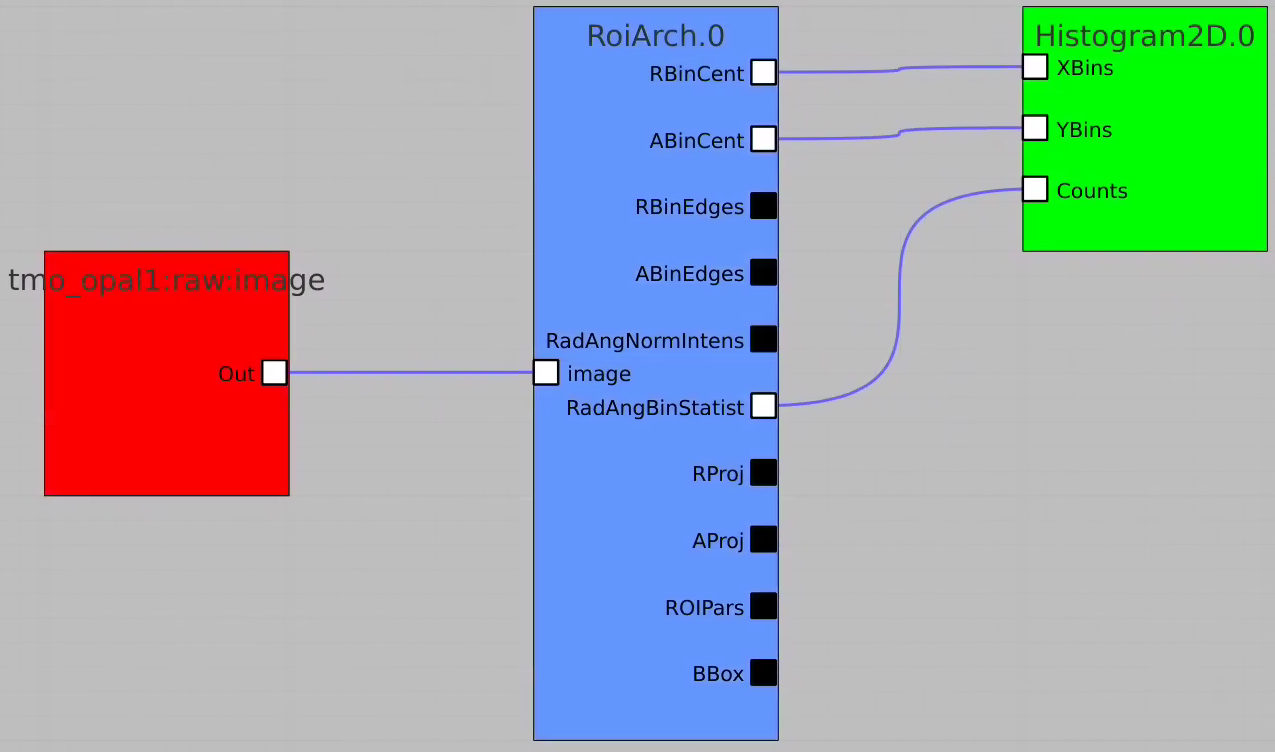
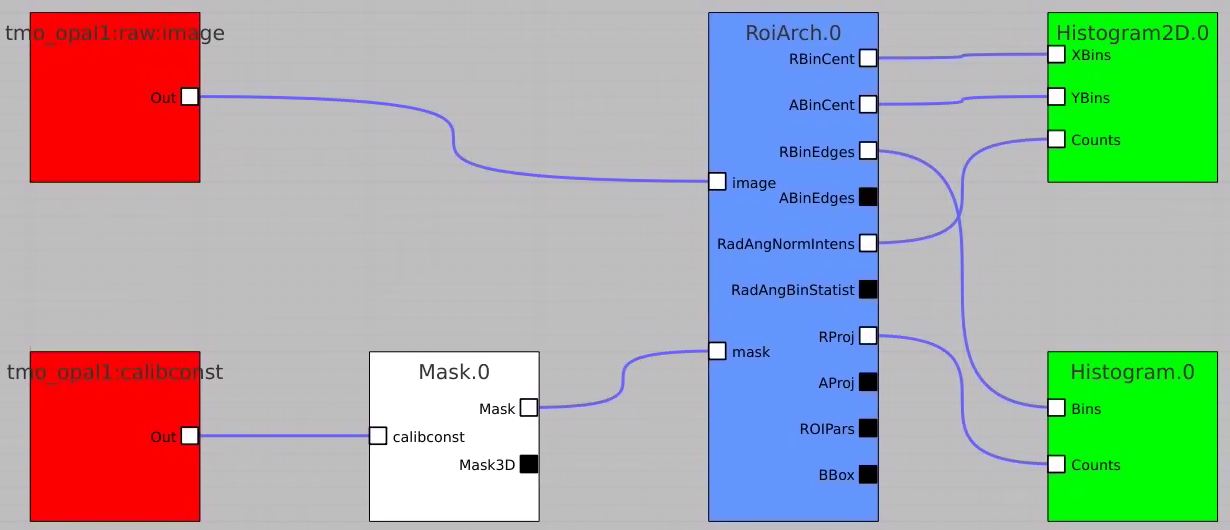
RoiArch output for 2-d mask
| Code Block | ||
|---|---|---|
| ||
ami-local -b 1 -f interval=1 psana://exp=tmoc00118,run=222,dir=/cds/data/psdm/prj/public01/xtc |
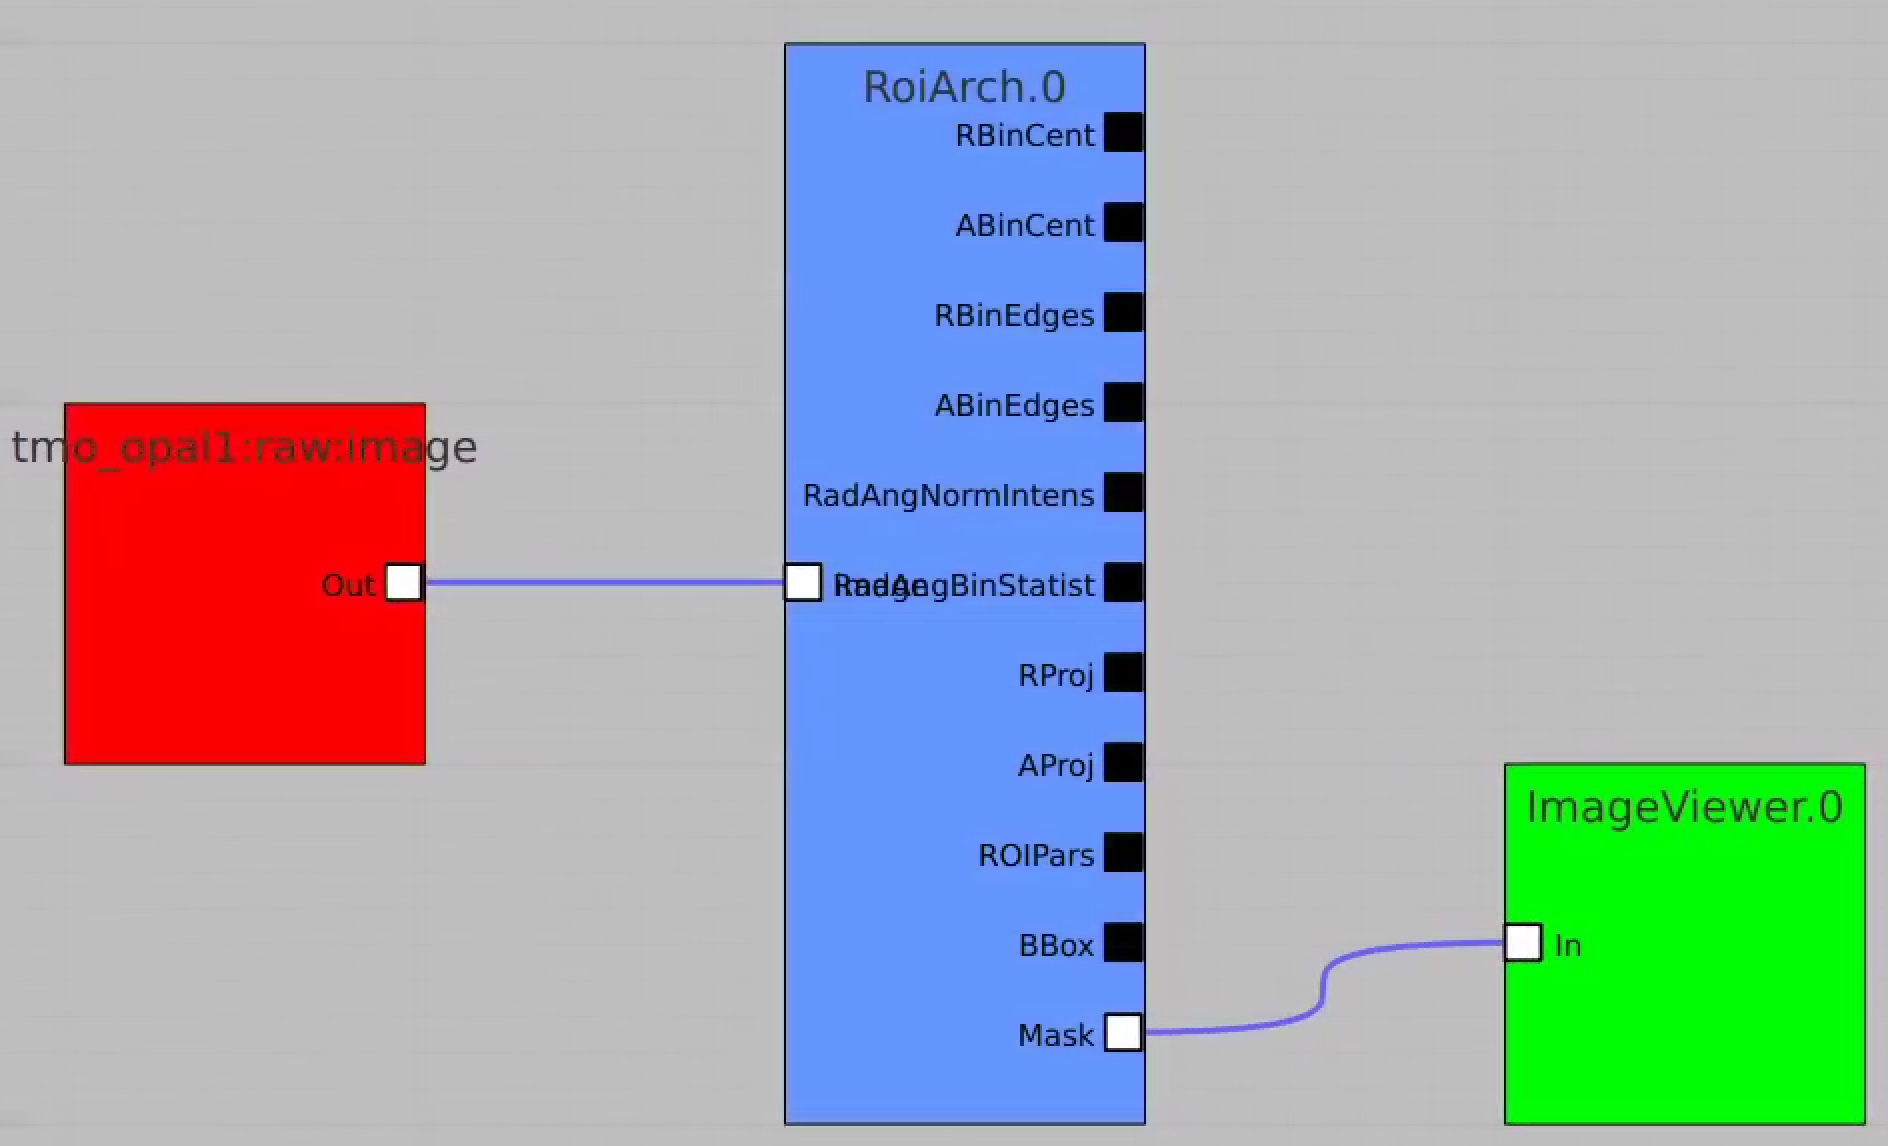
- NEW: Node RoiArch got new output terminal Mask (Array2d)
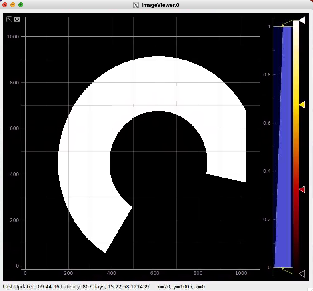
- Use tmo_opal1:raw:image (Array2d) as input to RoiArch, draw/edit arch, get Mask (Array2d) shaped as input image.
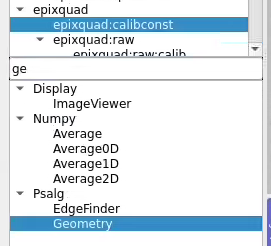
Usage of RoiArch for multi-panel detector and make 2-d and 3-d masks
| Code Block | ||
|---|---|---|
| ||
ami-local -b 1 -f interval=1 psana://exp=uedcom103,run=7,dir=/cds/data/psdm/prj/public01/xtc |
NEW:
- in node Geometry separate arrays are combined in lists of index and coordinate arrays
- new nodes Mask3dFrom2d and TableFromArr3d
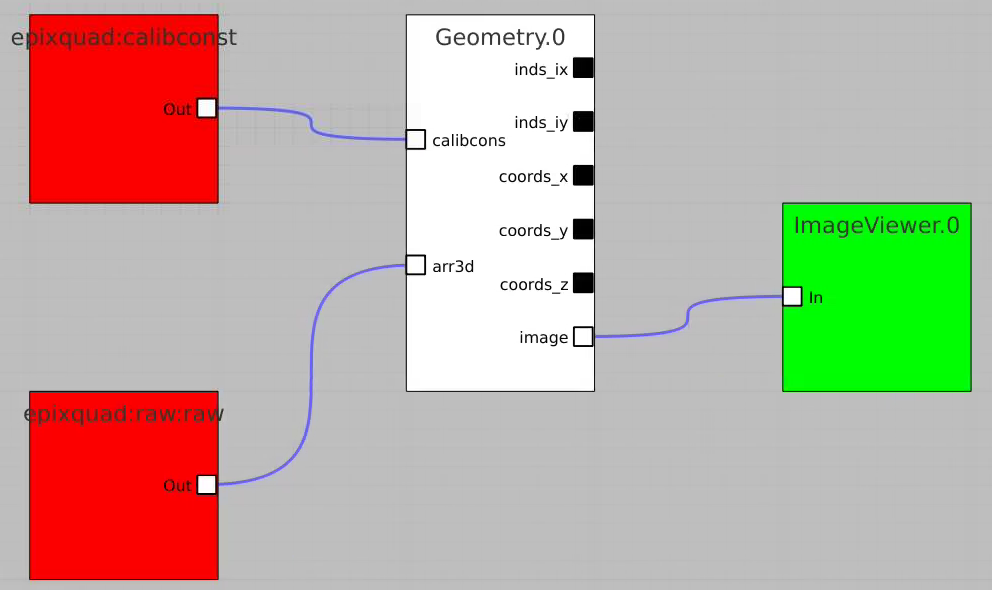
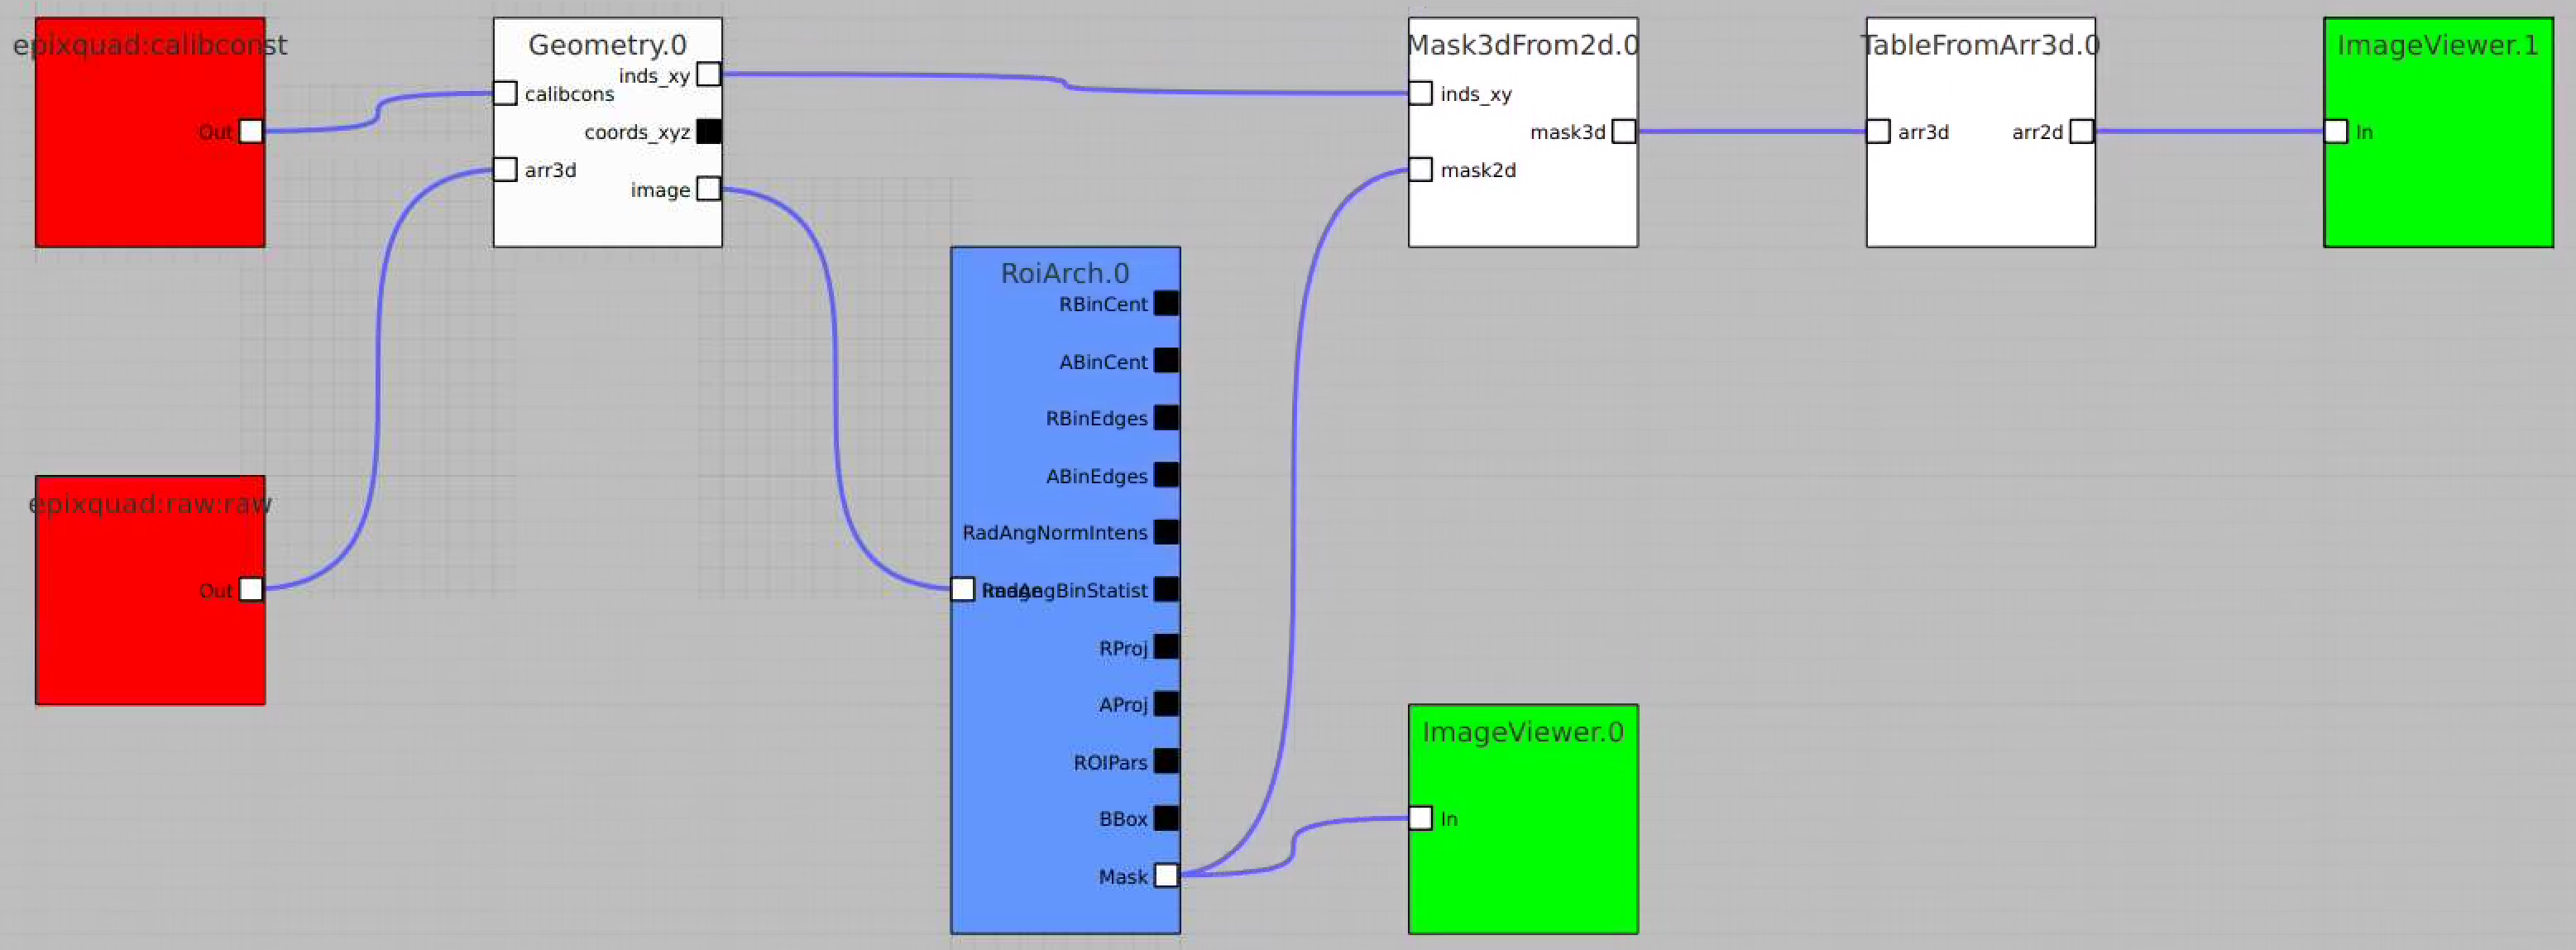
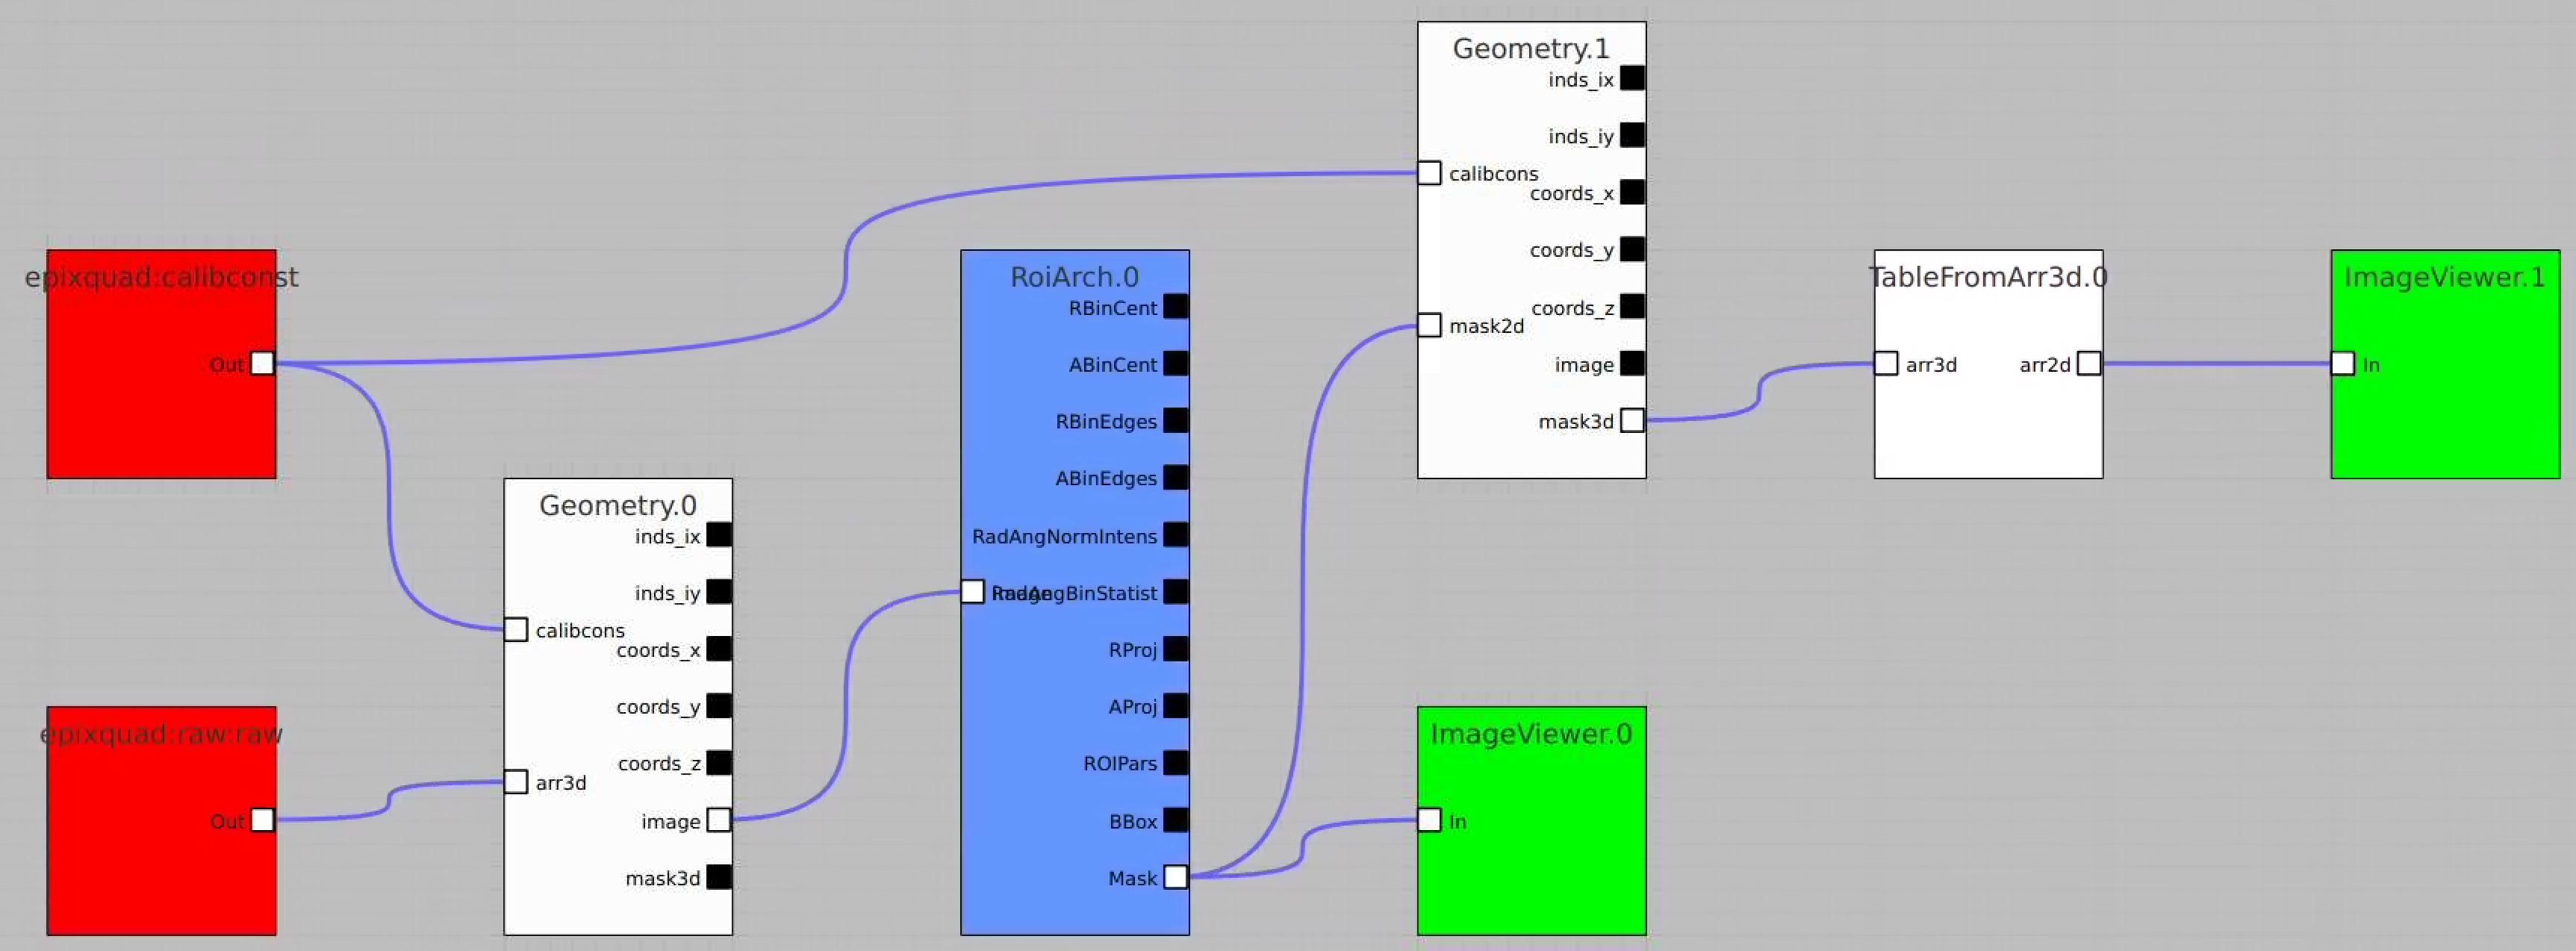
Example shows how to
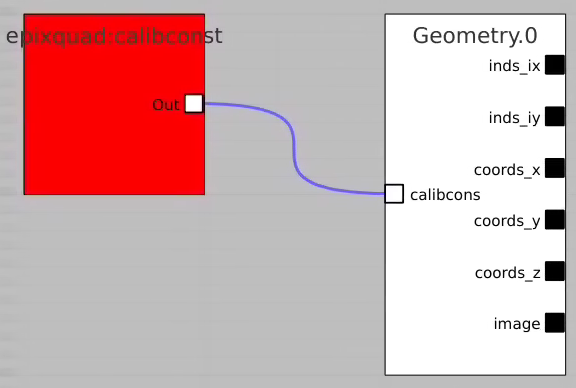
- use epixquad:raw:raw (Array3d) and epixquad:calibconst (dict) as input to Geometry to generate image (Array2d),
- pass this image to RoiArch input, draw/edit arch, get Mask (Array2d) shaped as input image,
- use node Mask3dFrom2d with input mask2d from RoiArch and inds_xy from Geometry to generate 3-d mask array shaped as raw data,
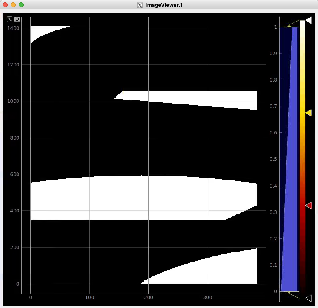
- use nodes TableFromArr3d to convert 3-d mask to 2-d table of segments (without Geometry) to plot with ImageViewer.1
Potential extension of the node Geometry for 3-d mask output (TEMPORARY FOR PRESENTATION ONLY)
AMI issues
- Mask 3-d can be converted directly in the node Geometry (Mask3dFrom2d may not be required...),
- it needs in optional input parameters
- AMI does not work correctly with default input terminals
- unused terminals must be remover interactively
- if intermediate terminal removed input is moved to previous one...
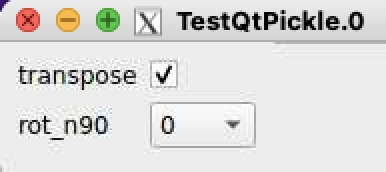
- Also need in a few parameters in TableFromArr3d, but
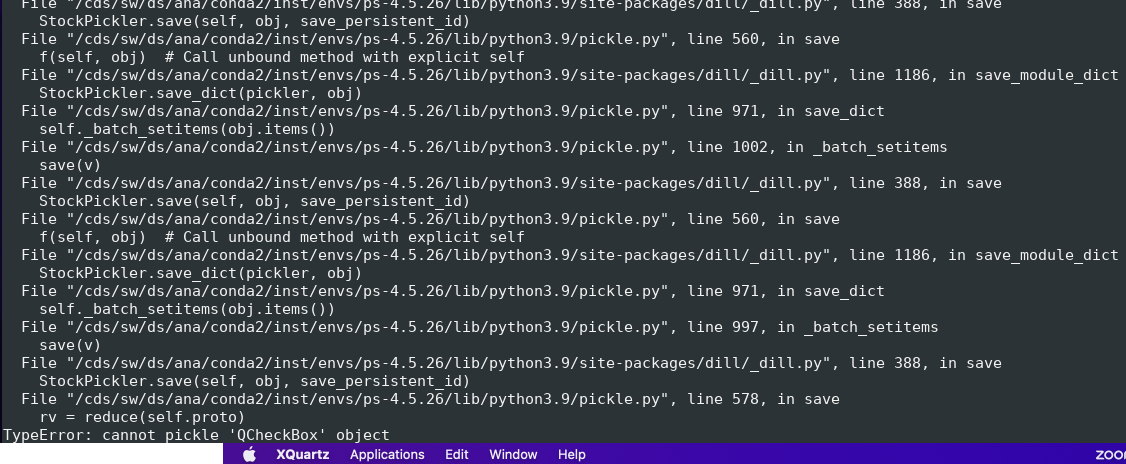
- AMI fails to pickle qt modules (ComboBox, etc) and crashes...
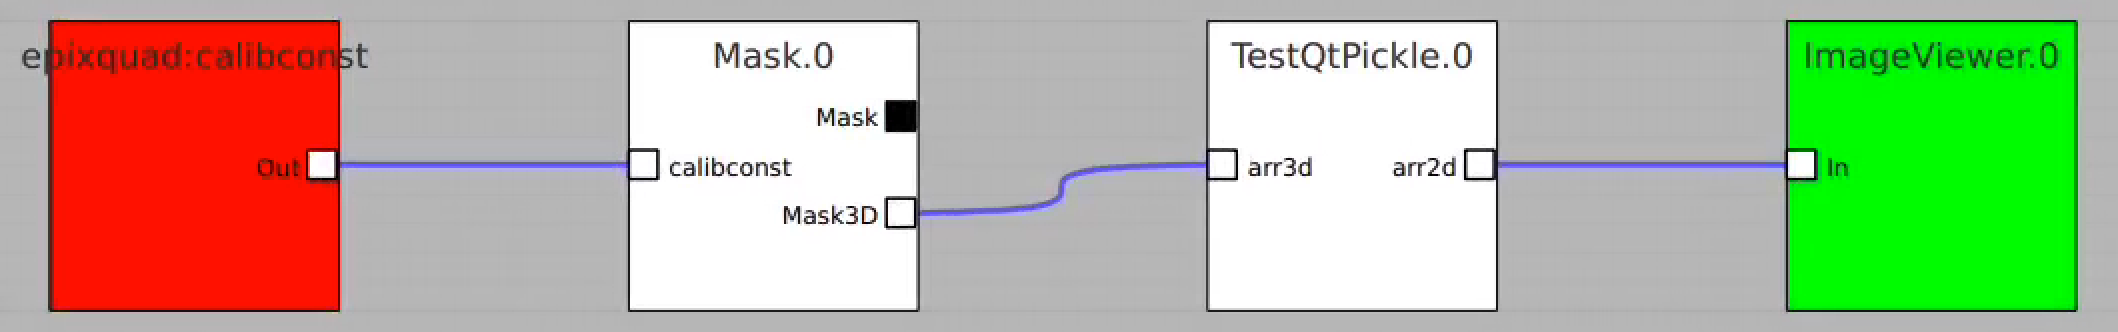
Example of issue with pickle of qt object
| Code Block | ||
|---|---|---|
| ||
Essential code is in ami/flowchart/library/Psalg.py
| ||
| Code Block | ||
| ||
ami-local -b 1 -f interval=1 psana://exp=uedcom103,run=7,dir=/cds/data/psdm/prj/public01/xtc |
Use geometry with image
Select optional geometry file
By default geometry data comes from DB associated with experiment or detector. Optional geometry file can be specified through the click on Geometry Control Node to deal with parameters window.
Click on "select" button and select desired geometry file, e.g.
Use Geometry without input array
Add the Geometry Control Node as usually and remove input terminal for arr3d. Click on "Apply" and use any geometry output parameters except "image".
xtc |
Crash:
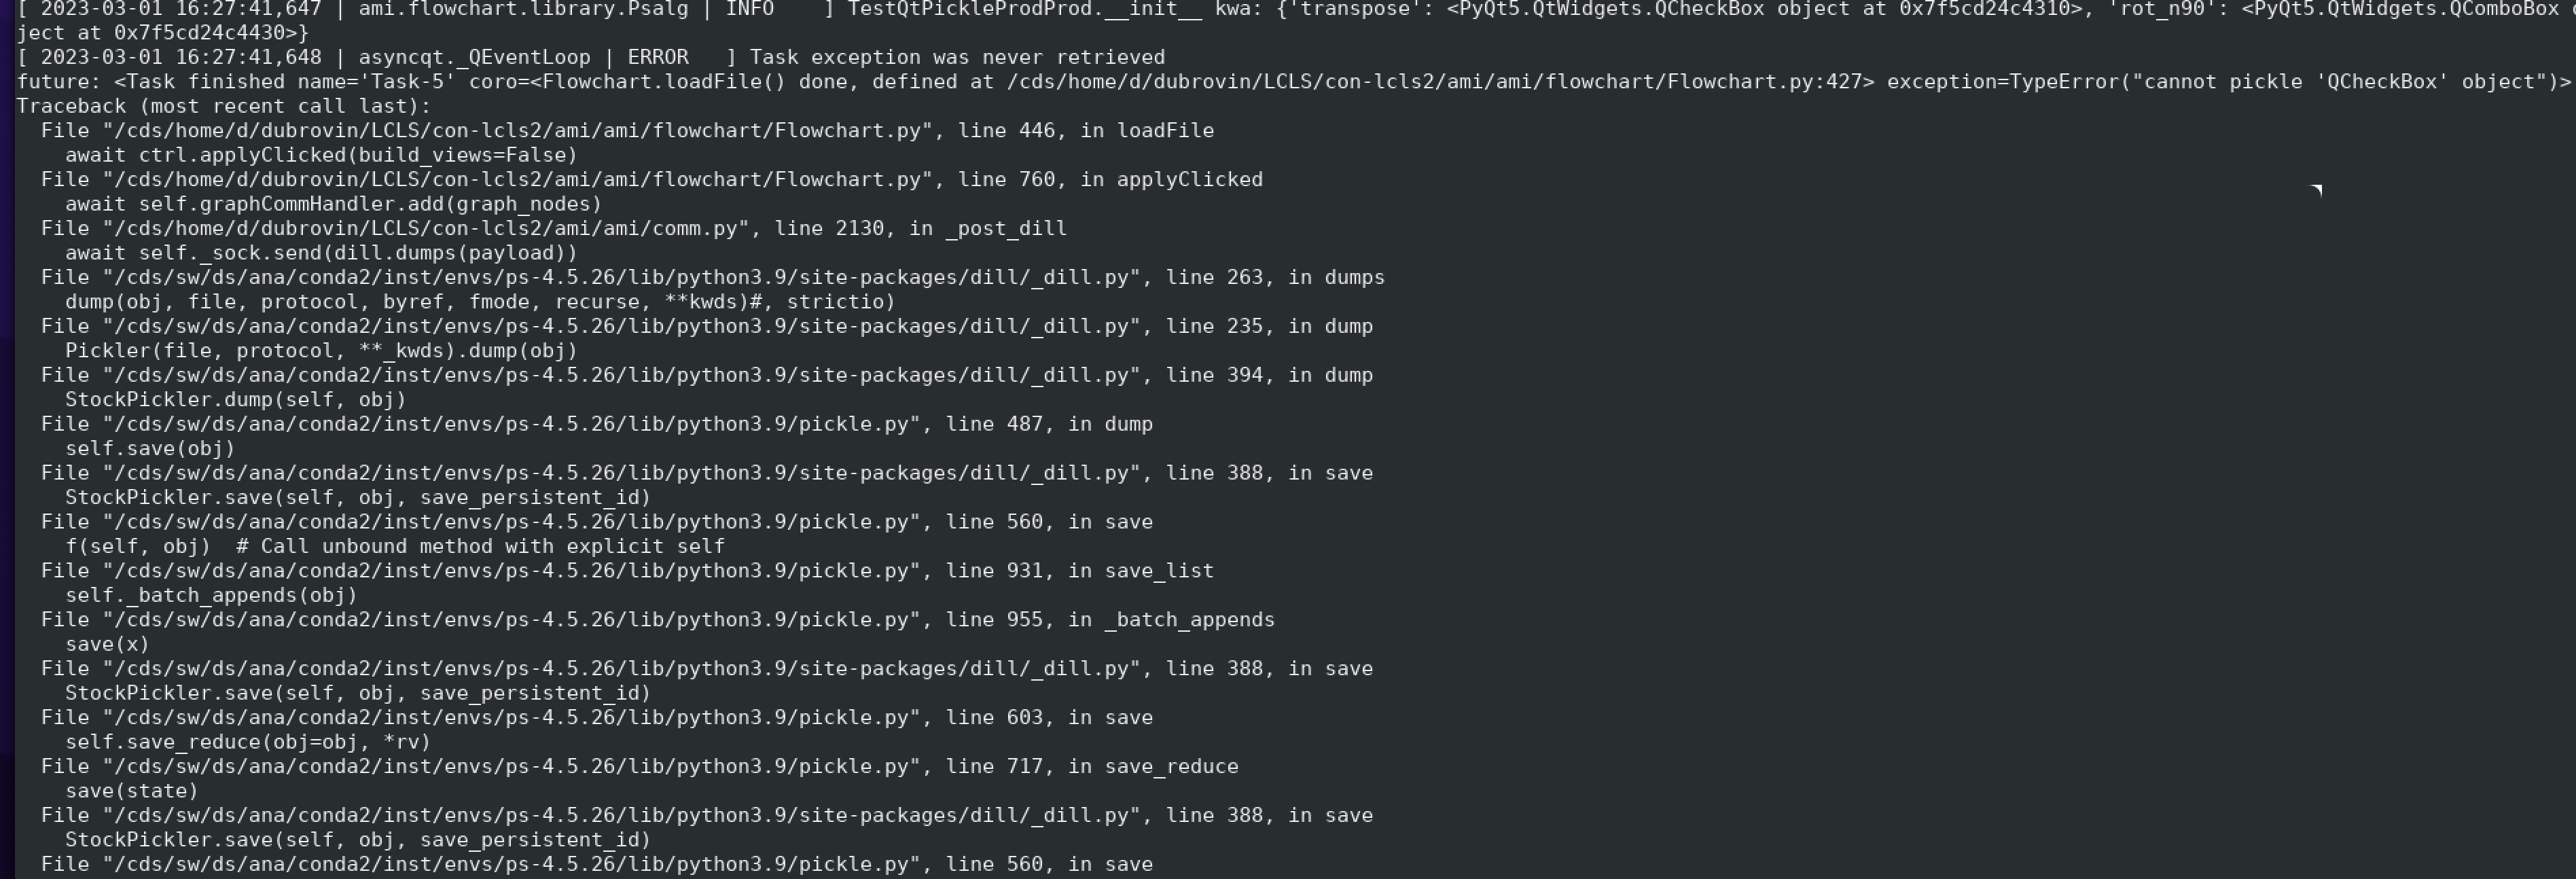
...
PythonEditor for calib components
...
of epix10ka and epixhr detectors
This example shows how to access in ami all internl components of the det.raw.calib(...) method such as calibration constants, per-panel trbit and asicPixelConfig, per-event gain factors and pedestals, mask, common mode correction, etc.
...
| Code Block | ||
|---|---|---|
| ||
# for epixquad - 4-panel epix10ka panels: ami-local -b 1 -f interval=1 psana://exp=ueddaq02,run=569,dir=/cds/data/psdm/prj/public01/xtc # for epixhrsingle 1-panel epixhr: ami-local -b 1 -f interval=1 psana://exp=rixx45619,run=121,dir=/cds/data/psdm/prj/public01/xtc |
...
In this example the PythonEditor box receives input objects for raw (np.ndarray), config, calibconst, accesses and prints call internal components of the det.raw.calib(...) internal components method and returns common mode correction2-d image for one retrieved arrays. For imaging, the 3-d array of common mode correction is converted to 2-d table of segments.
...
Composition of Control Nodes in the examplein the example
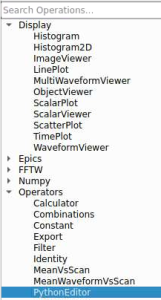
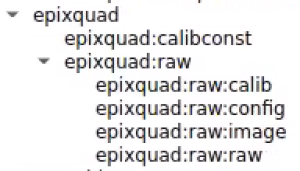
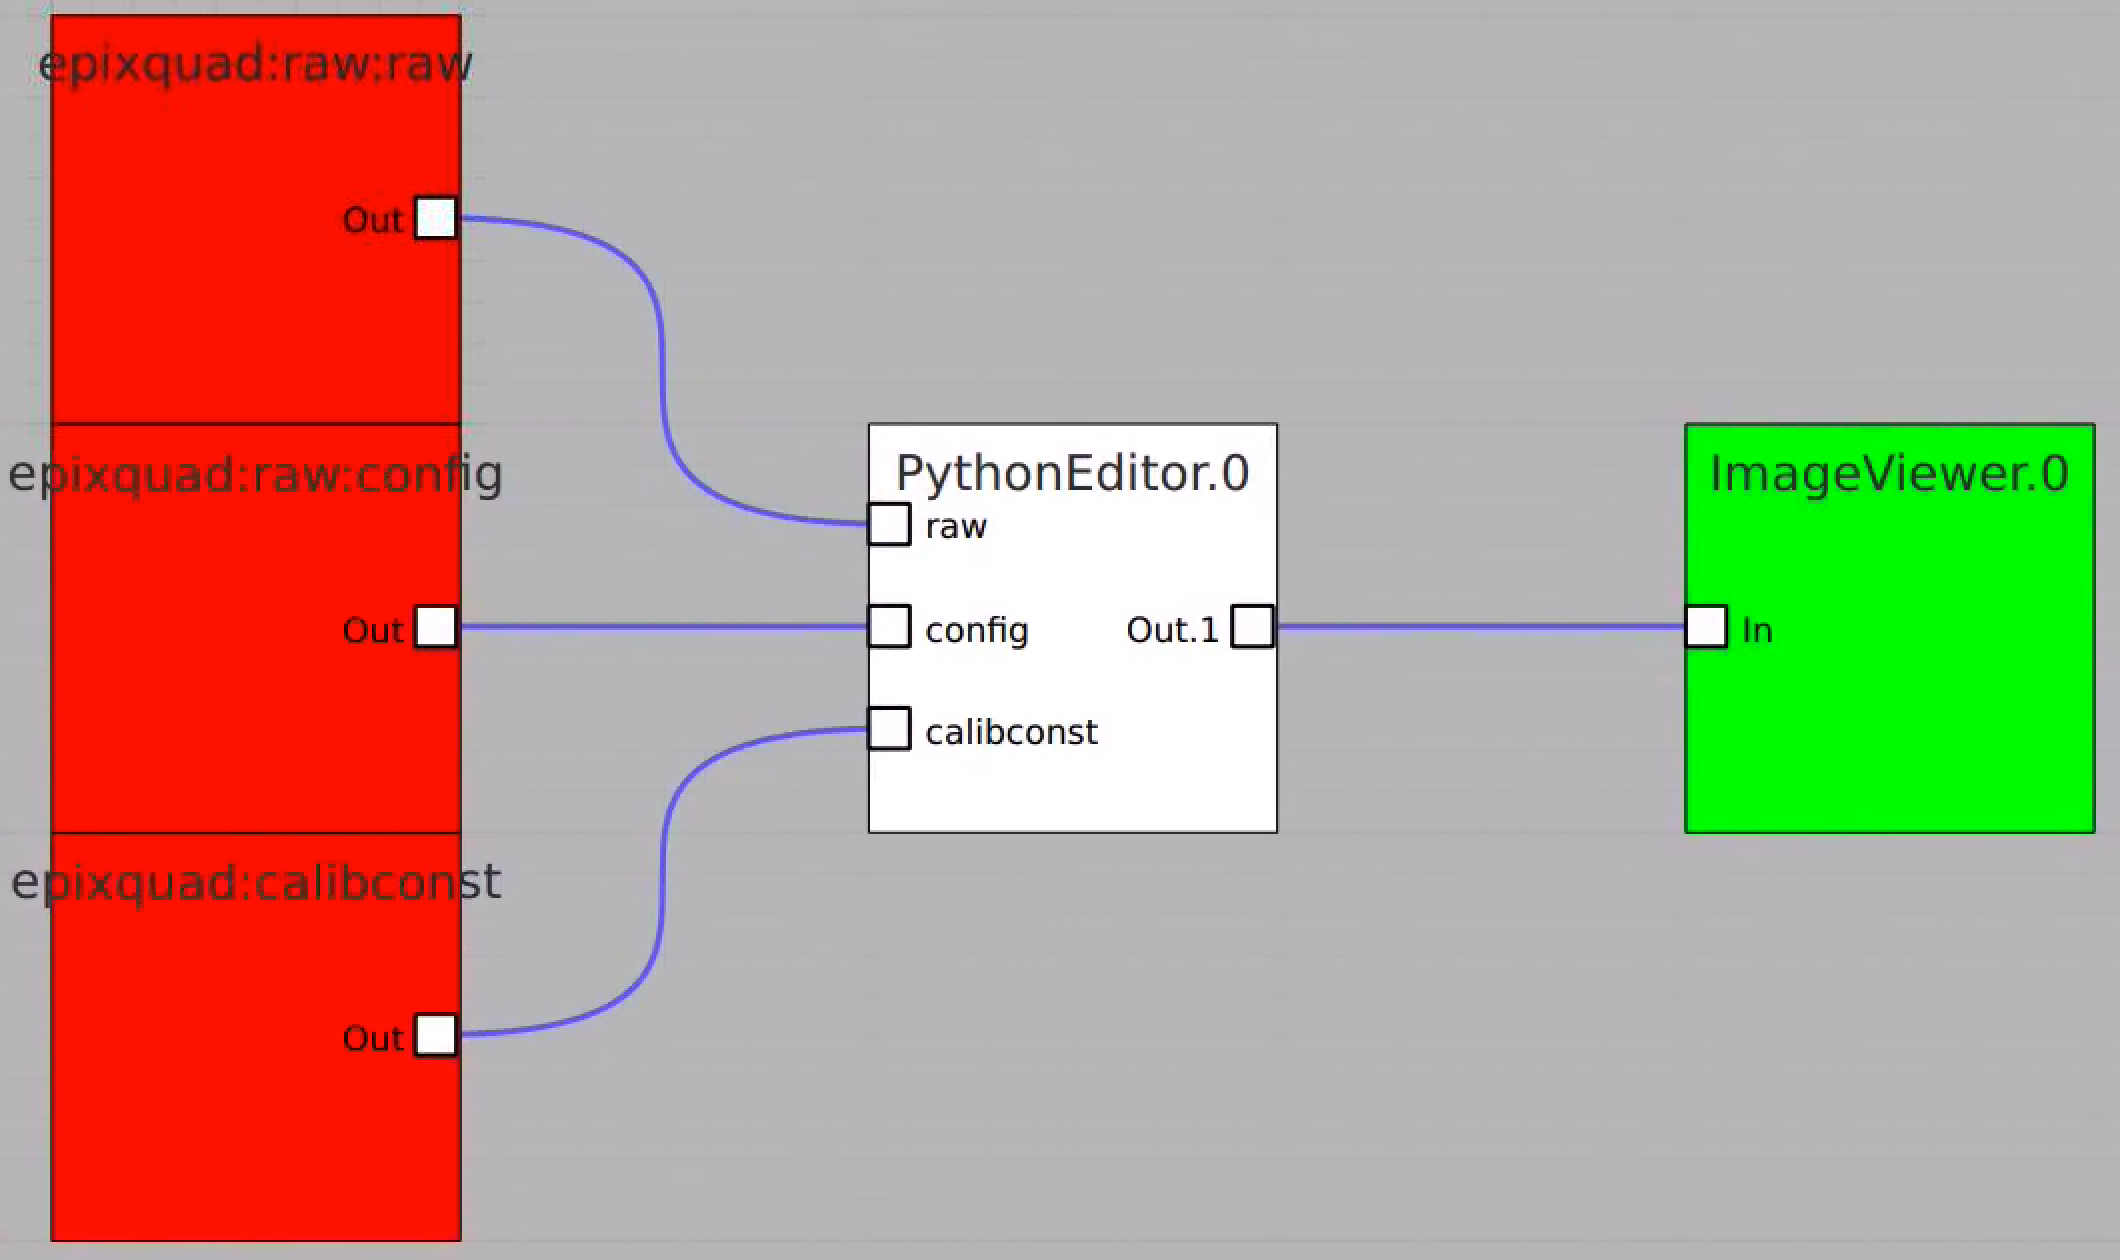
Image for common mode correction and calib1, respectively
Implementation of the class calib_components_epix
- Module detector/utils_calib_components.py will be available in releases grater than ps-4.5.24.
- It is implemented for epix10ka and epixhr detector types.
- Code example is also available in the head of this module.
- Common mode correction methods are not available yet in this example.
...
Test example in psana
Example shows how to initialize and use the calib_components_epix object using parameters retrieved from the detector interface.
This script can be executed in the lcls2 psana environment by the command like
python ./lcls2/psana/psana/detector/test_issues_2023.py 2
...
Overview
Content Tools