...
| Seacom Network Schematic | |
|
|
|
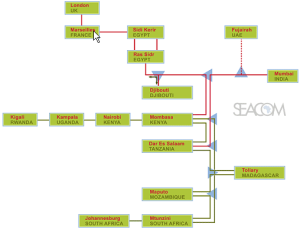
For the interior backbones (or backhauls) associated with these landing points, see here.
...
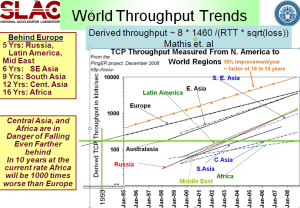
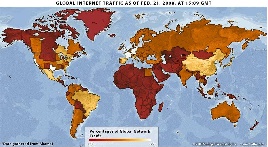
Throughput from SLAC to Regions of the World | Akamai Global Internet Traffic |
|---|---|
|
|
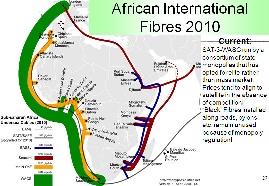
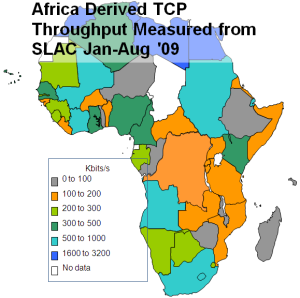
Further, bear in mind that for Africa, Mediterranean countries and South Africa have the better perfomance and E. Africa is the worst off (see the the middle map below). Thus the arrival of a terrestrial submarine fibre cable link to the rest of the world for E. Africa is a very significant development.
The minimum RTTs measured from SLAC to African countries in August 2009 are seen in the map on the right
| Derived Throughput from SLAC to Africa Jan-Aug '09 [ [xlsx | ^africa-thru-aug09.xlsx] | ] MinRTT from SLAC - Aug. 2009 [[xls | ^map-africa-minrtt-aug2009.]] ]]></ac:plain-text-body></ac:structured-macro> | ] | |
|---|---|---|---|---|---|---|
|
|
|
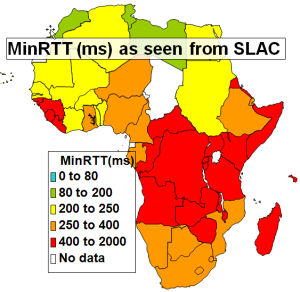
The striking number of countries in Eastern and Central Africa with minimum RTTs of >400ms is indicative that they were using GEO-Stationary (GEOS)satellite links.
...
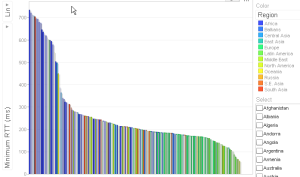
PingER Minimum RTT for Countries of the world in the first half of 2009 | PingER Minimum RTT for African Countries in the first half of 2009 |
|---|---|
|
|
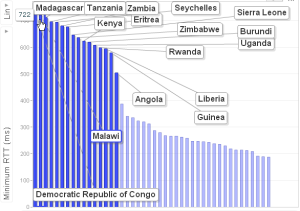
East Africa contains 300M people, yet less than 3% are Internet users (see Internet usage for Africa). Bandwidth in Africa is very expensive. See for example the left hand figure below where it is seen that bandwidth costs for broadband in Sub-Saharan Africa are 30-40 times that in the US. Taken together with the earnings differences, what takes say 15% of a US Gross National Income (GNI) per capita will take over 800% of a Sub-Saharan GNI per capita.
...
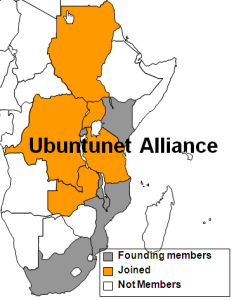
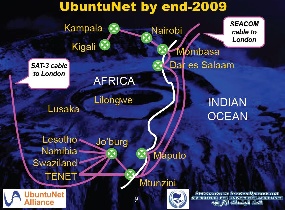
In the past the area has had poor Internet connectivity with heavy use of expensive (in terms of $/Mbps) geostationary satellite connections to the outside world. (see above) In addition most of the traffic between countries made use of expensive international links via Europe and the U.S. rather than more direct connections. There are active movements to create National Research and Education Networks (NRENs) in the area, see for example "Sub-Saharan Africa: An update" by Boubaker Barry. This, together with direct connections between countries will enable more direct peering. These NRENs in turn are peering with the GEANT network in Europe through the Ubuntunet Alliance. The map on the left below shows the state of African NRENs in 2008, the map in the middle shows the Founding Ubuntunet Alliance members and those who have joined since the founding, the figure on the right shows the prediction (in October 2008) for the state of Ubuntunet connections at the end of 2009..
NRENs in Africa | Ubuntunet Alliance | Ubuntunet End 2009, from Duncan Martin |
|---|---|---|
|
|
|
It can be seen that NRENs are being created.
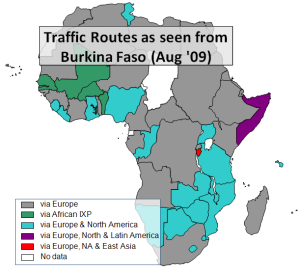
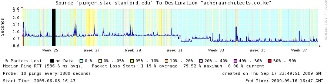
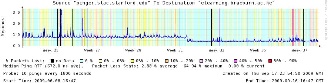
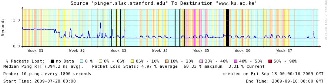
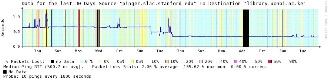
To understand the importance of NRENs and IXPs to reduce the use of intercontinental providers to get between African countries, we can look at the state of direct connections between African countries by measuring the traceroutes within Africa. Below on the left and in the middle are the routes taken from South Africa to other African countries in September 2005 and August 2009 and on the right the routes from Burkina Faso to other African countries in August 2009. In the middle map countries which were only accessible by satellite have horizontal shading lines.
<ac:structured-macro ac:name="unmigrated-wiki-markup" ac:schema-version="1" ac:macro-id="40380468-09da-4018-9351-1fdfea727818"><ac:plain-text-body><![CDATA[ | Routing from South Africa to African Countries (Sep '05) | Routing from South Africa to African Countries (Aug '09) [ [xls | ^routing-africa-aug2009.xls] | ] Routing from Burkina Faso to African Countries (Aug '09) [[xls | ^routing-africa-aug2009.09) [xls] | ] ]]></ac:plain-text-body></ac:structured-macro> | ||
|---|---|---|---|---|---|---|---|---|
|
|
|
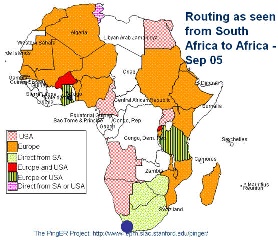
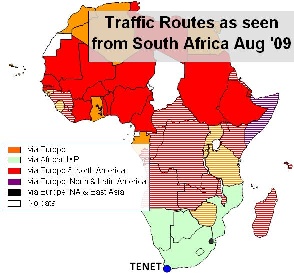
In September 2005 most traffic from South Africa to the rest of Africa took costly international links, only Botswana and Zimbabwe had direct routes. The situation has improved recently as direct routes from South Africa to Namibia and Botswana were added. More details on the routes to African countries from several measurement points around the world measured in Spring 2009 can be seen in a spreadsheet of African routing and inferences.
...
One would expect with the use of a terrestial fibre rather than a geo-stationary satellite that the minimum RTT woud be reduced from >=400ms to 200-300ms as seen from the US. Also the reduced congestion enabled by the higher speed links should make the average RTT more stable and reduce the packet loss. Below are shown the average RTTs and losses from SLAC on the West Coast of the US to various hosts on the East Coast of Africa. These are all measured using the PingER project's data.
| acheraarchitects.co.ke | loans.co.ke | elearning.braeburn.ac.ke |
|---|---|---|---|
Kenya |
|
|
|
| www.micti.co.mz | www.uem.mz |
|
Mozambique |
|
|
|
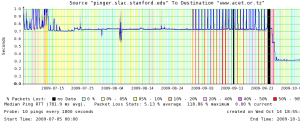
| www.muchs.ac.tc | www.6telecoms.co.tz | www.acet.or.tz |
Tanzania |
|
|
|
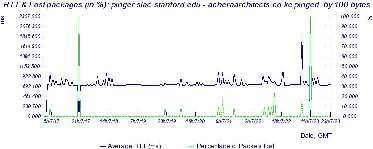
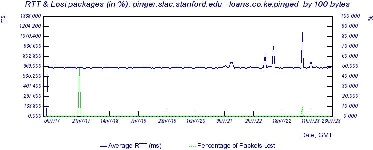
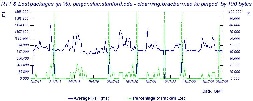
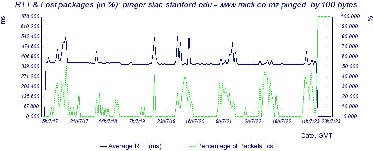
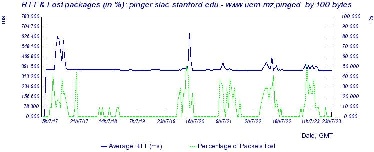
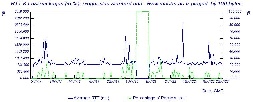
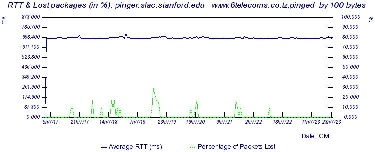
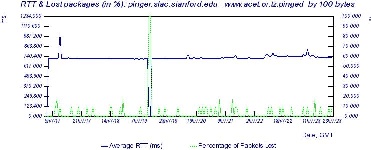
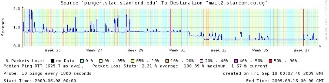
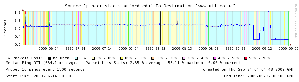
It is apparent we do not observe any dramatic reduction in RTT on July 23rd. We also looked at the PingER recorded RTT from ICTP Trieste, Italy to a host in Tanzania in case the routes from SLAC were still using satellite while those from Italy were not. We also looked at the RTT seen from a TENET host in cape Town South Africa to a host in Mozambique. In this case (see below) the RTTs have long been << 400ms so they already were not using geostationary satellite to connect the sites.
www.muchs.ac.tz From Trieste | www.micti.co.mz from Cape Town |
|---|---|
|
|
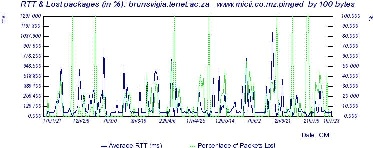
Again there is no dramatic reduction. looking at the TENET to www.micti.co.mz RTTs it is apparent that there is a direct (non geo-stationary) satellite connection between the two sites since the RTT << 400ms.
...
From SLAC, we pinged hosts at each of these organizations, the Round Trip Time (RTT) results in msec. are shown below: For the # pings with an asterisk the host did not respond to pings so we used synack to probe the web server:
Country | Organization | Host | # pings | Min RTT | Avg RTT | Max RTT | Std dev | Loss |
|---|---|---|---|---|---|---|---|---|
Tanzania | Tanzania railways | www.trctz.com | 100 | 764 | 790 | 893 | 19.5 | 0% |
Tanzania | Tanzania Telecommunications Company | www.ttcl.co.tz | 100* | 714 | 721 | 730 | 4.3 | 1% |
Tanzania | University of Dar Es Salaam | www.udsm.ac.tz | 151 | 696 | 711 | 1130 | 45 | 0% |
Tanzania | University of Dodoma | www.udom.ac.tz | 100* | 753 | 783 | 845 | 18 | 0% |
Tanzania | Tanesco National Electric Company | www.tanesco.com | 49 | 12.6 | 12.997 | 13.53 | 0.251 | 0% |
Kenya | Kenyatta University | www.ku.ac.ke | 138 | 650.138 | 652.36 | 668.44 | 1.97 | 2% |
The host www.tanesco.com is probably a proxy located somewhere in the Western US. The other hosts all have minimum RTTs of well over 400ms which indicates they are probably still using a geo-stationary satellite.
...
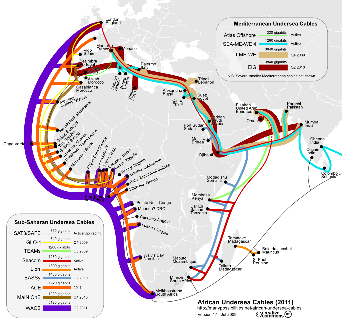
I googled MORENET Mozambique and came up with morenet.mct.gov.mz. However it does not respond to pings. It does respond to synack on port 80 (www) and the response time to a trivial request is ~368ms so it may have already moved over. However GeoIPTool (see http://www.geoiptool.com/en/?IP=morenet.mct.gov.mz) says it's in Buenos Aires which I do not believe. Visualroute's (at http://visualroute.visualware.com/) tests fail. Looking at the traceroute from SLAC and using GeoIPTool to locate the nodes , it appears that on leaving the US the route goes directly from the West Coast of the US (Sunnyvale) through Buenos Aires (node telkomsa.ge9-16.br02.ldn01.pccwbtn.net 152ms) then to Pretoria (rrba-ip-lir-1-pos-1-0-4.telkom-ipnet.co.za 352 ms) and then to Mozambique. This it is not currently using the new fibreoptic fibre optic cable running South down the E. African coast. Looking at a map of the world's undersea fibre cables in the region may help explain this.
...
acheraarchitects.co.ke | ealearning.braeburn.ac.ke | www.ku.ac.ke from SLAC | library.uonbi.ac.ke 3 Aug - Sep 9, '09) |
|---|---|---|---|
|
|
|
|
www.acet.or.tz |
|
|
|
|
|
|
|
mail2.starcom.co.ug from SLAC | www.utl.co.ug from SLAC | Ugandatelecom.ug from SLAC |
|
|
|
|
|
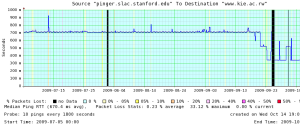
www.kie.ac.rw from SLAC |
|
|
|
|
|
|
|
Zambia
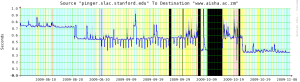
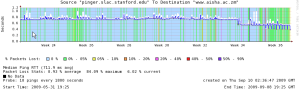
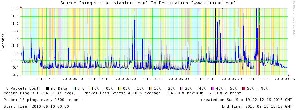
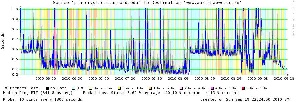
One host (www.aisha.ac.zm) of the 6 monitored in Zambia improved its RTT from about 720ms to 550ms on August 20, 2009 (see below). THey then spent many days moving the link over to the terrestrial lines. During this time the performance was very unstable (high losses) and there were big changes in RTT. It is probable the link in one direction was using a GEOS while the other was an all terrestrial link and the large dips to 400ms were when both legs were using terrestrial links. We believe the terrestrial path goes via Botswana and Namibia. The traceroute from SLAC on 9/9/09 appeared to use a satellite link in at least one direction. THe The final cutover to terrestrial linkis in both directions appears to have been made on October 23rd when the RTT drpped dropped to ~350ms and the link appeared more stable. On October 2, 2009 Mike Jensen reported that thetraceroute from Rome to www.aisha.ac.zm on Oct 2, 2009 from Rome was well below 450ms and thus appears to be a terrestrial link. However the tracreoute from SLAC was still taking over 550ms. Also thetraceroute from TENET/Cape Town South Africa to www.aisha.ac.zm took over 650ms. The traceroute from NUST, Islamabad, Pakistan to mail.unza.zm takes less than 450ms and appears to be a terrestrial path going via Namibia. On October 7th 2009 the traceroute from SLAC to mail.unza.zm appeared to be terrestrial and went via Namibia.
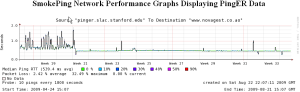
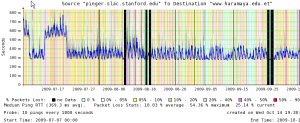
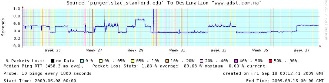
Angola: www.novagest.co.ao | Ethiopia: www.haramaya.edu.et | Namibia: www.adsl.com.na | |
|---|---|---|---|
|
| | |
Zambia: www.aisha.ac.zm |
|
| |
|
|
|
|
Zimbabwe
There is some evidence that at least one host in Zimbabwe (www.africau.edu) may have activated a terrestrial route around June 18th 2010, see the graph below. Around that date the RTT dropped from 550 ms to about 400ms, however it went up again around August 12th 2010. Similar results are seen for a second Zimbabwean host www.zimbabweaazimbabwe.co.zw, suggesting a common access route between them and SLAC.
Seen from ITCP TRieste Italy
...
mail2.starcom.co.ug from ICTP | www.ku.ac.ke from ICTP |
|---|---|
|
|
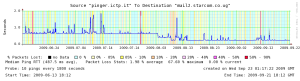
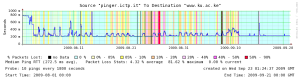
Though we show several time series of median RTT for hosts in various countries which have converted from GEOS to landlines, in all the countries above there are still hosts that are connected via GEOS.
...
The table below shows the number of hosts monitored from SLAC in the country and the number of those that used a terrestrial path as of a particular date.
|
|
| Monitored | Terresrial |
|
|
|
|---|---|---|---|---|---|---|---|
| Oldest Measured Data | 1st observed conversion | 10/17/09 | 10/17/09 |
|
|
|
Angola | Oct 2006 | May 19, 2009 | 3 | 1 |
|
|
|
Botswana | Apr 2009 | None | 3 | 2 |
|
|
|
Ethiopia | Nov 2008 | June 9, 2009 | 7 | 1 |
|
|
|
Kenya | Feb 2005 | Aug 2, 2009 | 6 | 5 |
|
|
|
Lesotha | Feb 2005 | None | 2 | 2 |
|
|
|
Madagascar | Dec 2003 | None | 2 | 0 |
|
|
|
Malawi | Mar 2005 | None | 3 | 0 |
|
|
|
Mozambique | Dec 2003 | May 2007 | 2 | 0 |
|
|
|
Namibia | Feb 2007 | ? | 2 | 1 |
|
|
|
Rwanda | Mar 2005 | Oct 17, 2009 | 3 | 1 |
|
|
|
South Africa | Feb 2005 | None | 14 | 12 |
|
|
|
Swaziland | Oct 2007 | Feb 2009 | 3 | 1 |
|
|
|
Tanzania | Dec 2003 | Sep 26, 2009 | 5 | 1 |
|
|
|
Uganda | Nov 2003 | Aug 3, 2009 | 3 | 2 |
|
|
|
Zambia | Feb 2009 | Aug 20, 2009 | 6 | 1 |
|
|
|
Zimbabwe | Feb 2007 | None | 5 | 0 |
|
|
|
Other Regions in Sub-Saharan Africa
...
How to Cross the Digital Divide, Rwanda-Styleprovides an interesting case study of how Rwanda has been able to somewhat bridge the digital divide in a methodological manner.
Celebrating ten years of the Ubuntunet Alliance, Oct 2015
Internet prices to fall with surge in clients
...