Page History
Content
| Table of Contents |
|---|
Phi-beta fit functions
Two solutions of quadratic equation in ARC region
- POS: y = -B + sqrt(B*B-C)
- NEG: y = -B - sqrt(B*B-C)
Arc region
pyimgalgos/src/FiberAngles.py
y = funcy_l1_v1(x, phi_deg, bet_deg, DoR=390/913.27, sgnrt=1.) # or ... sgnrt=-1.)
wide range of x:
narrow range of x:

- For POS root: beta=-13.3 gives minimal y.
- If two measured peaks are located below this curve then B*B-C < 0, fit returns limit value of beta or not converging.
- Two solutions for beta -17 and -9 - x and y are the same.
- NEG-ative root gives wrong curvature
Equatorial region
pyimgalgos/src/FiberAngles.py
y = funcy_l0(x, phi_deg, bet_deg)
Problem with two roots is resolved for EQU region; sign of the root is selected the same as sign of parameter B;
- For |beta|>~48 solution does not exist for entire range of x
Fit in the processing script
Example of Here we discuss how to apply fit to data using absolute errors on peak position, get fit parameters with errors, estimate fit quality.
Data
exp=cxif5315:run=169
Processing script
cxif5315/proc-cxif5315-r0169-peaks-from-file-v4.py, v5, v6
| Code Block | ||
|---|---|---|
| ||
from scipy.optimize import curve_fit
from scipy.stats import chi2

        xn = np.array([pk.x/L for pk in sp.lst_equ_evt_peaks], dtype=np.double)
        yn = np.array([pk.y/L for pk in sp.lst_equ_evt_peaks], dtype=np.double)
        en = np.array([pk.csigma*sp.PIXEL_SIZE/L for pk in sp.lst_equ_evt_peaks], dtype=np.double)
        #en = np.array([max(pk.rsigma,pk.csigma)*sp.PIXEL_SIZE/L for pk in sp.lst_equ_evt_peaks], dtype=np.double)

        p0 = [-3.2,-16.0] # phi, beta angle central values

            popt, pcov = curve_fit(funcy, xn, yn, p0, en, absolute_sigma=True)

            sp.fib_chi2 = np.sum(((funcy(xn, *popt) - yn) / en)**2)
            sp.fib_ndof = len(xn) - 1
sp.fib_prob = chi2.sf(sp.fib_chi2, sp.fib_ndof, loc=0, scale=1) |
Parameters
Phi-beta fit results and quality
Data: peak list selected by Meng
- exp=cxif5315:run=169
...
- Distribution of parameters for peaks
...


- selected by Meng:
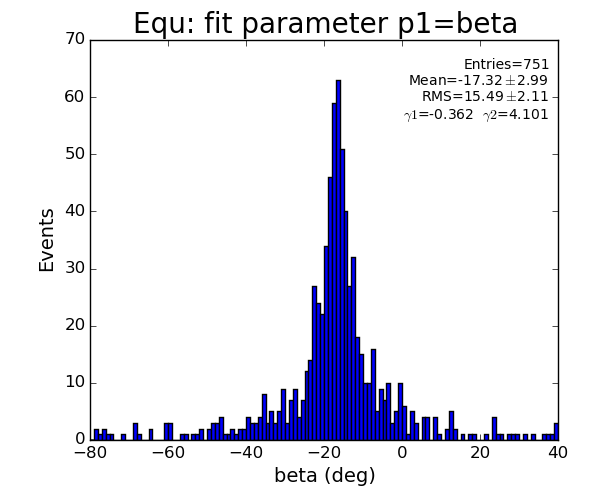
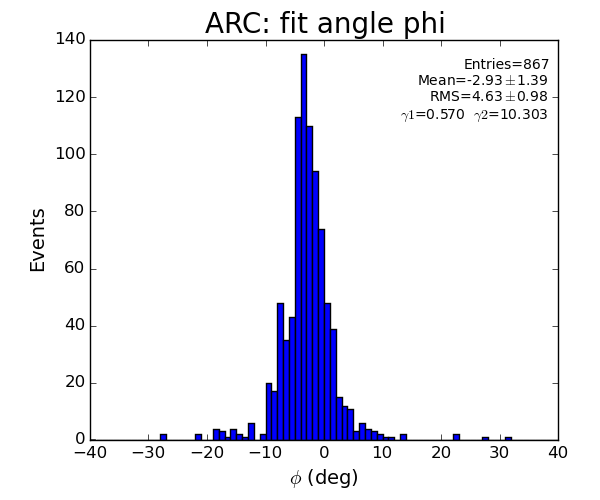
EQU region


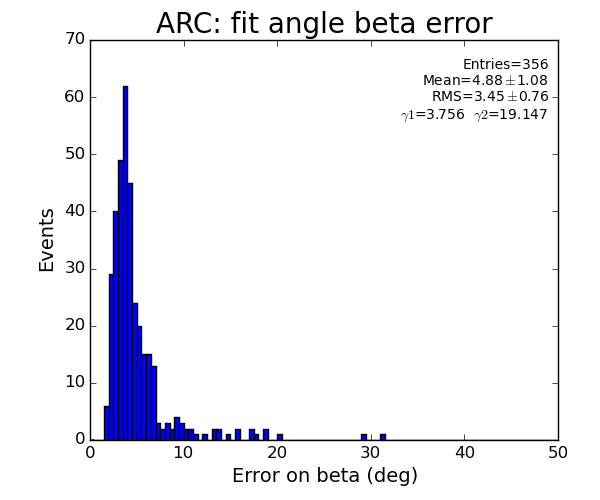
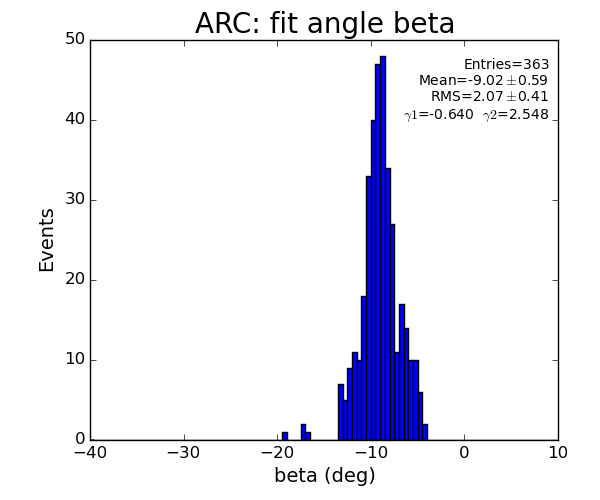
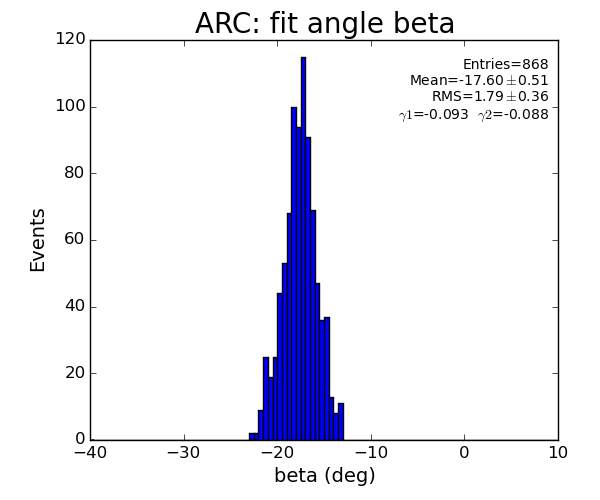
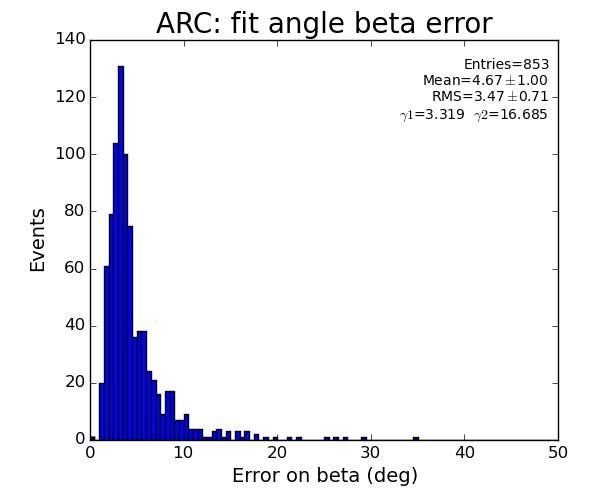
ARC region: 1-st solution for beta (positive root)


ARC region: 2-nd solution for beta (positive root)


For 2-peak events fit does not have any freedom - curve can exactly be fitted to 3 points (including origin); chi2=0 and probability is always 1.
For >2-peak events chi2 and probability show some distribution.
Data: peak list after pfv2r1
EQU region


ARC region


Peak list with phi-beta fit results
After phi-beta fit peaks are saved in the file with name like
result/peak-fit-cxif5315-r0169-2016-04-04T16:16:38.txt
Comparing to regular peak parameters this file has extended data for each peak by
References
| Code Block |
|---|
...  fit-phi fit-beta  phi-err  beta-err  fit-chi2  ndof  fit-prob
...     1.30  -42.98  3.800454 10.236941  0.000000     1  1.000000
... -4.75 -23.85 0.265462 1.212093 1.734365 3 0.629321 |
| Note |
|---|
To load this file use helper classes |
References
...
Overview
Content Tools