This content is now displayed in the following page, which is password-protected:
FOT Plots
(Joe Eggen) The following plots were provided by the Flight Operations Team. Re-posting them here for convenience. Note that the numbering of GBM detectors starts at zero.
FSSC Plots
(JE) The following plots were made using GBM temperature data provided by the FOT and FT2 files created by the FSSC during mission planning.
Note: as-flown FT2 files contain data gaps coinciding with SAA passages. Since the differences between the predicted vs. as-flown FT2 files are normally very small, I just used the predicted files here.
Notes Regarding Plots
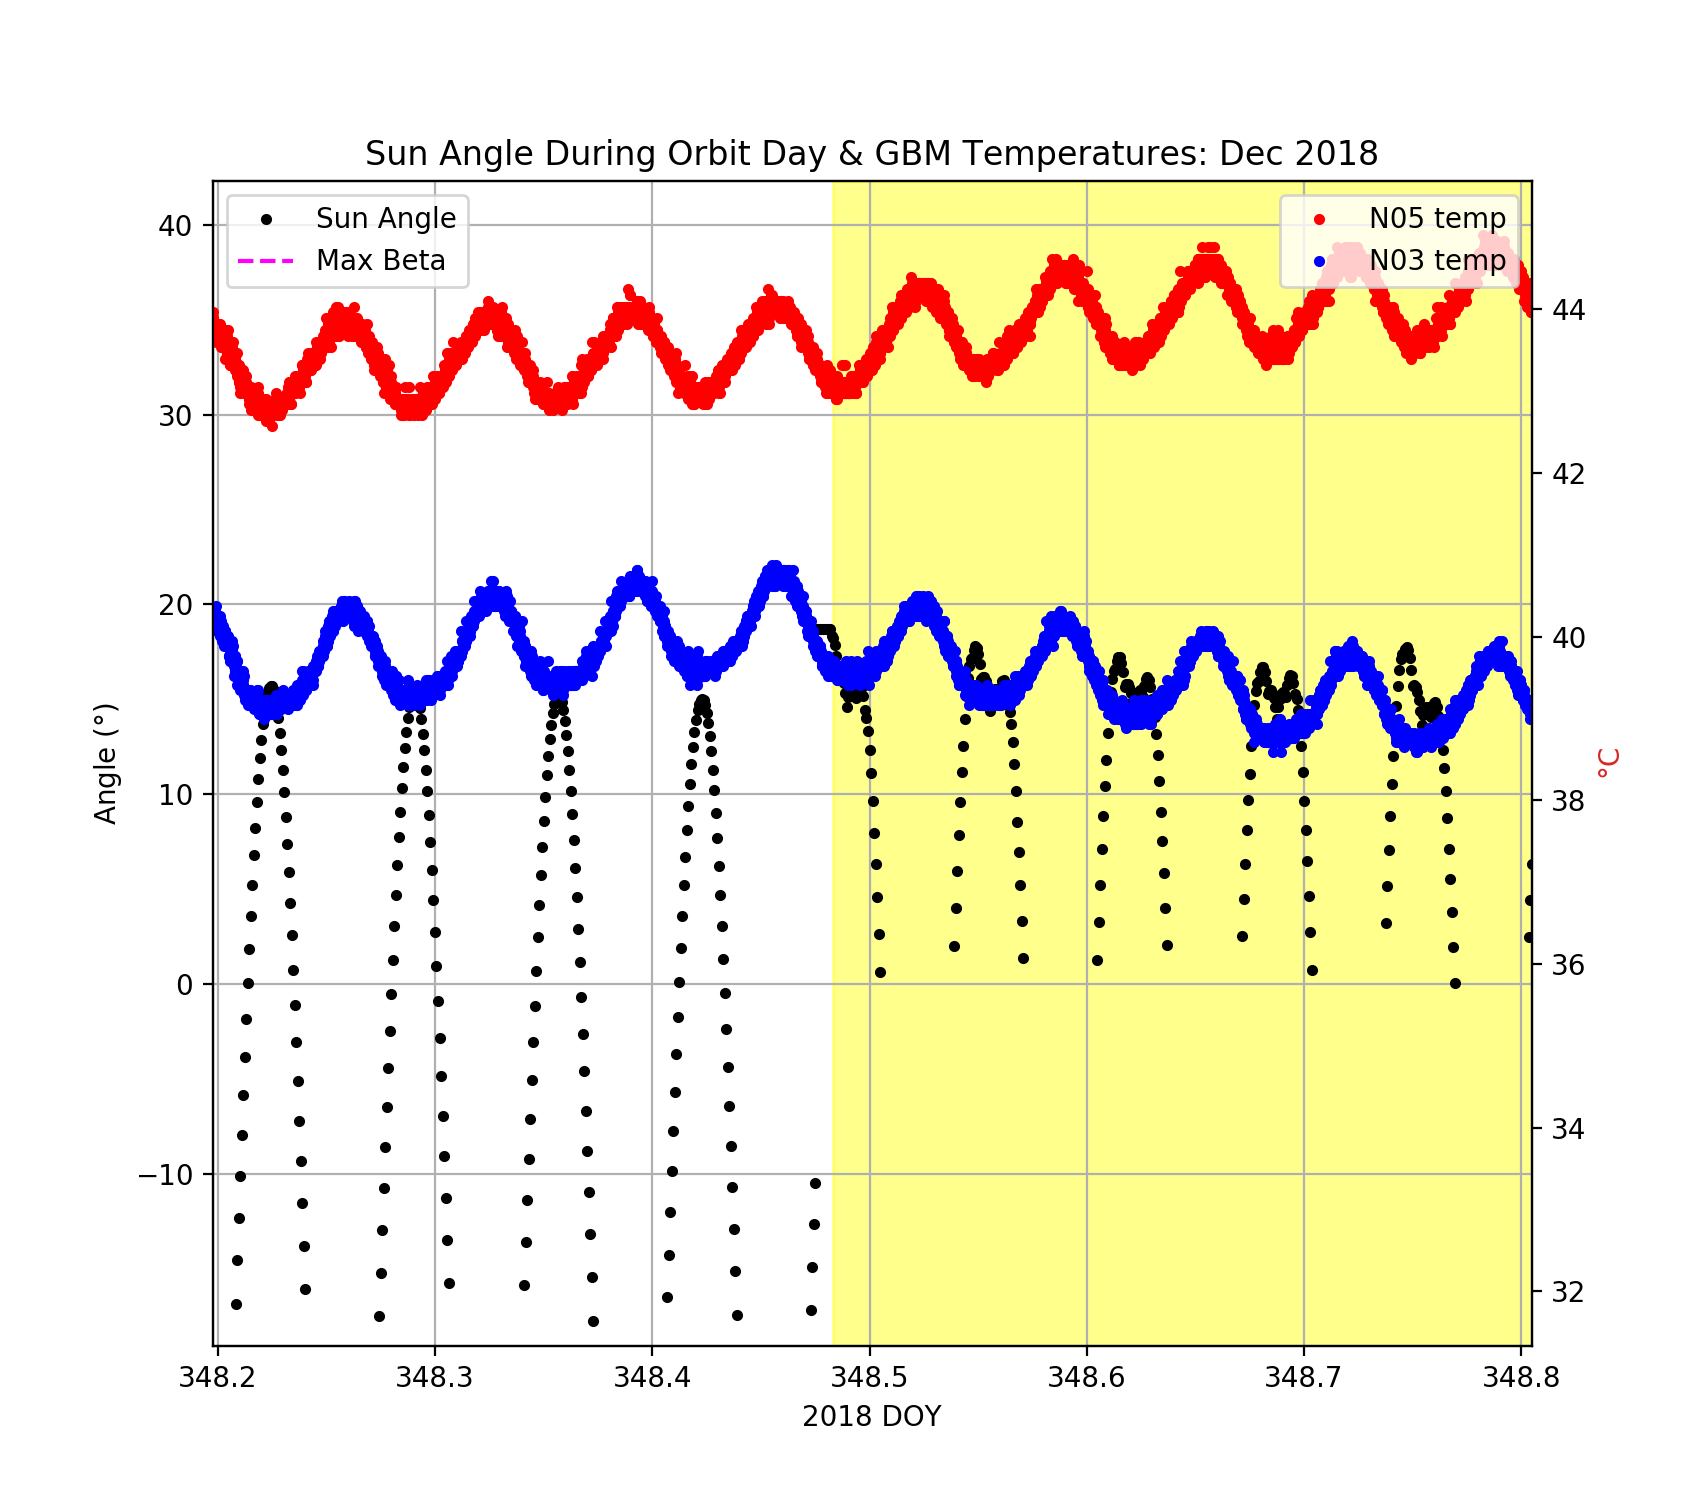
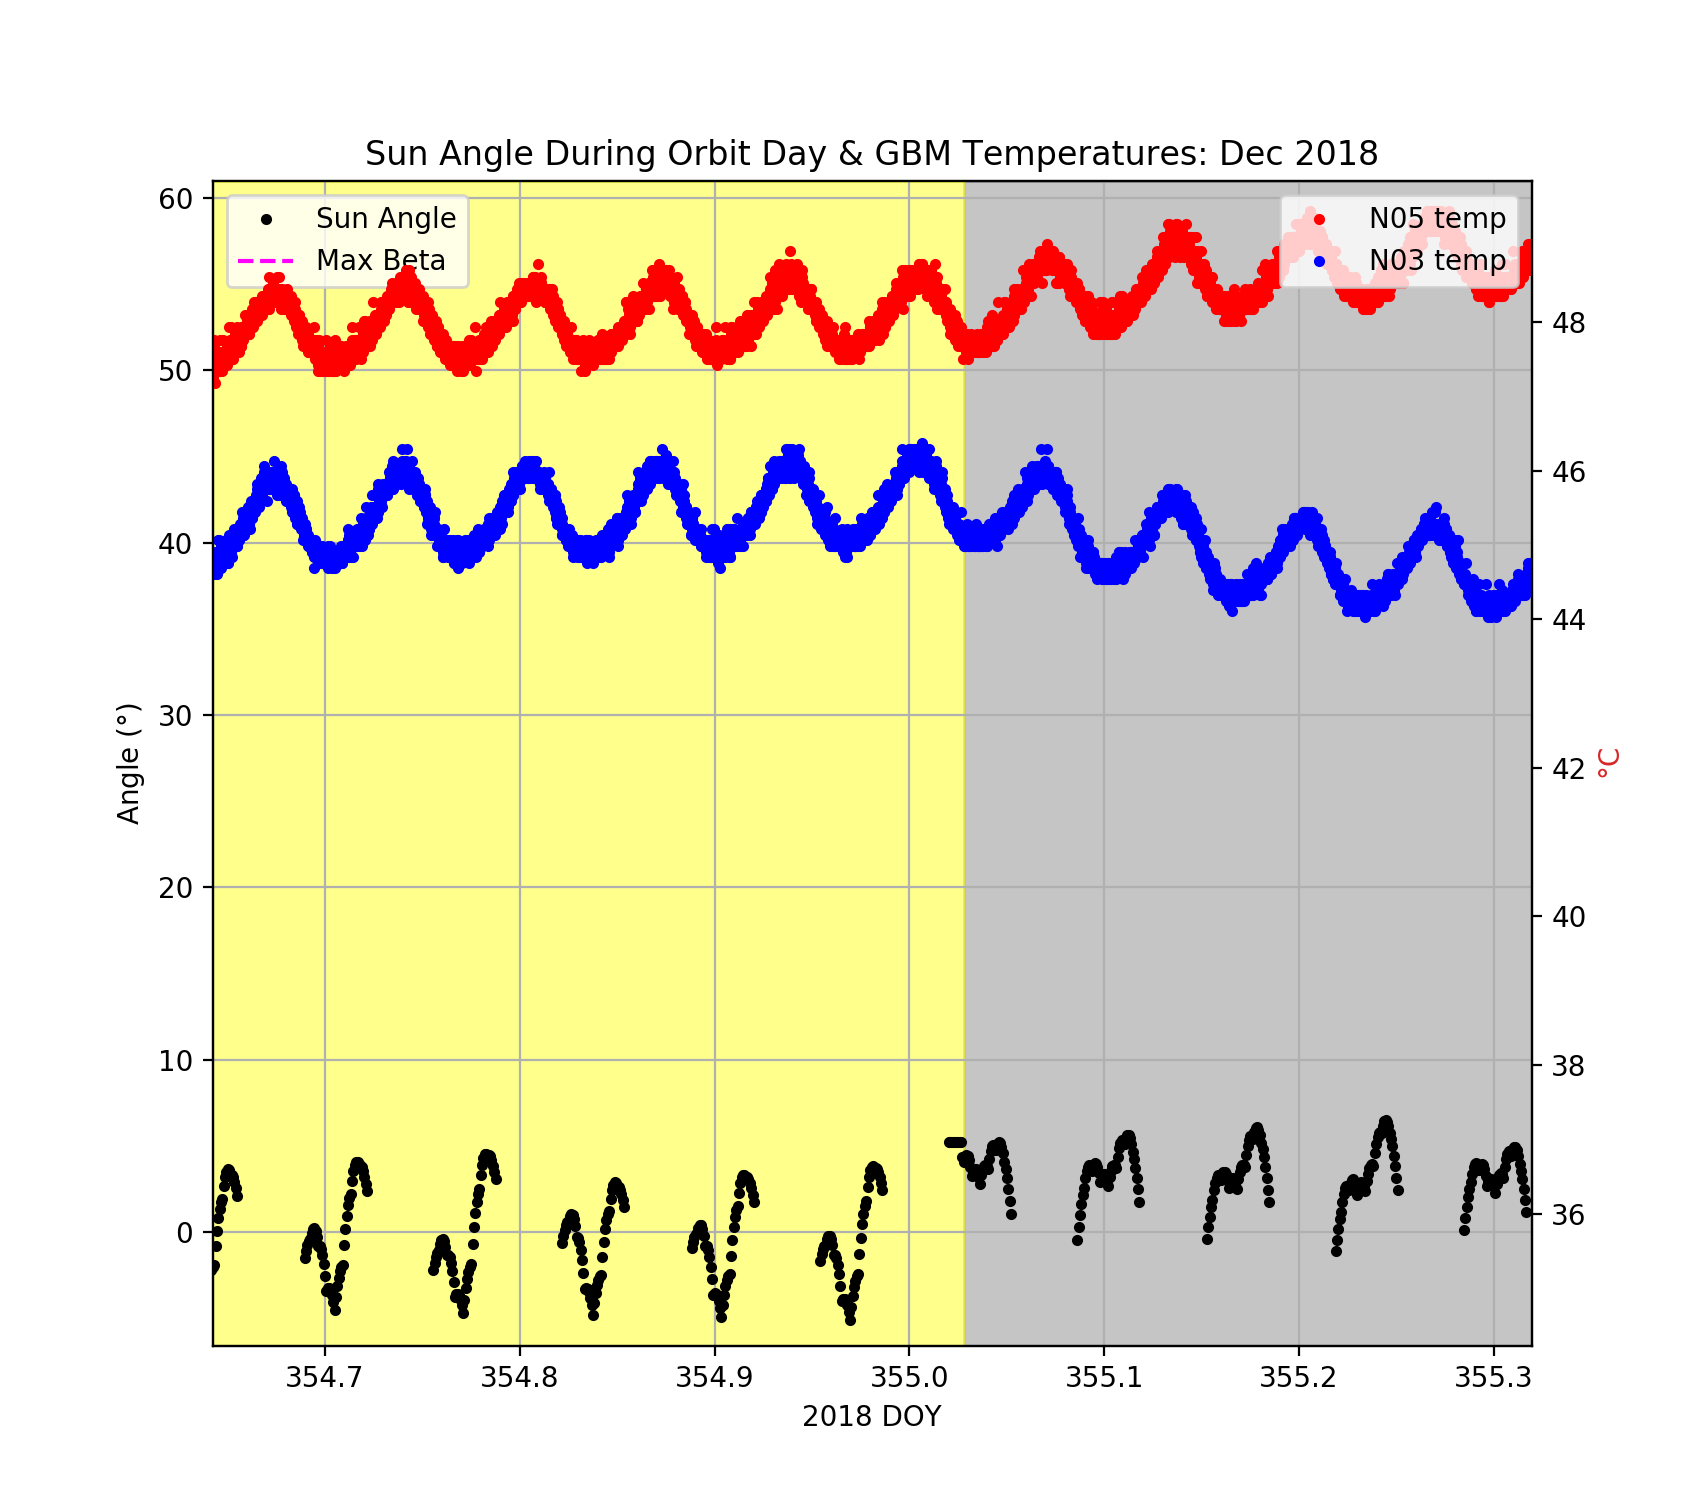
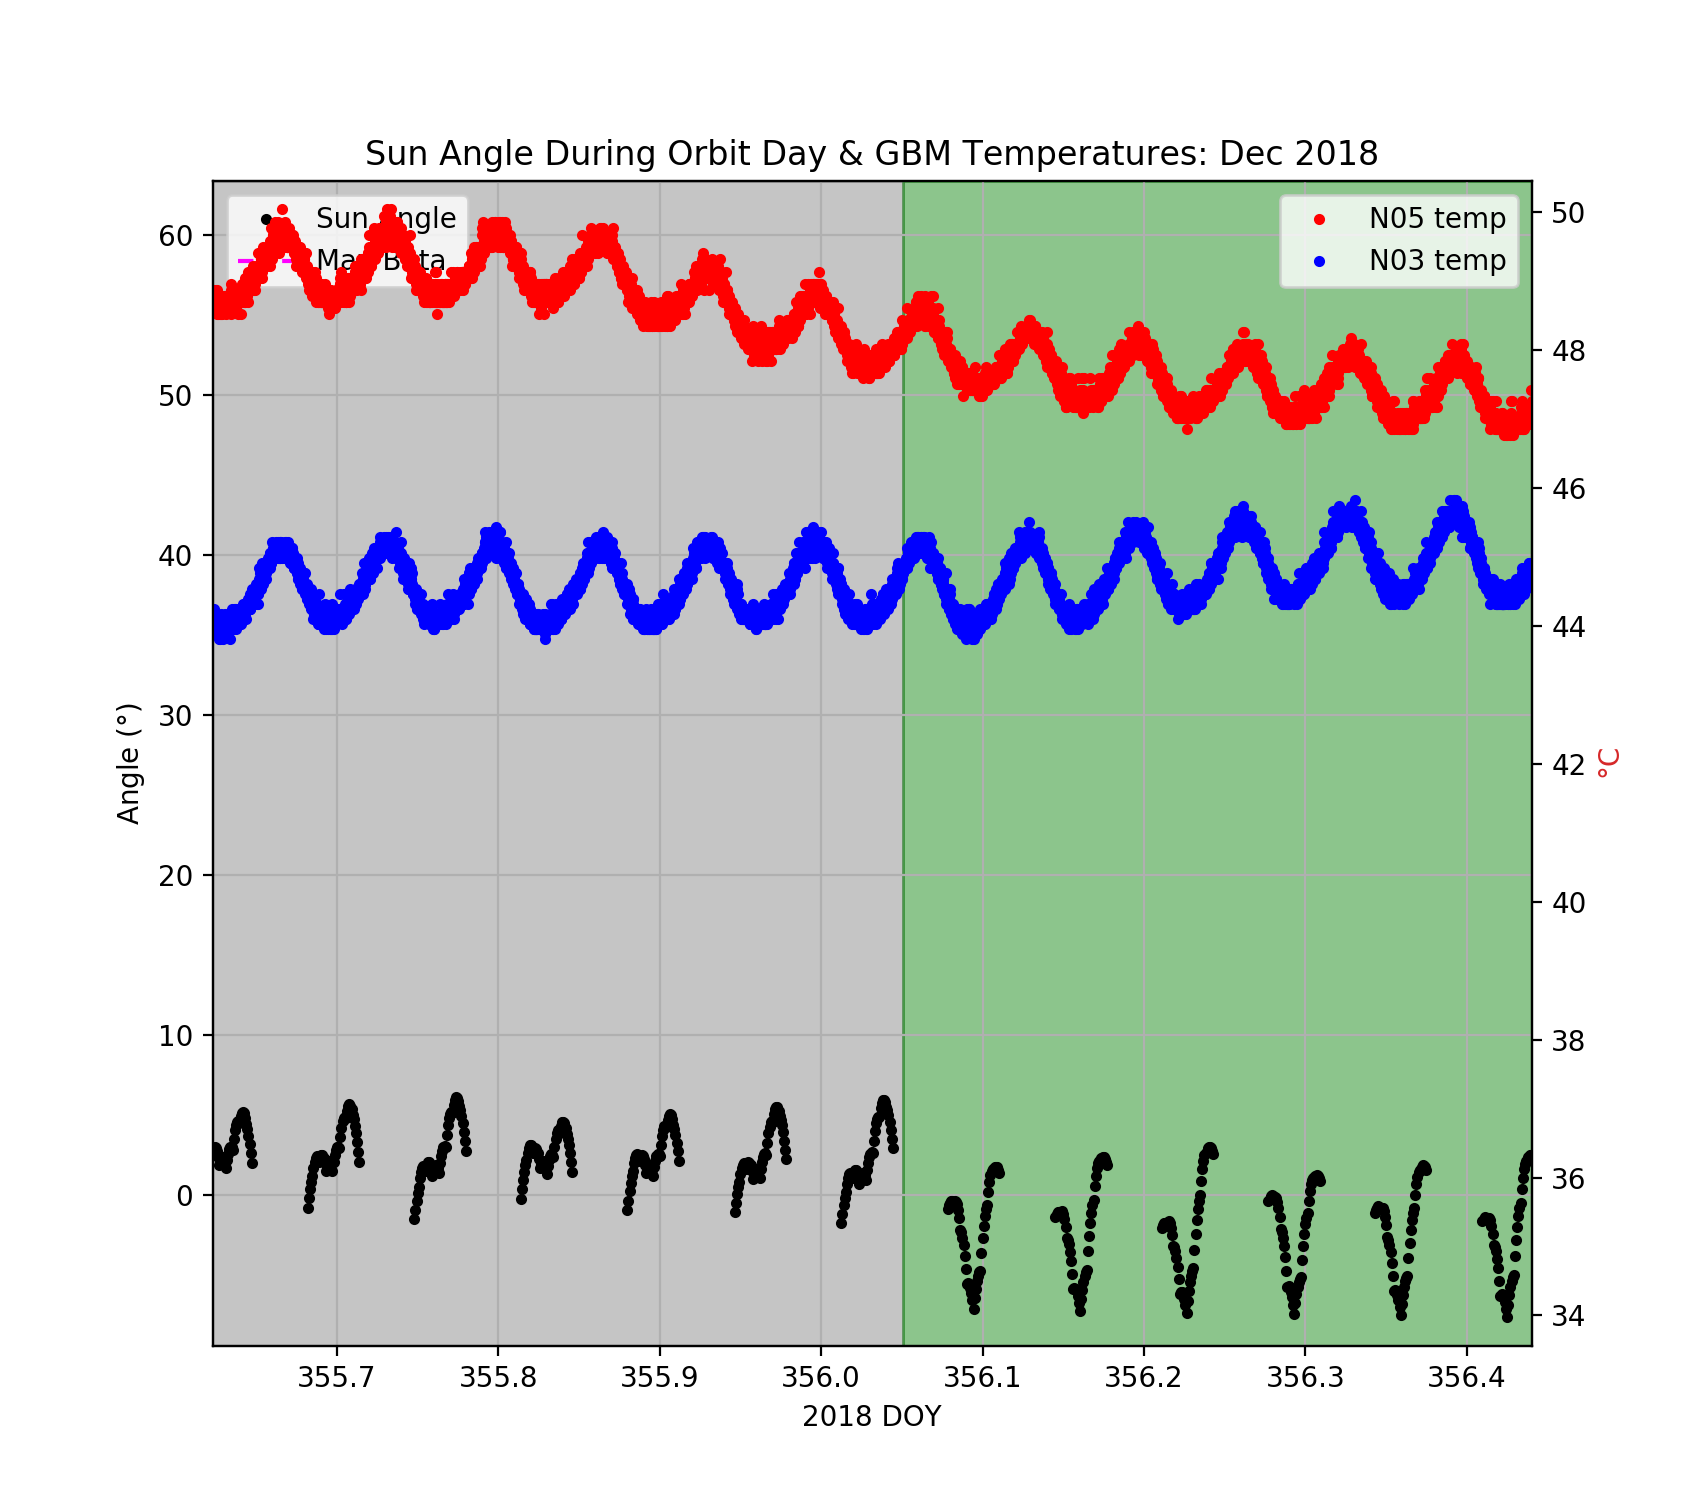
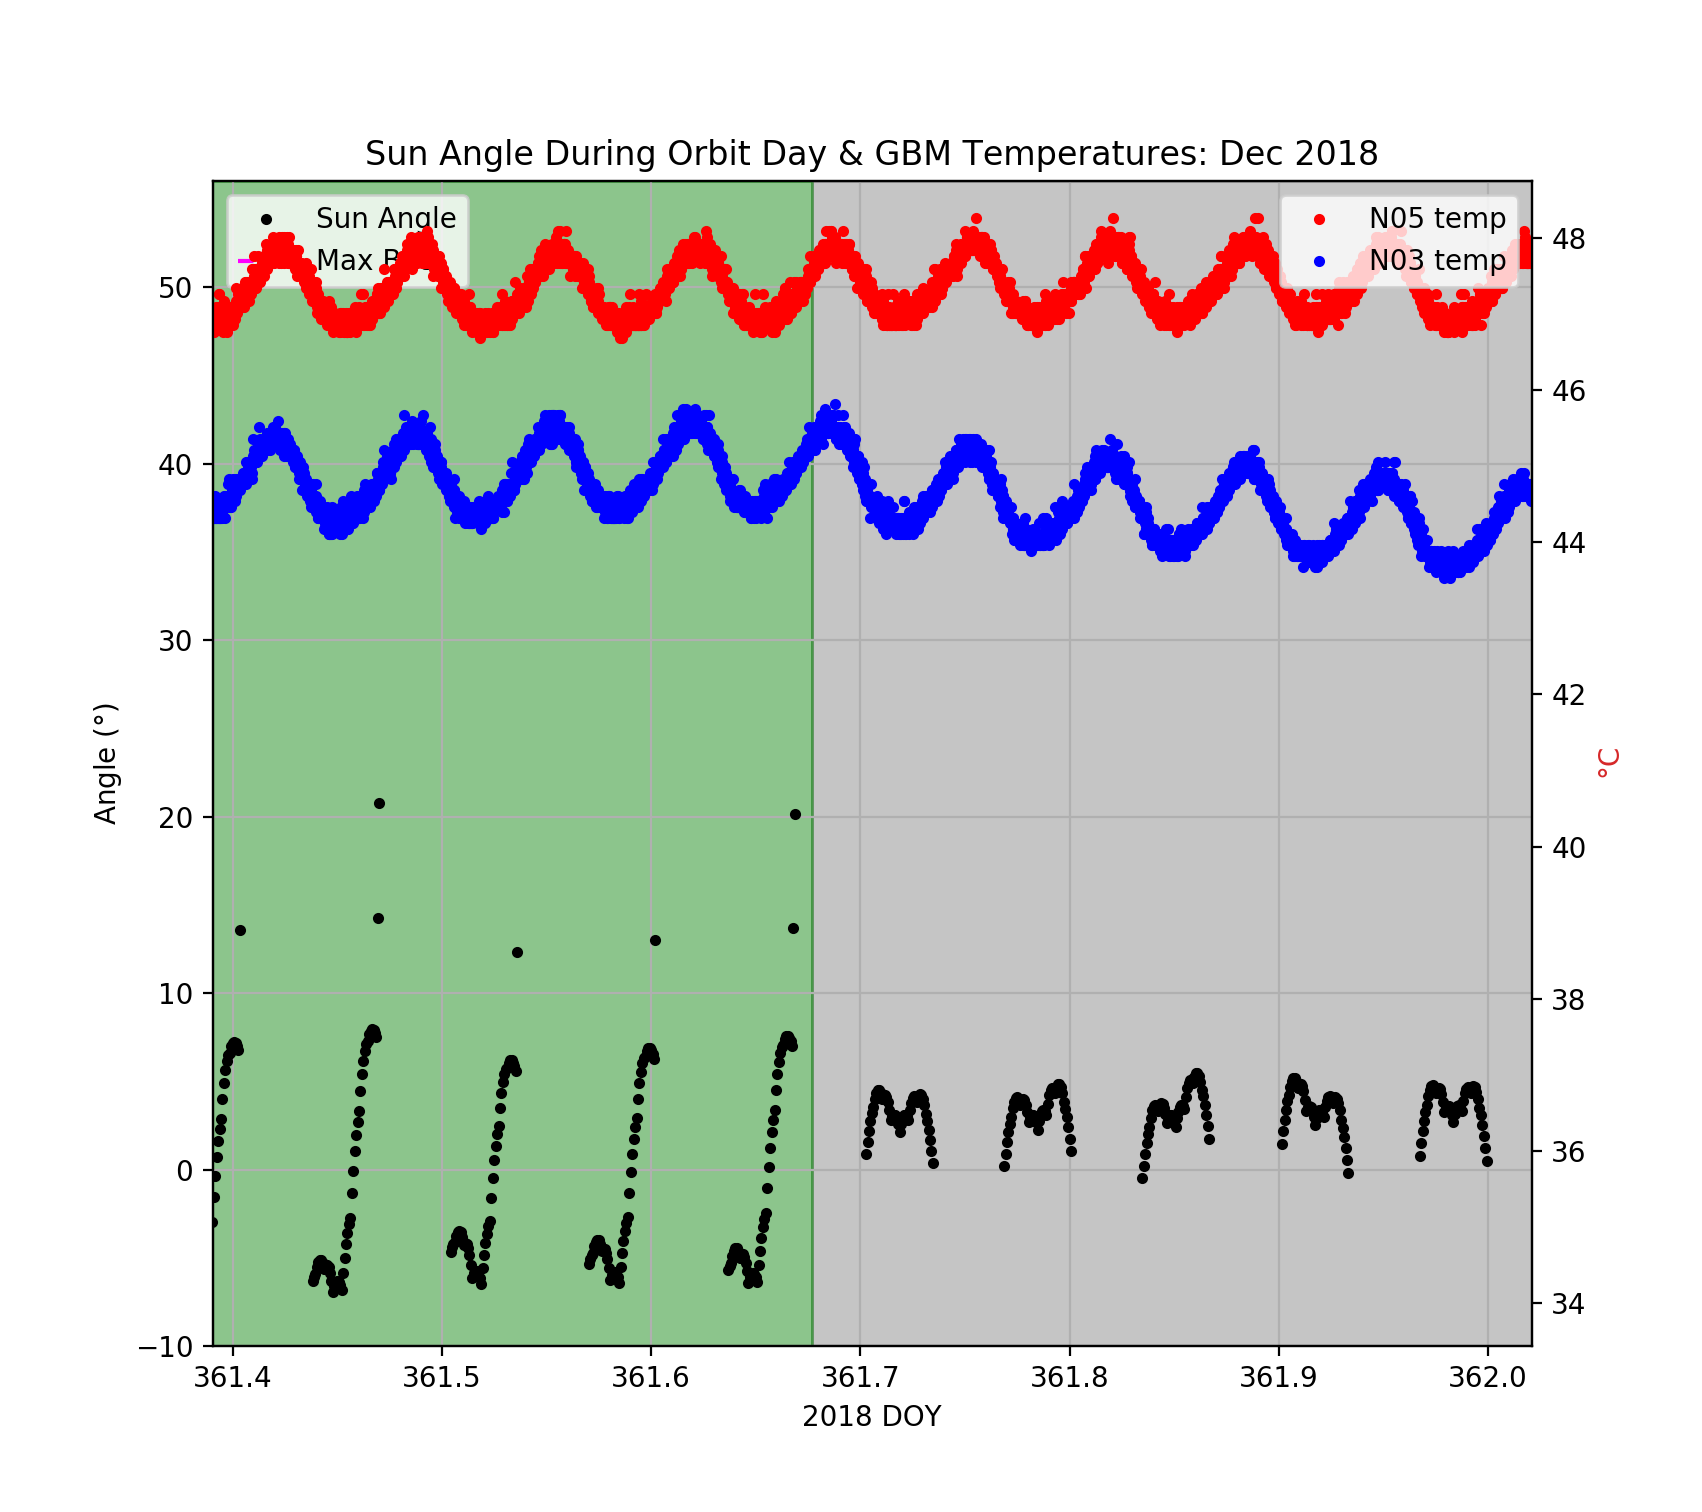
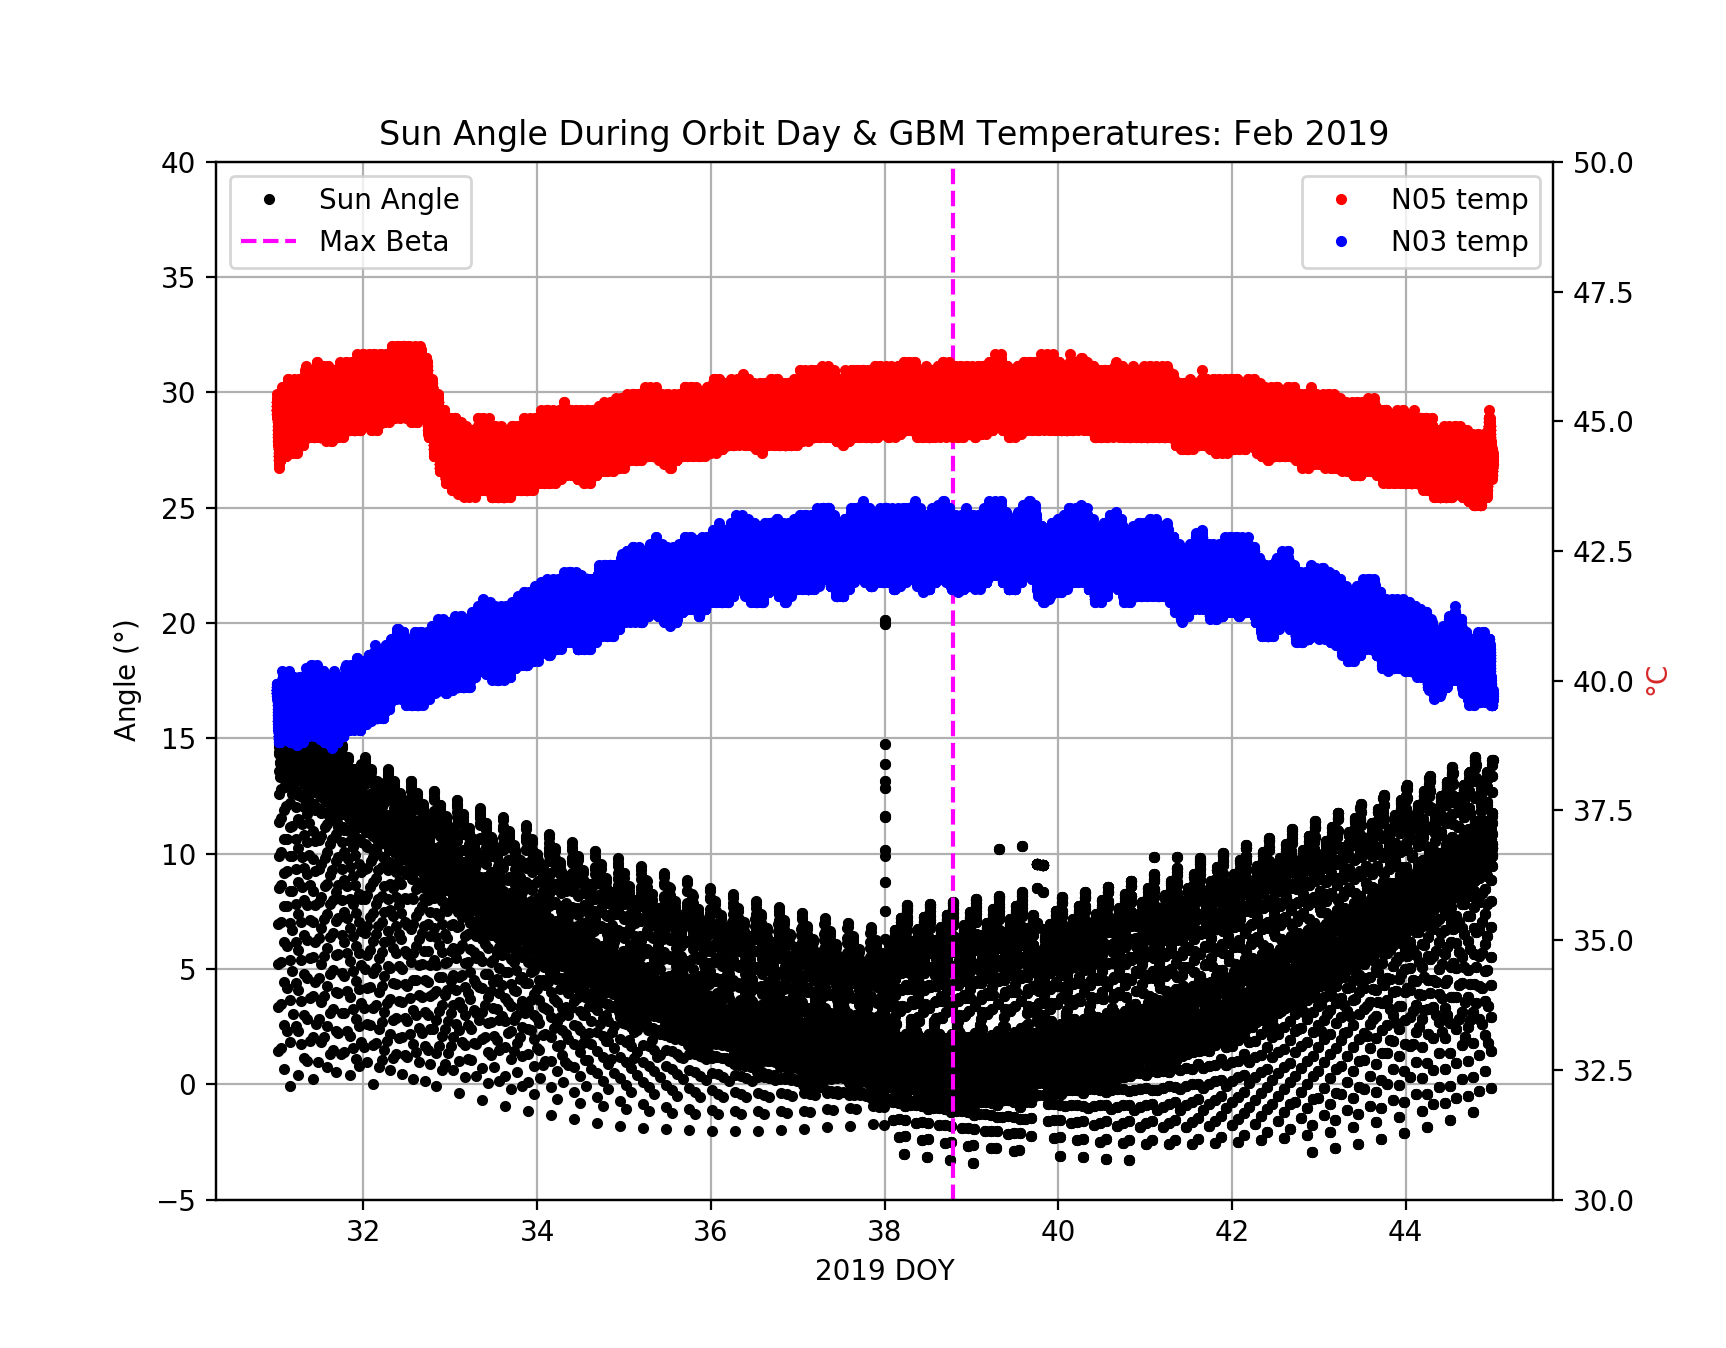
The following plots show both the Sun angle with respect to the +X face of the spacecraft & the temperatures of selected GBM detectors vs. time. GBM temperature data was provided by the FOT and spacecraft orientation was taken from predicted FT2 files created by the FSSC during mission planning (as-flown FT2 files were not used as they lack data during SAA passages).
The Sun angle was calculated as the angle between the direction in which the +X axis of the spacecraft was pointed and the vector pointing toward the Sun during orbit day. Orbit day was defined as orbit noon (calculated for each orbit) plus or minus 1/4 orbit (1428 seconds), or from orbit 6am to orbit 6pm. Positive/negative values of the Sun angle correspond to the Sun vector being less than 90° or more than 90° (respectively) from the +Z axis of the spacecraft.
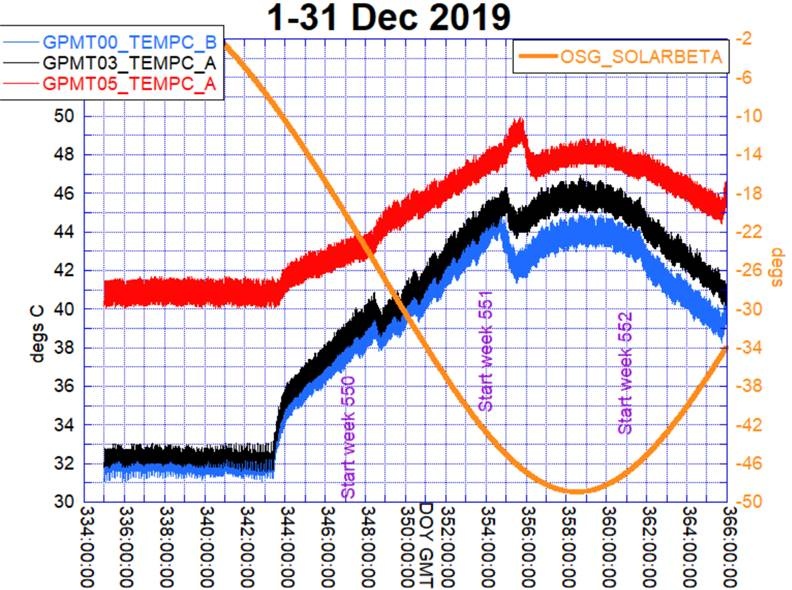
December 2018
Peak beta of -49.0° occurred on Dec. 24 (DOY 358) at 15:00 UT. A variety of rocking profiles were employed during this time (see below). On 20 Dec (DOY 354), GBM N00 (Detector #1) was turned off autonomously (tripped) after it surpassed 45° C. The next day, 21 Dec, GBM N05 (Detector #6) was turned off after it warmed past 50° C.
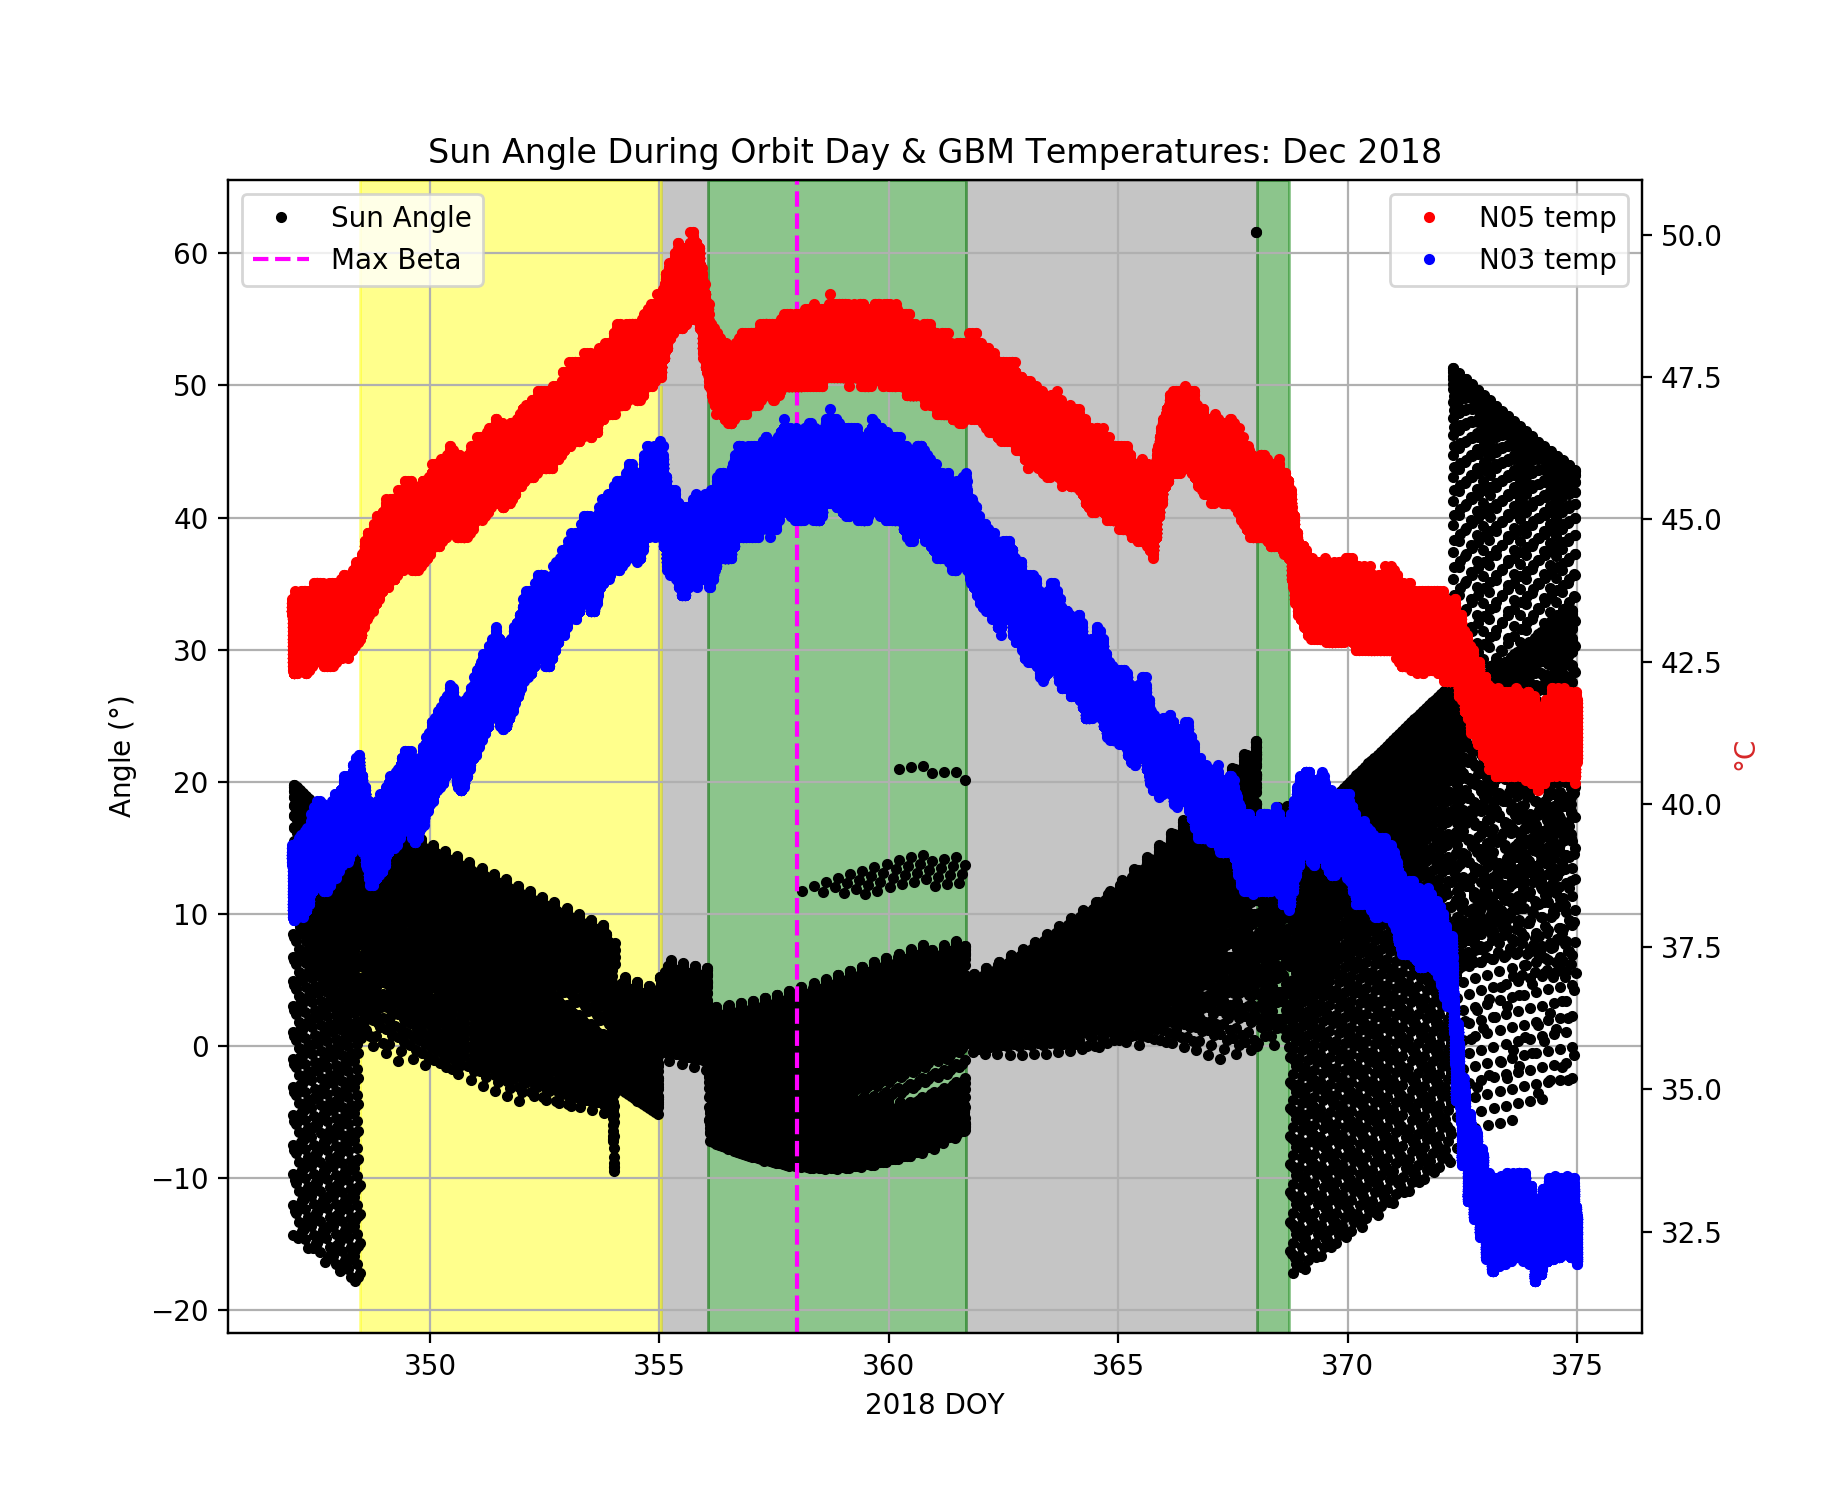
Shaded regions correspond to the various rocking strategies we employed during the associated period:
- Yellow: -50° full-sine profile (-50° sine during orbit day and +50° sine during orbit night)
- Green: -50° modified sine profile (-50° sine during orbit day then rocked 50° to the opposite hemisphere during orbit night)
- Grey: -42° modified sine profile (same as -50° mod-sine above, but with a lower amplitude sinusoid during orbit day)
During the (non-colored) periods immediately preceding and following the sinusoidal profiles, we employed one-sided -50° rocking.
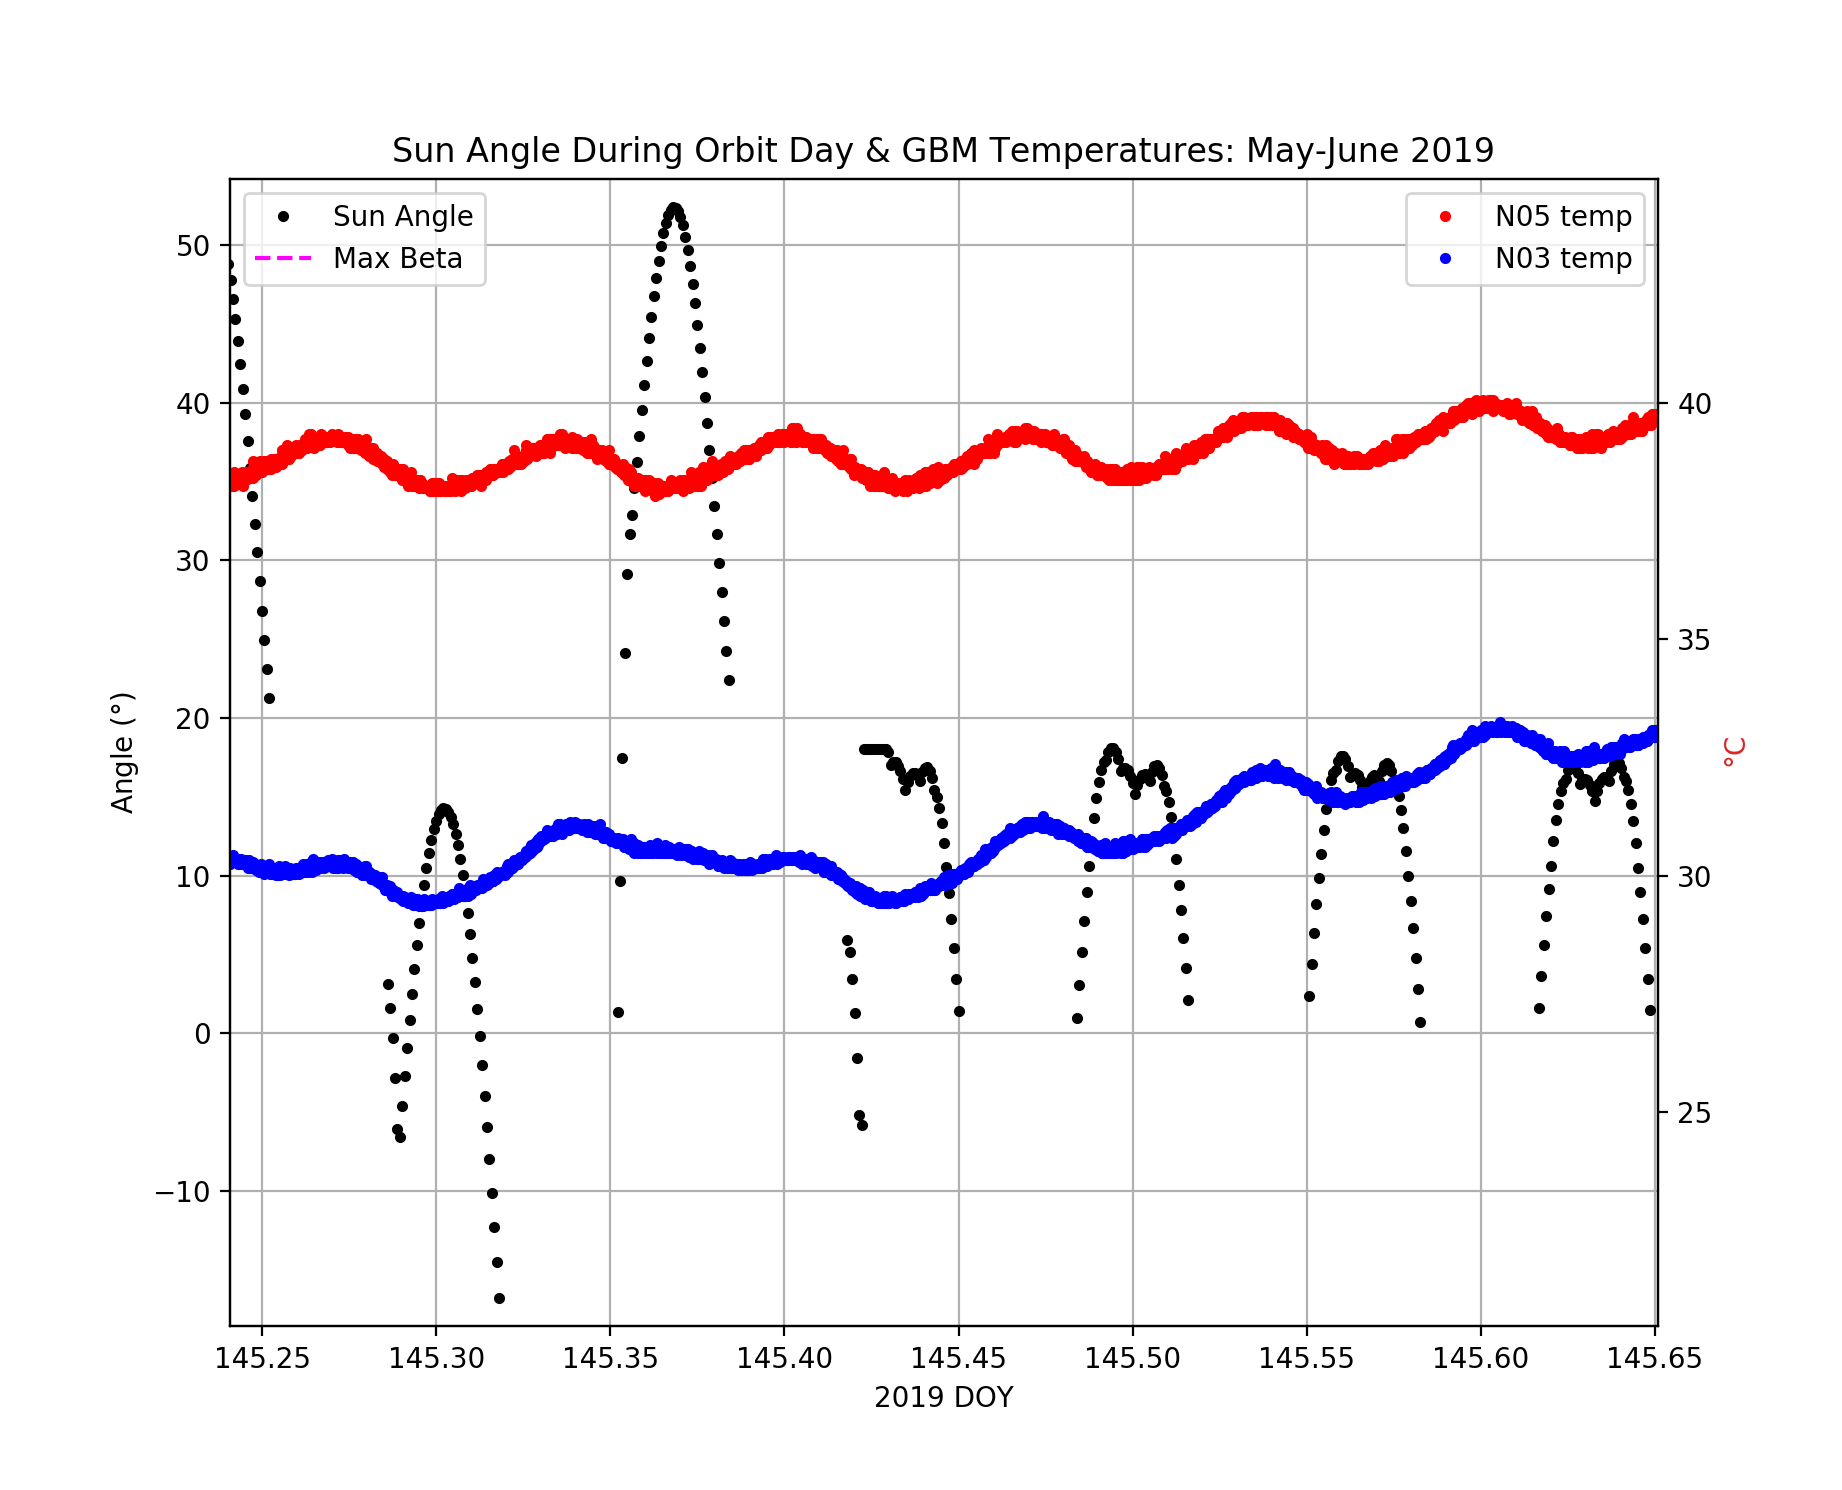
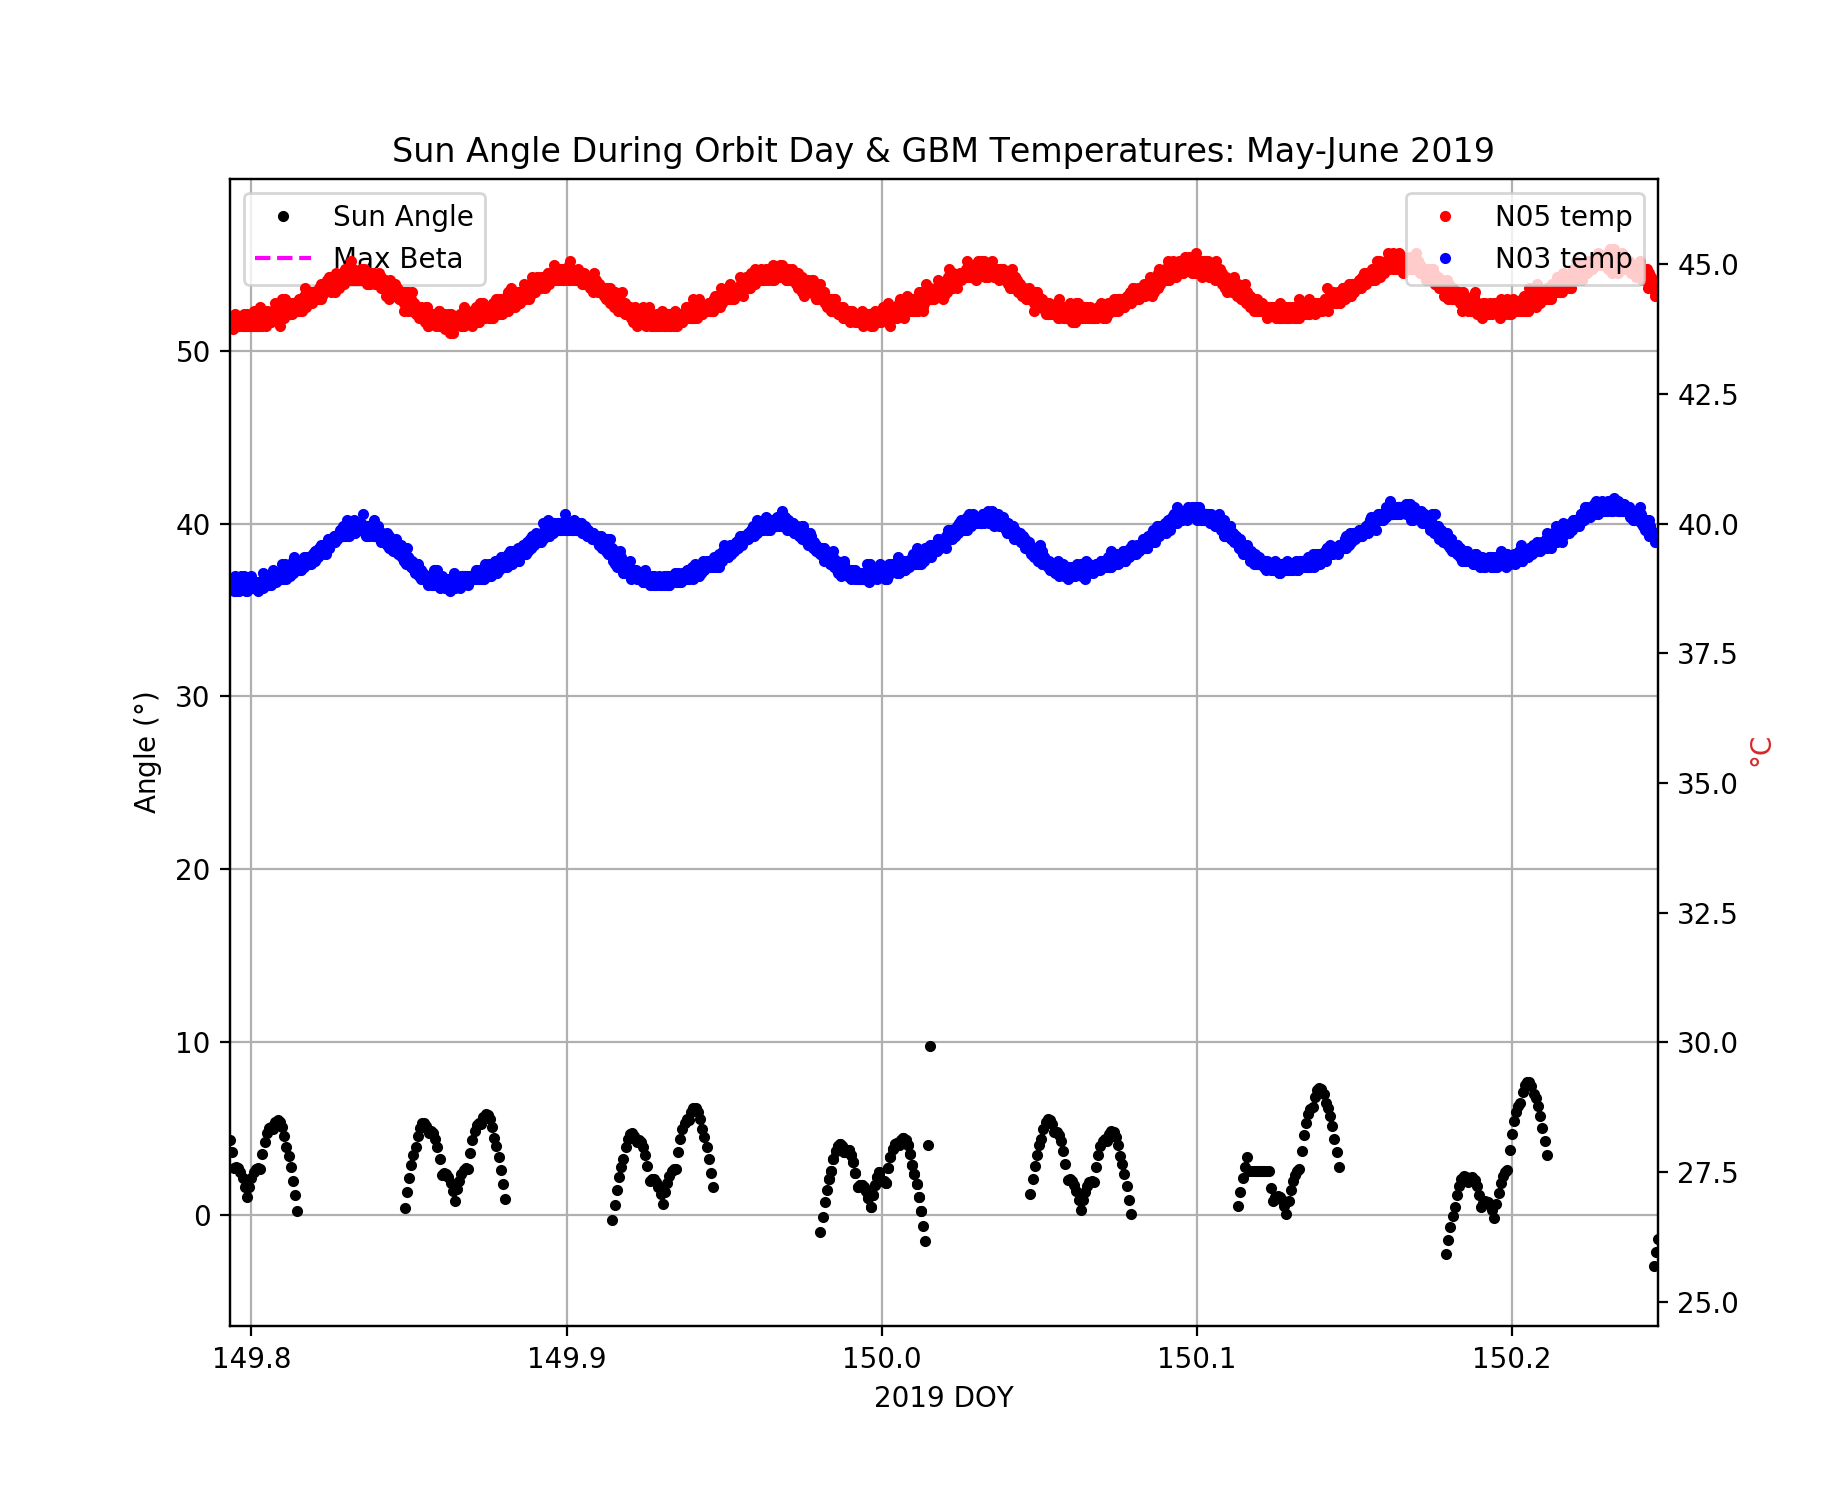
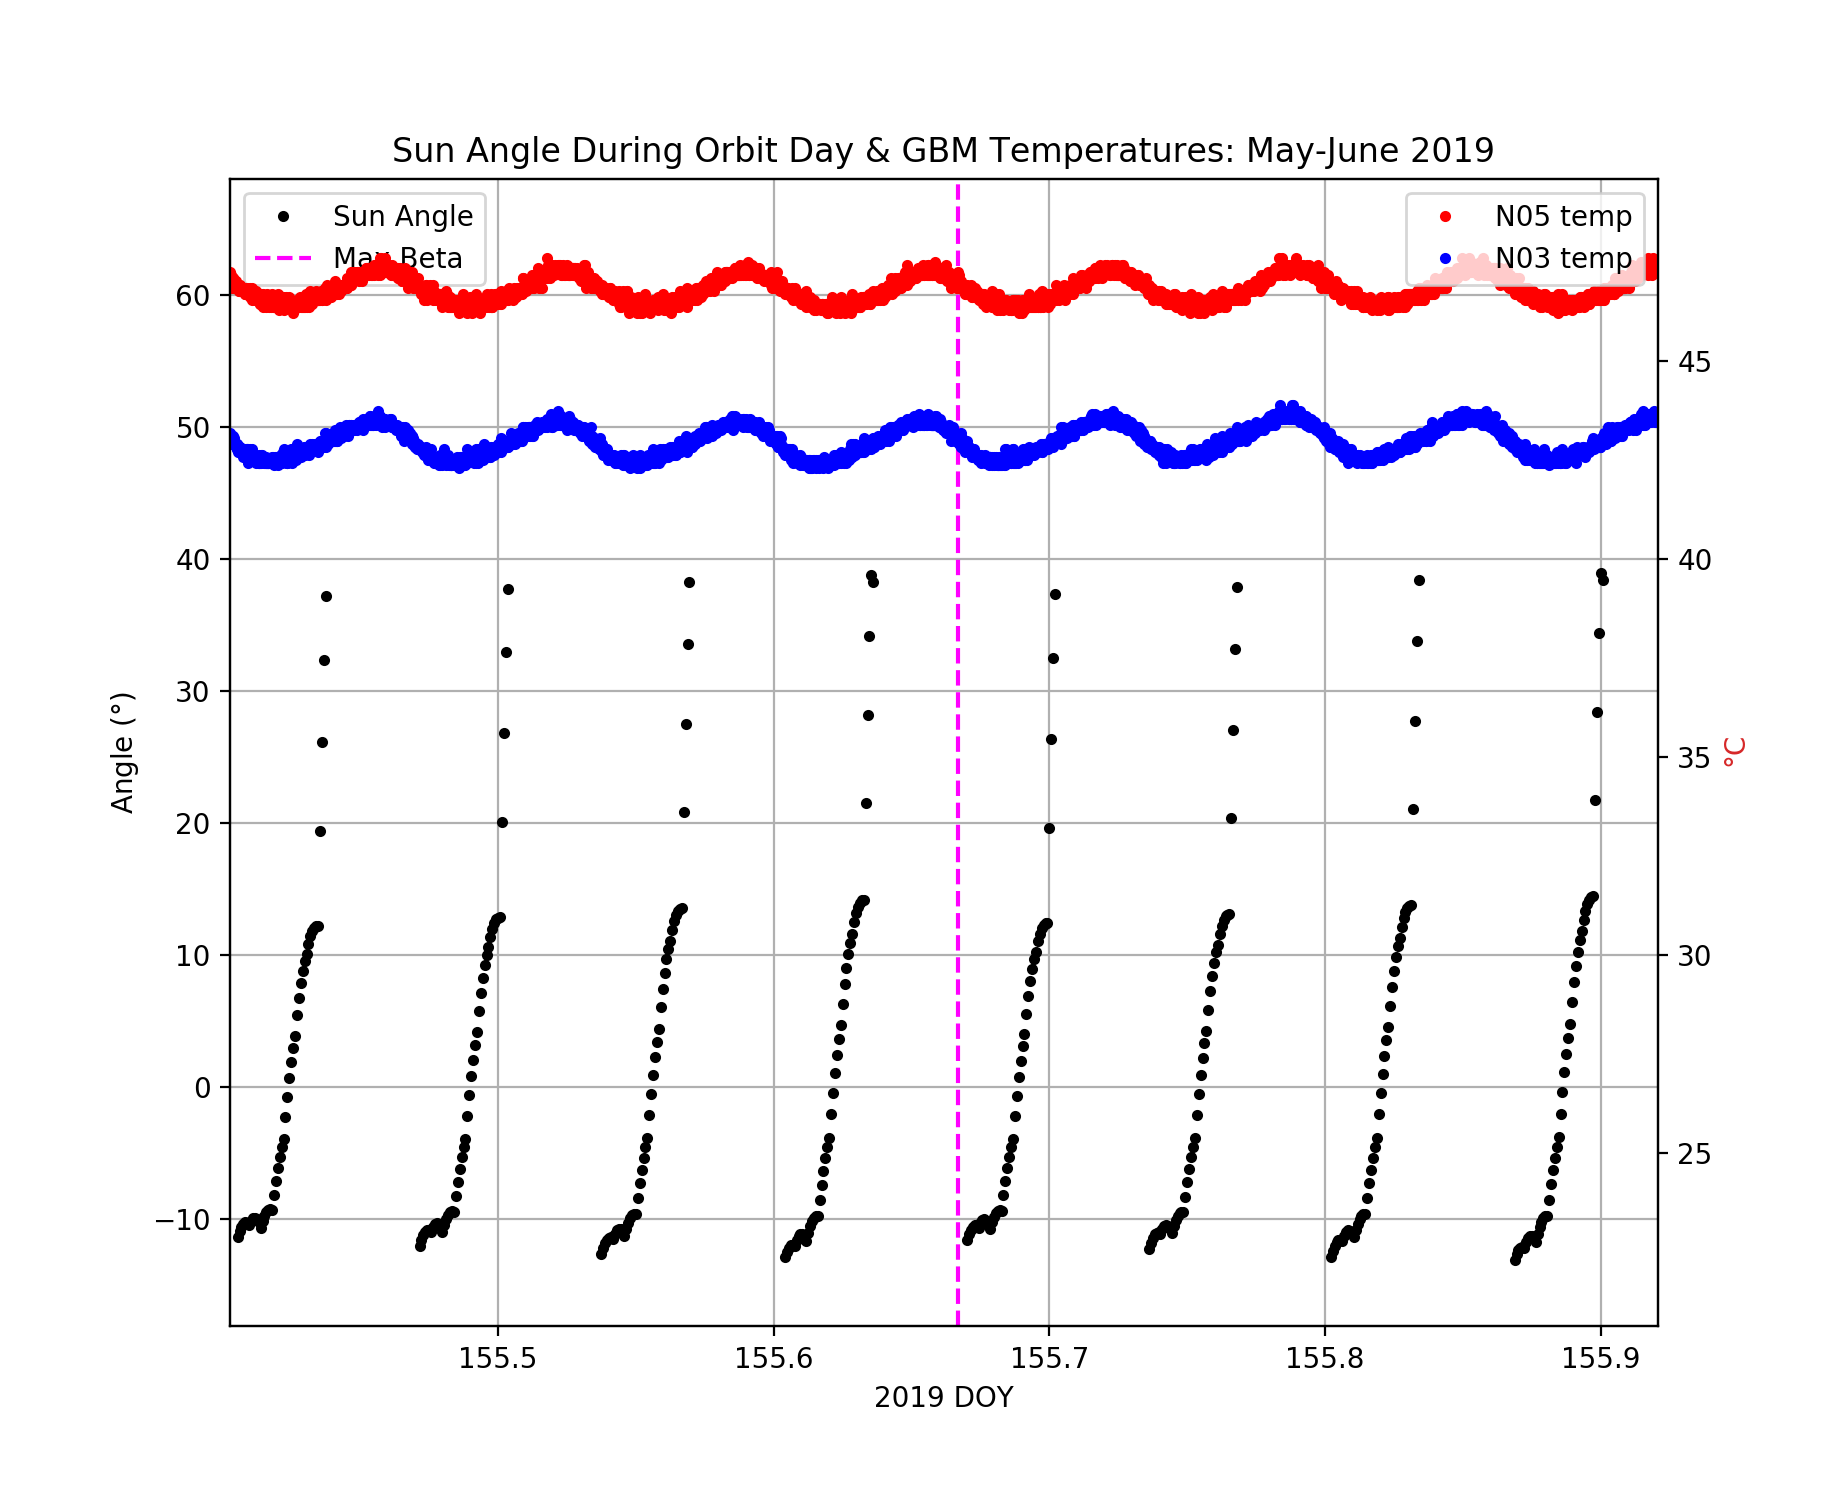
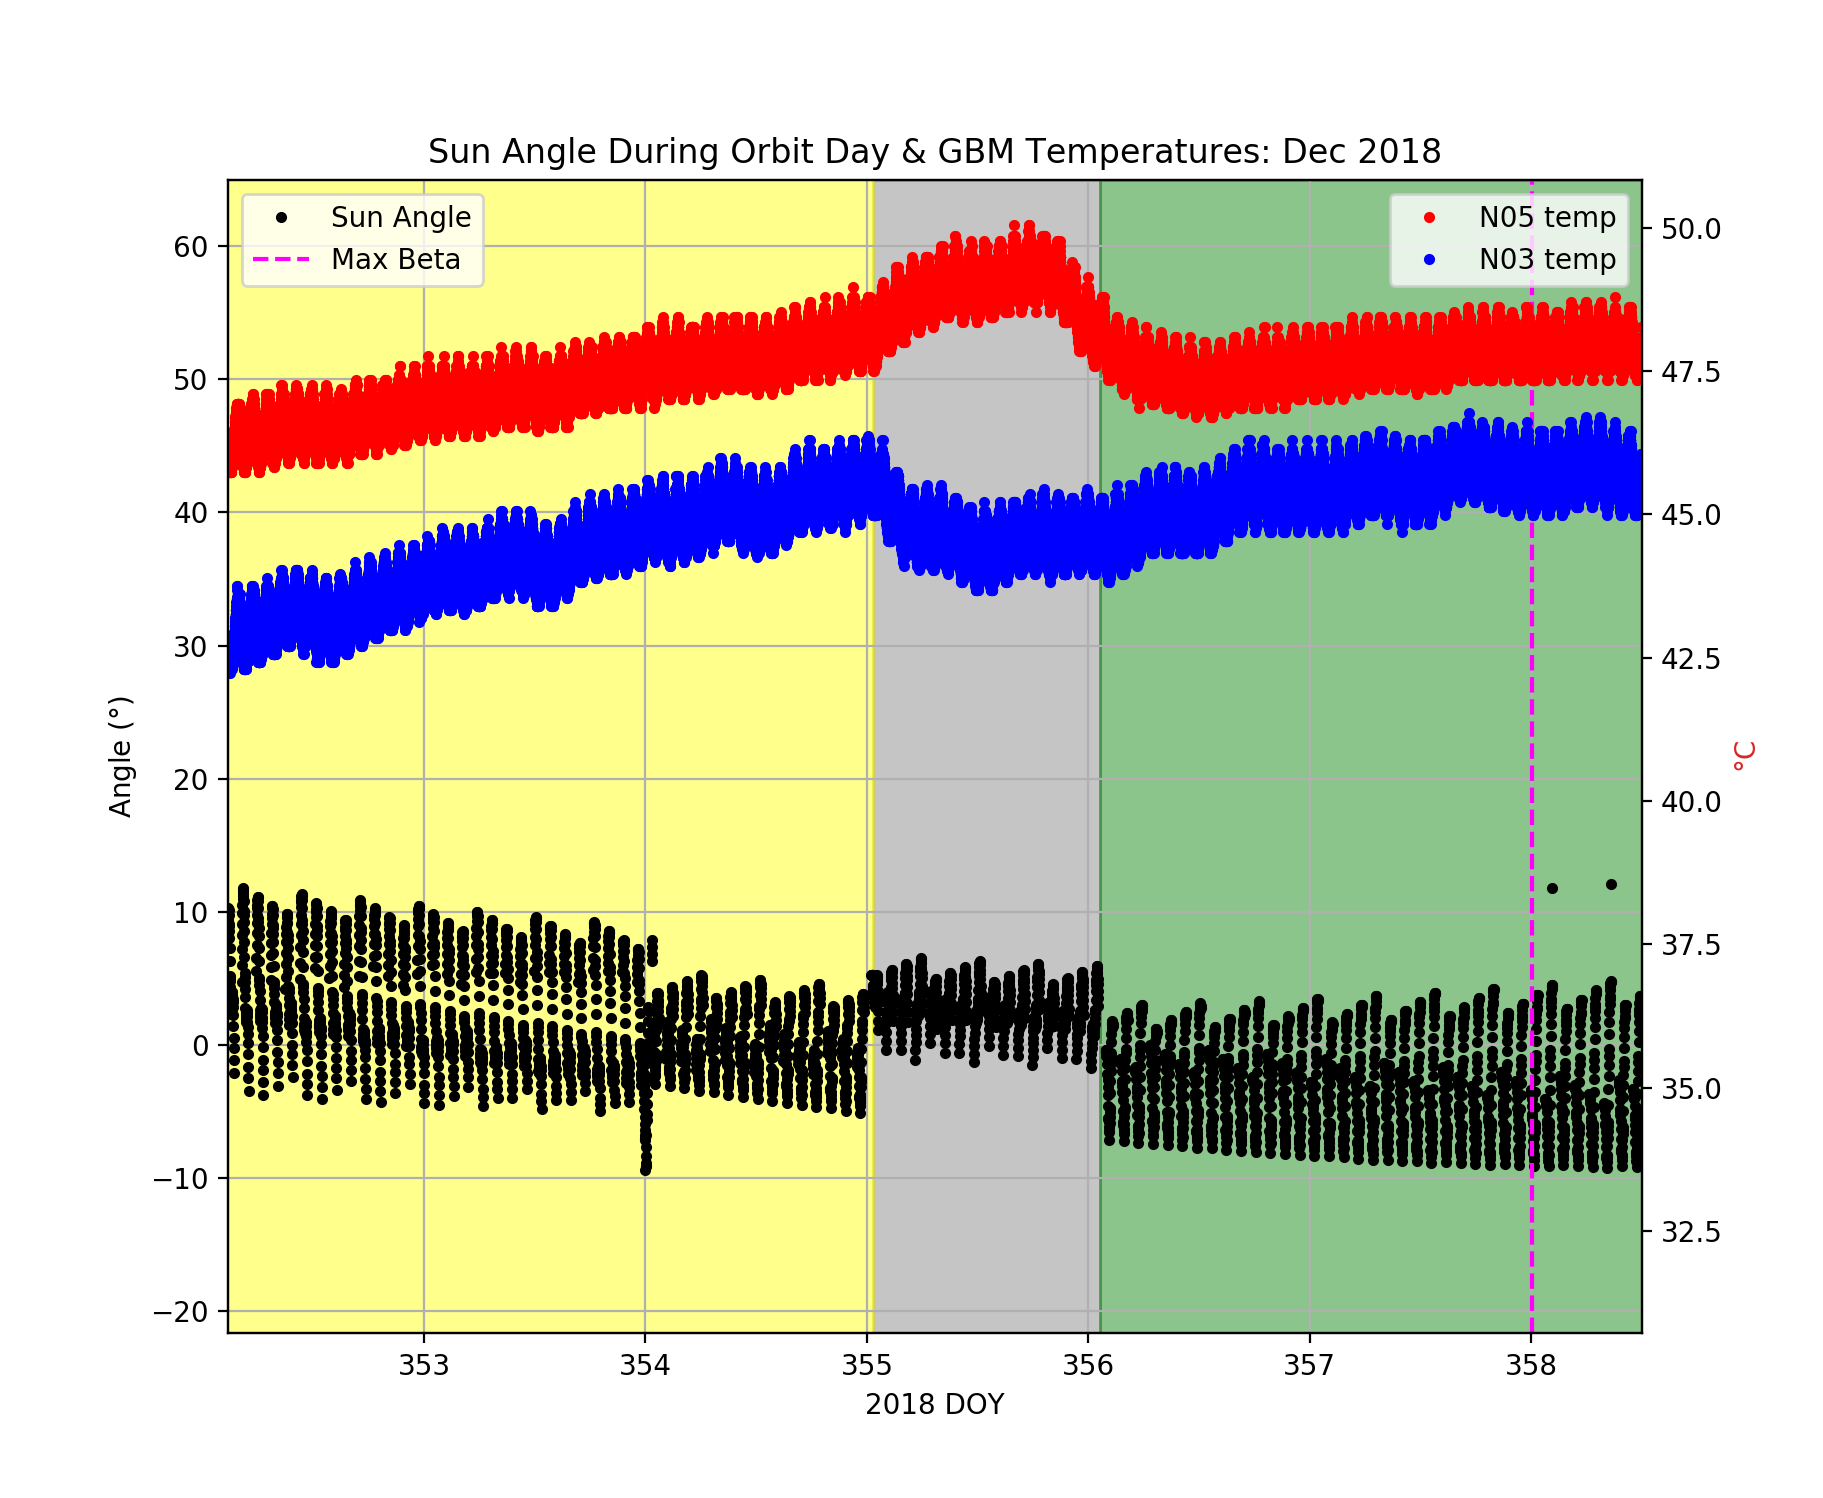
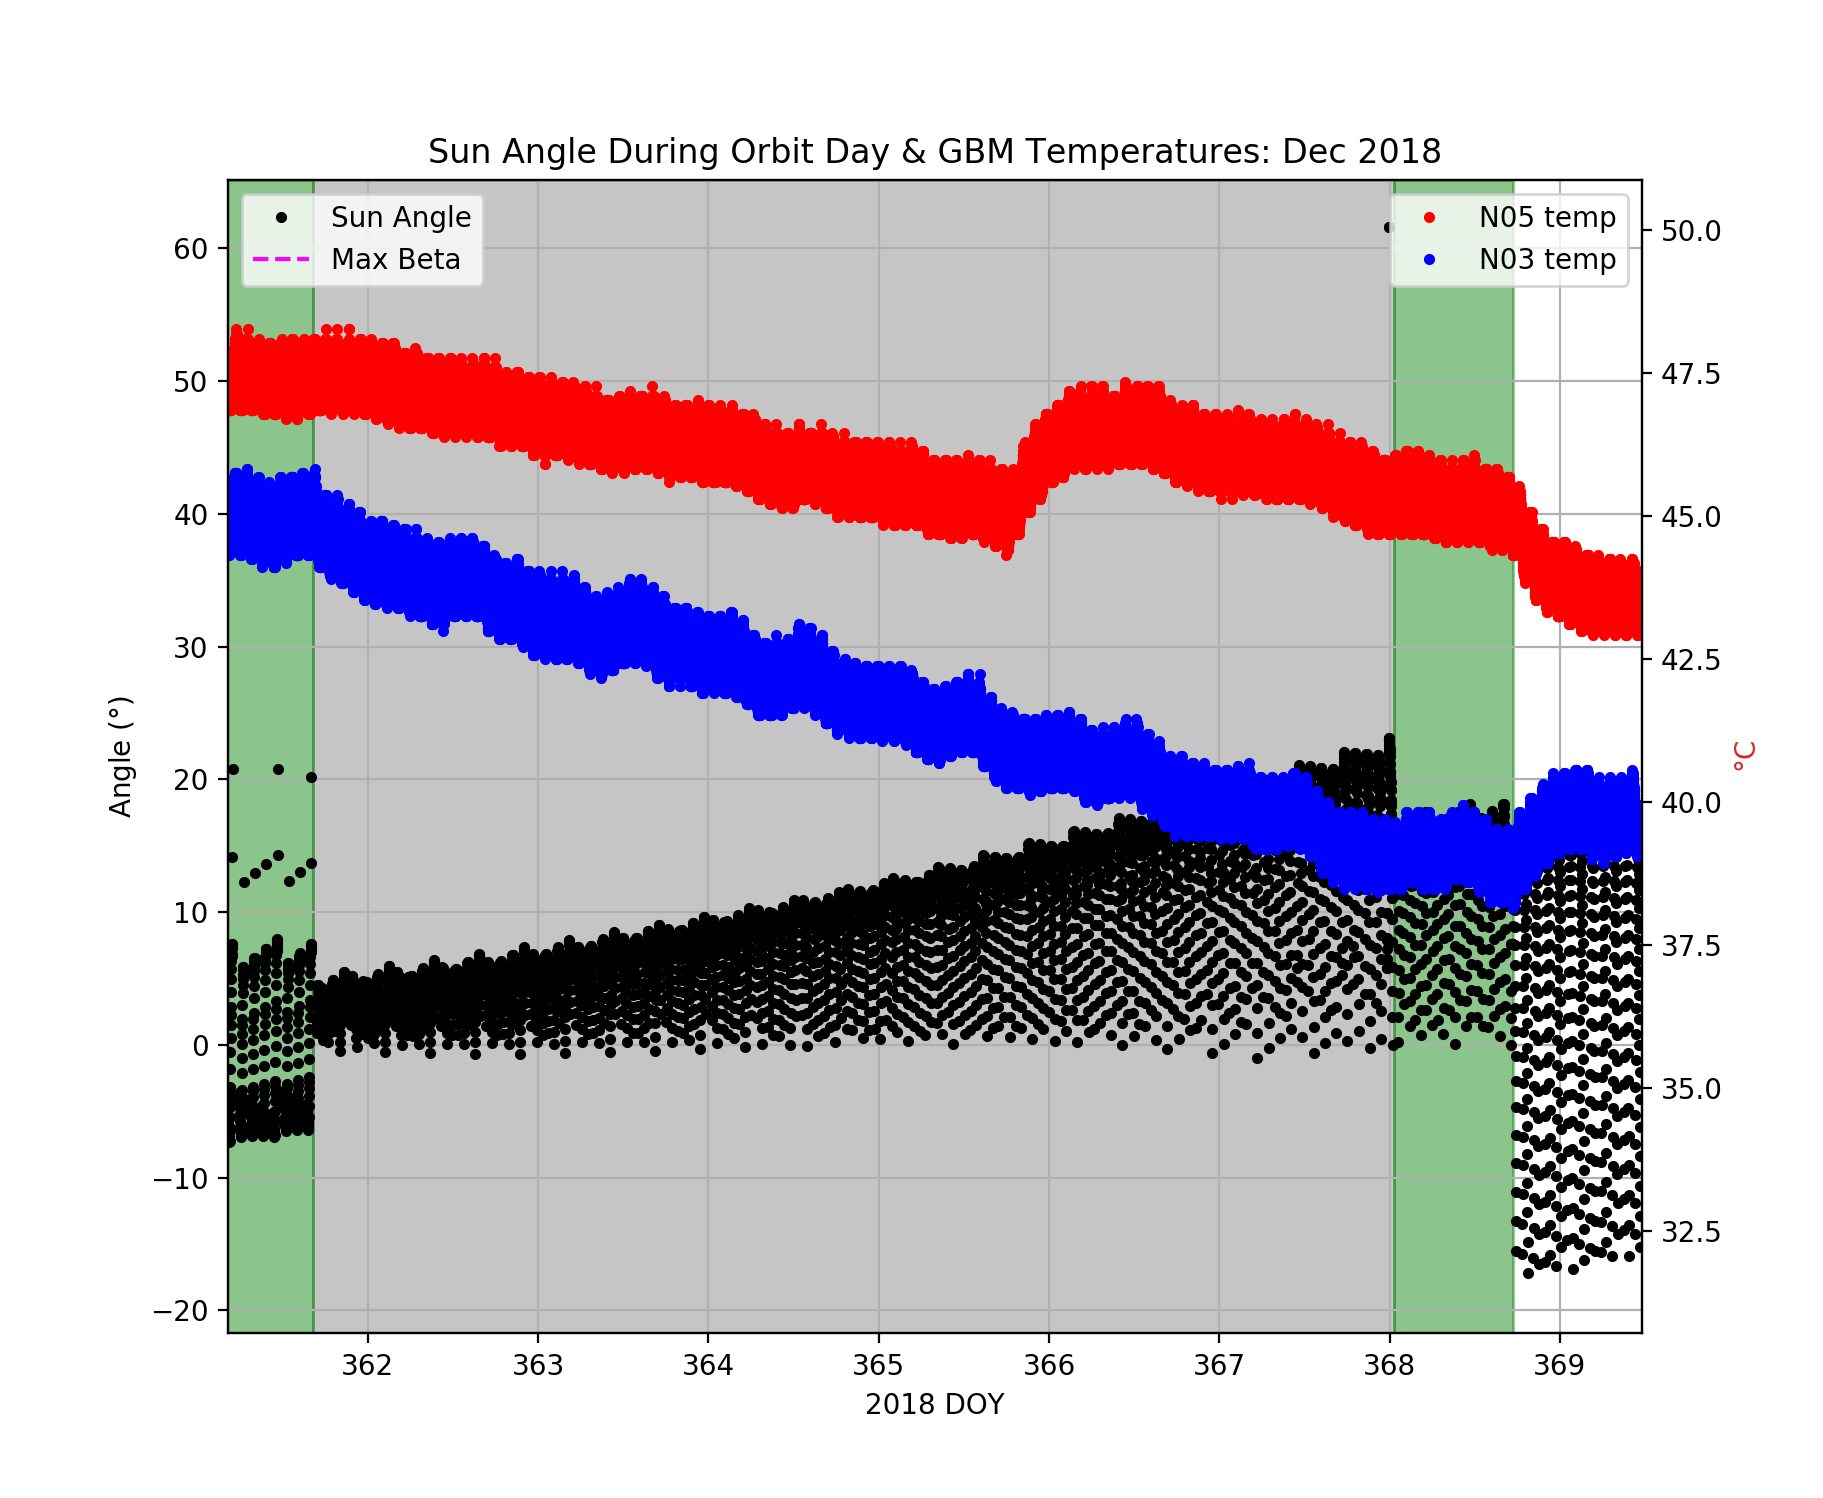
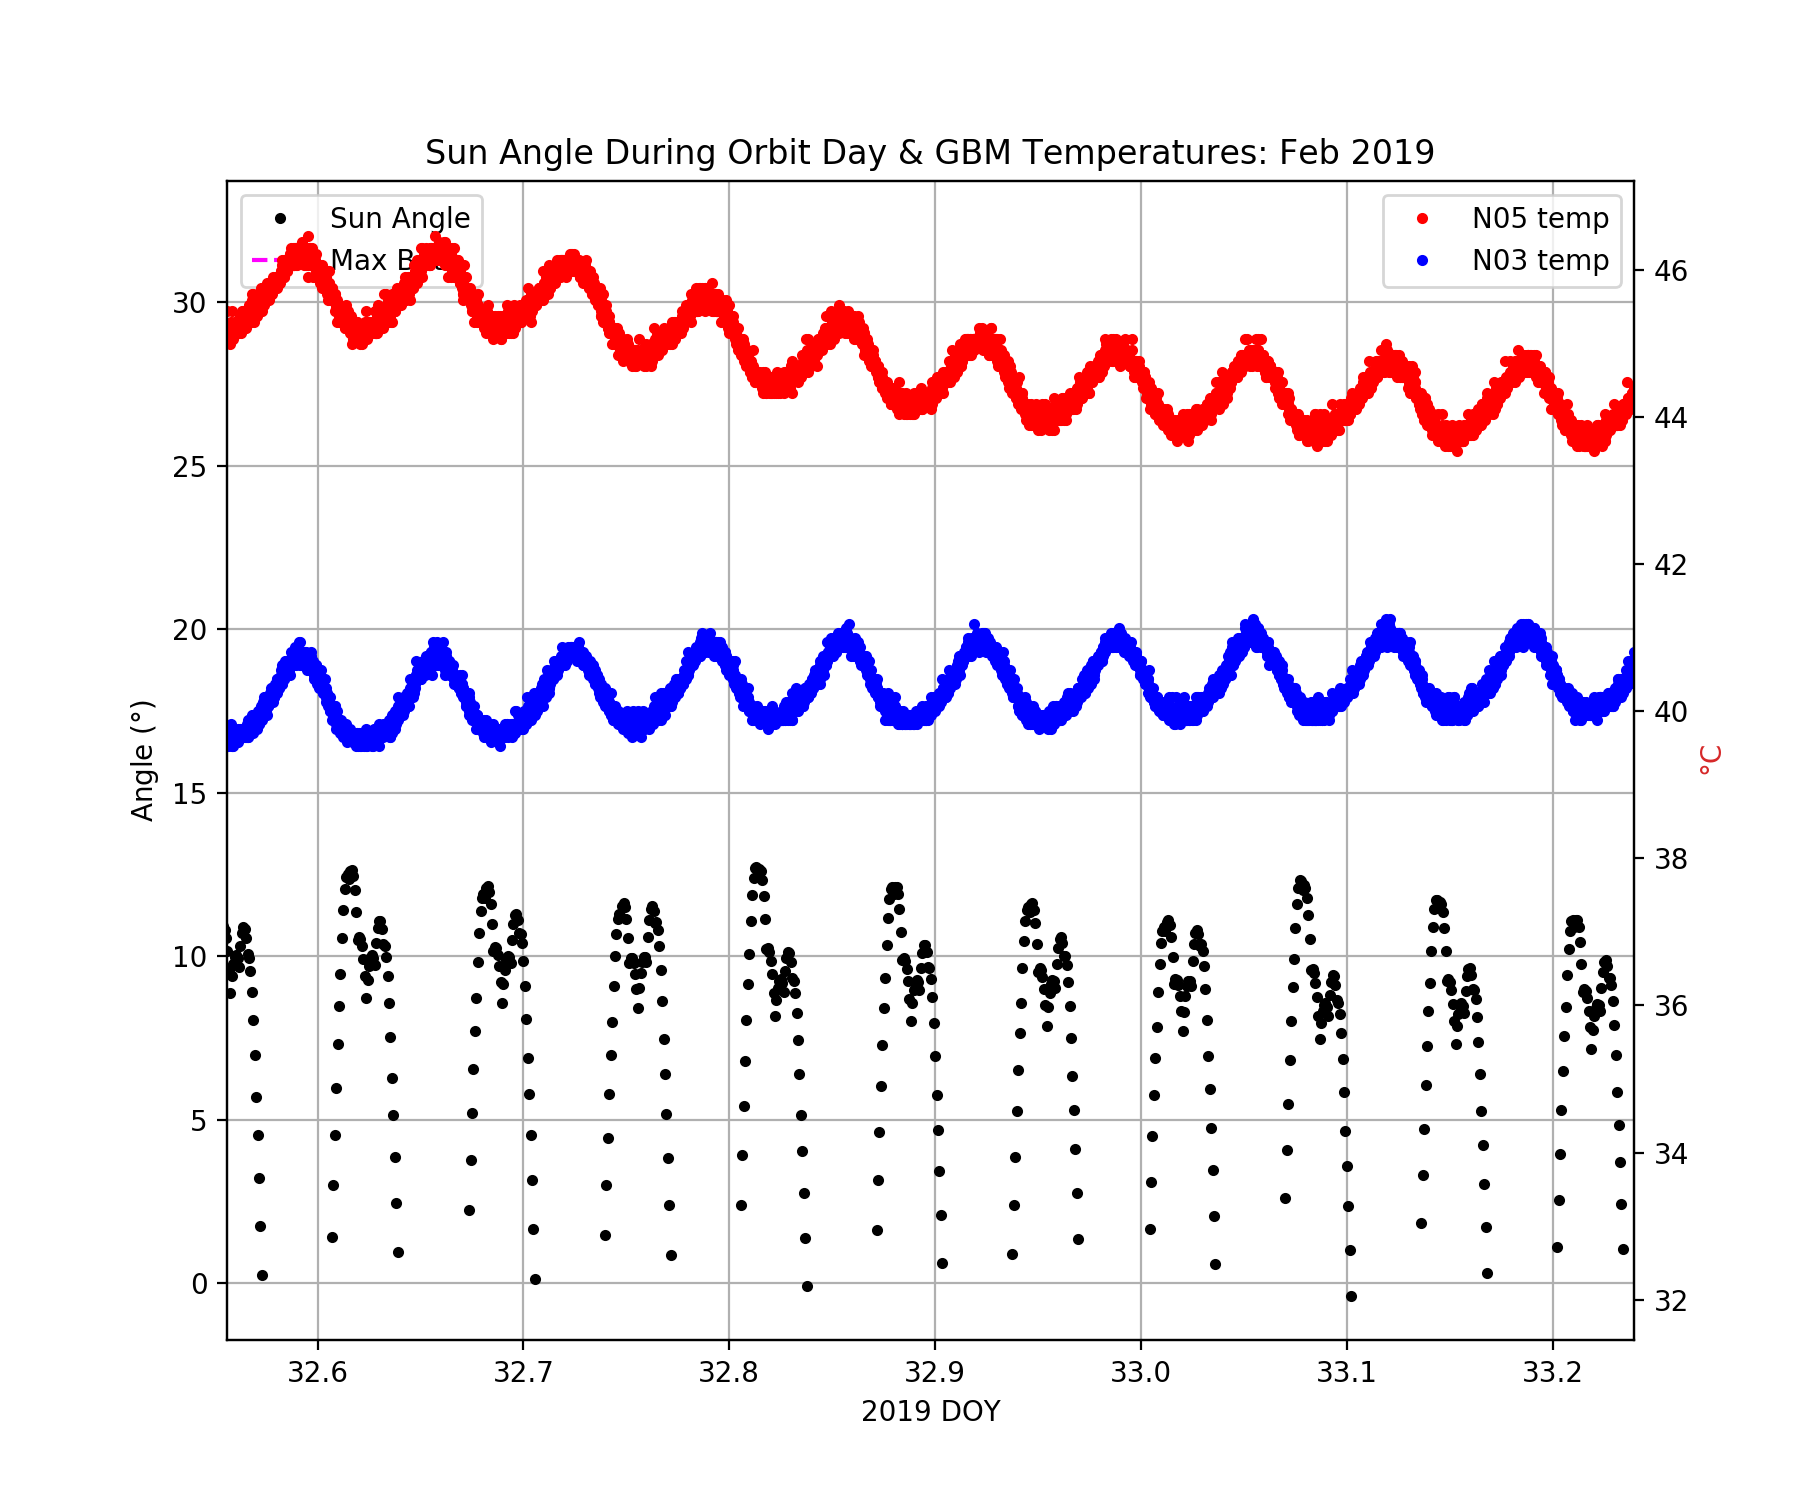
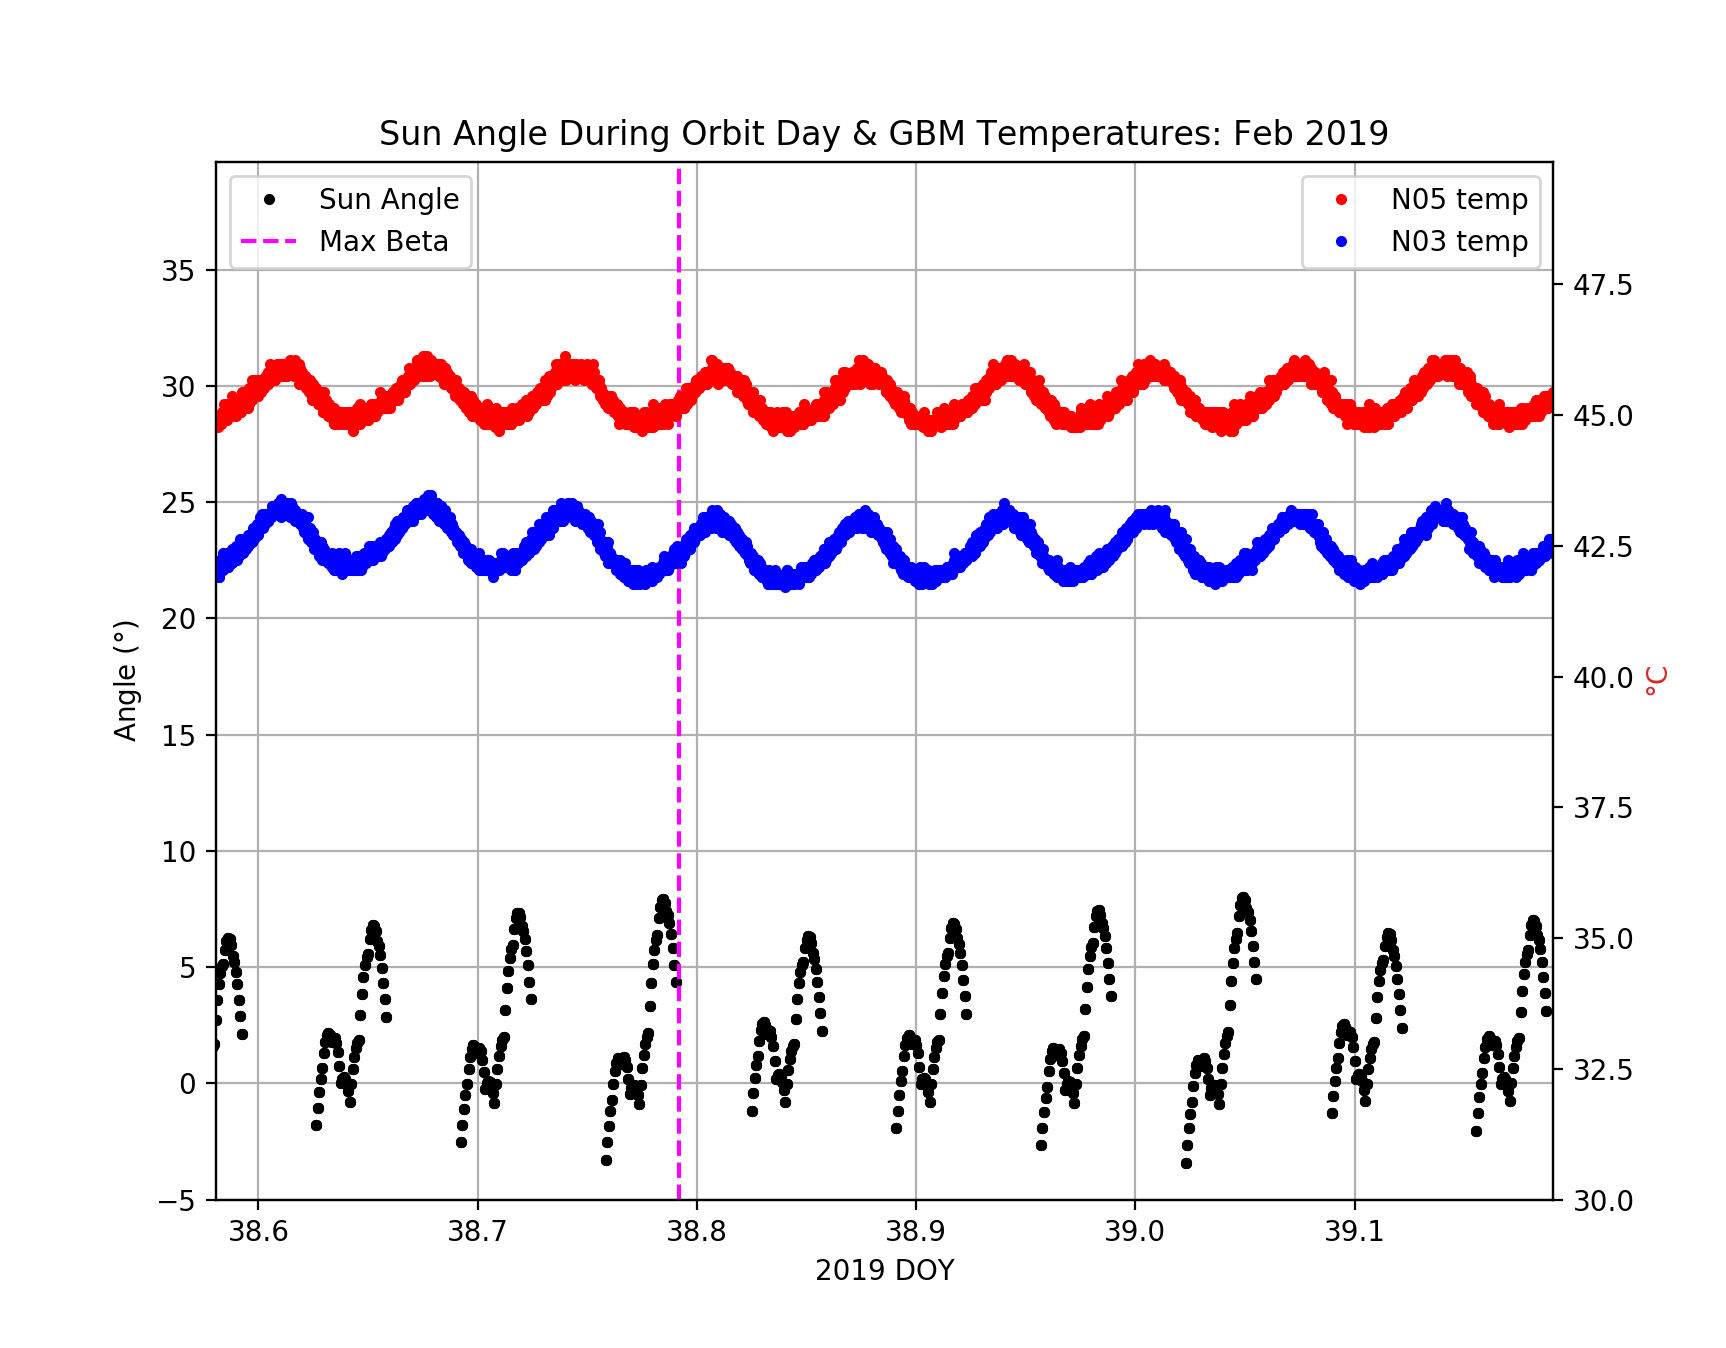
The following plots show zoomed-in views of the above period.
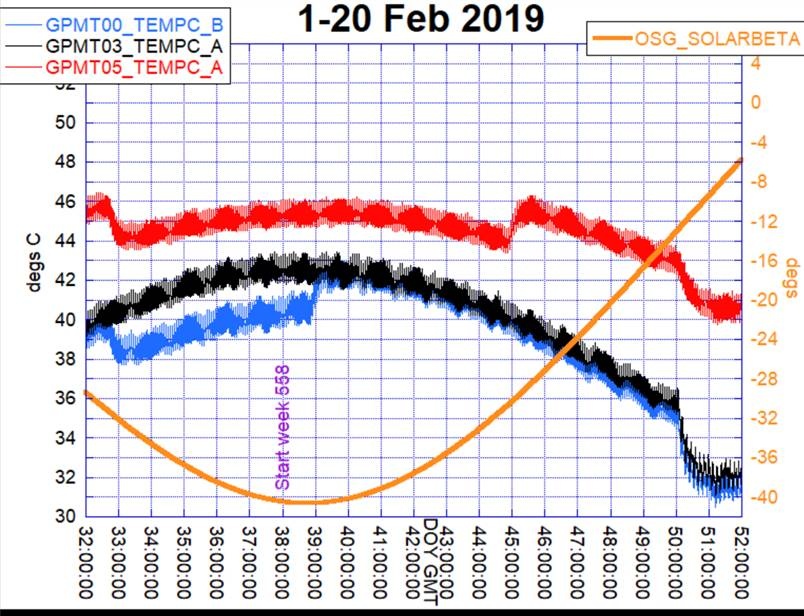
February 2019
Peak beta of -40.7° occurred on Feb. 07 (DOY 38) at 19:00 UT. A -50° modified sine profile was used throughout this period (2019 DOY 31 to 49). GBM N05 and N00 (Detectors #6 and #1, respectively) were preemptively turned off on 01 Feb. (DOY 32).
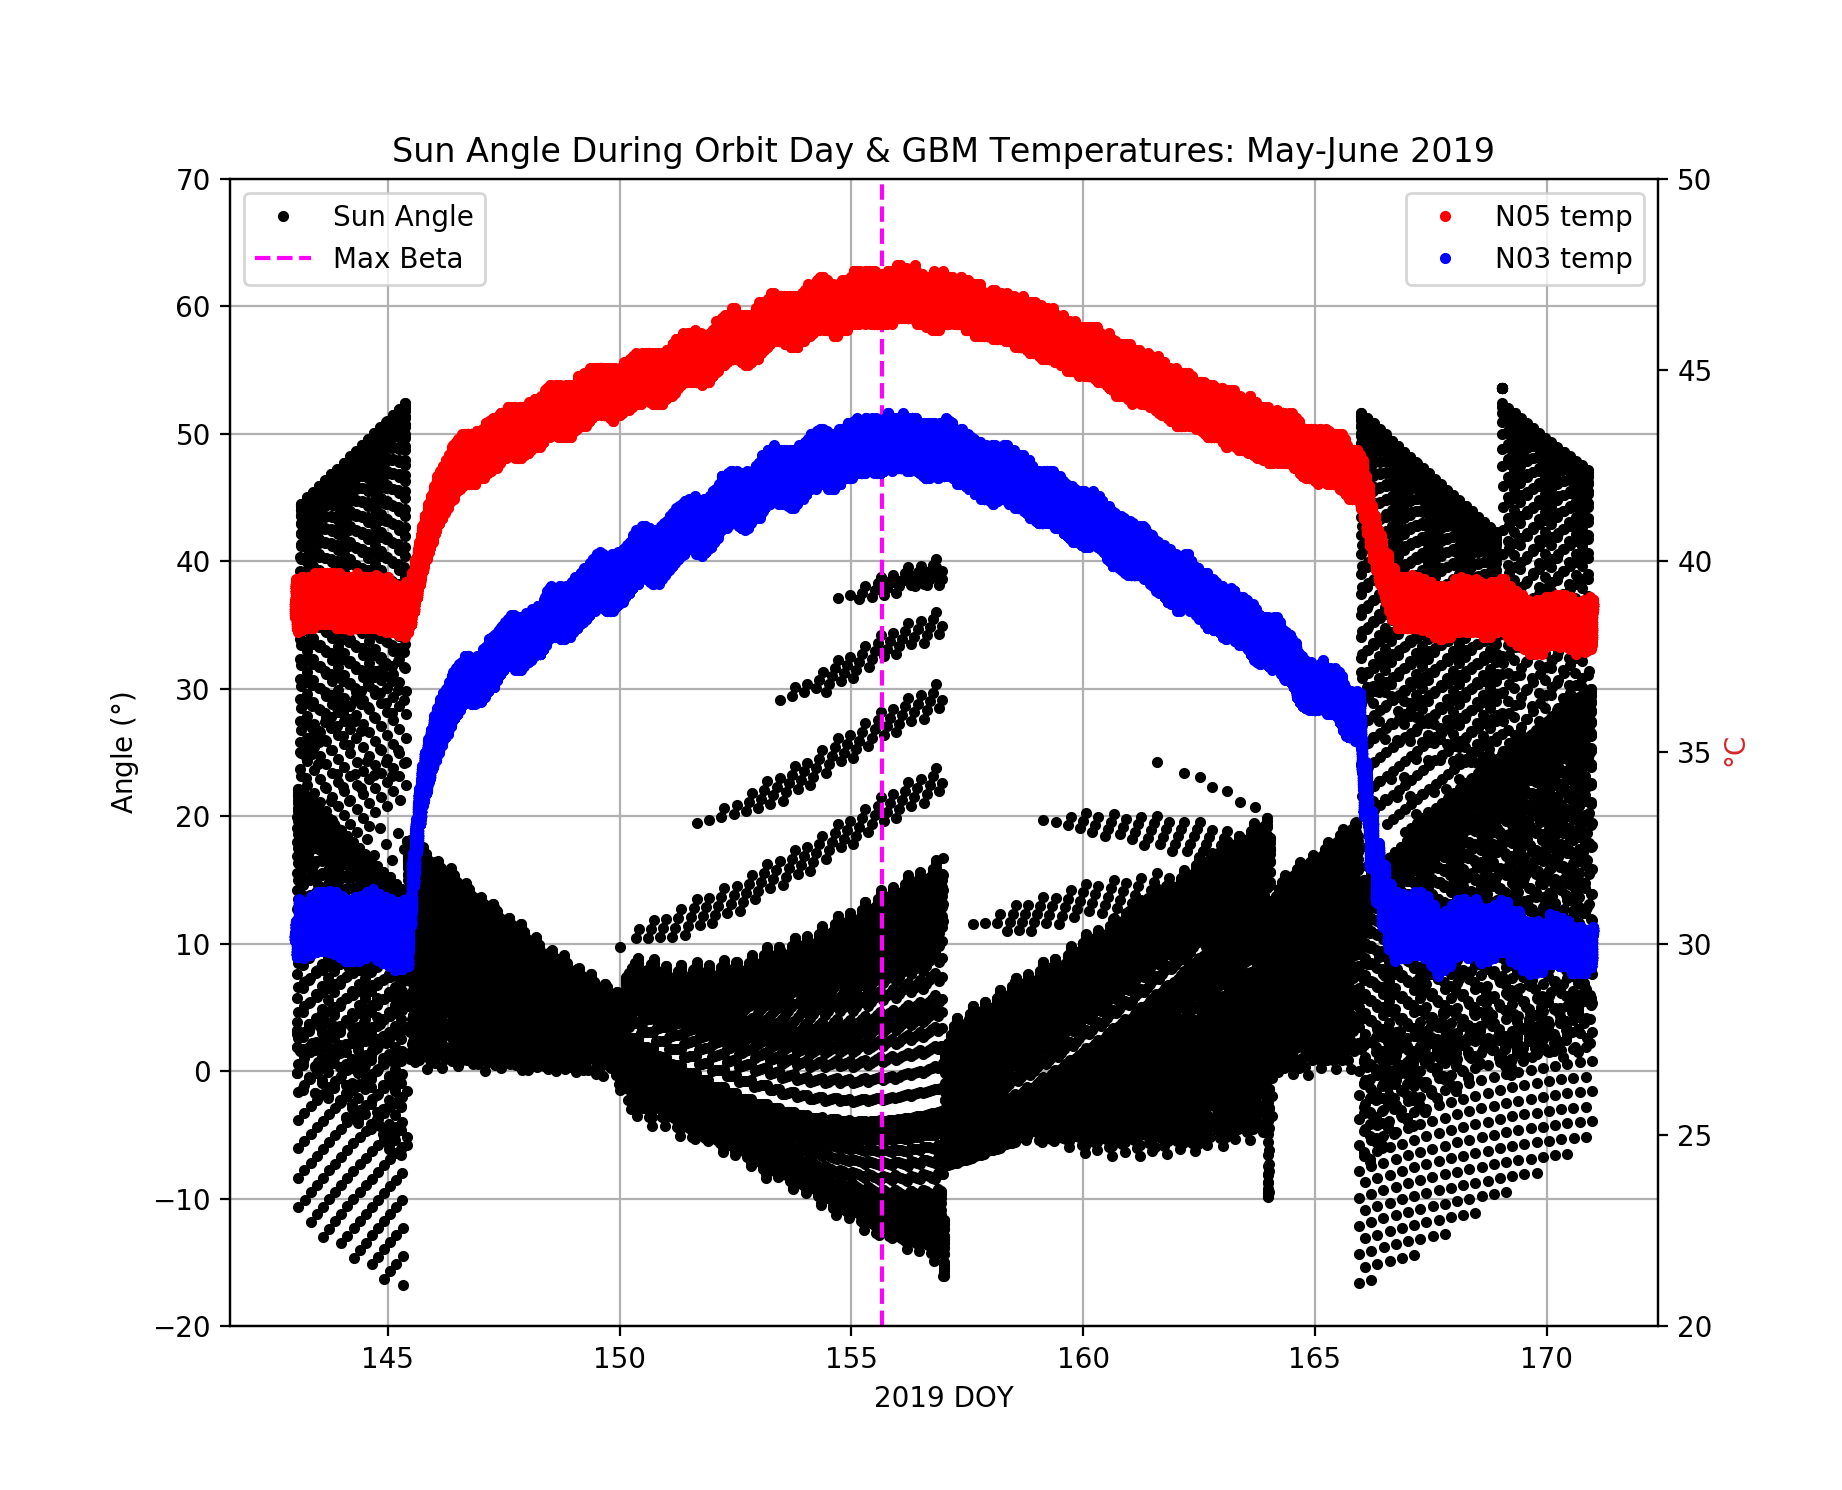
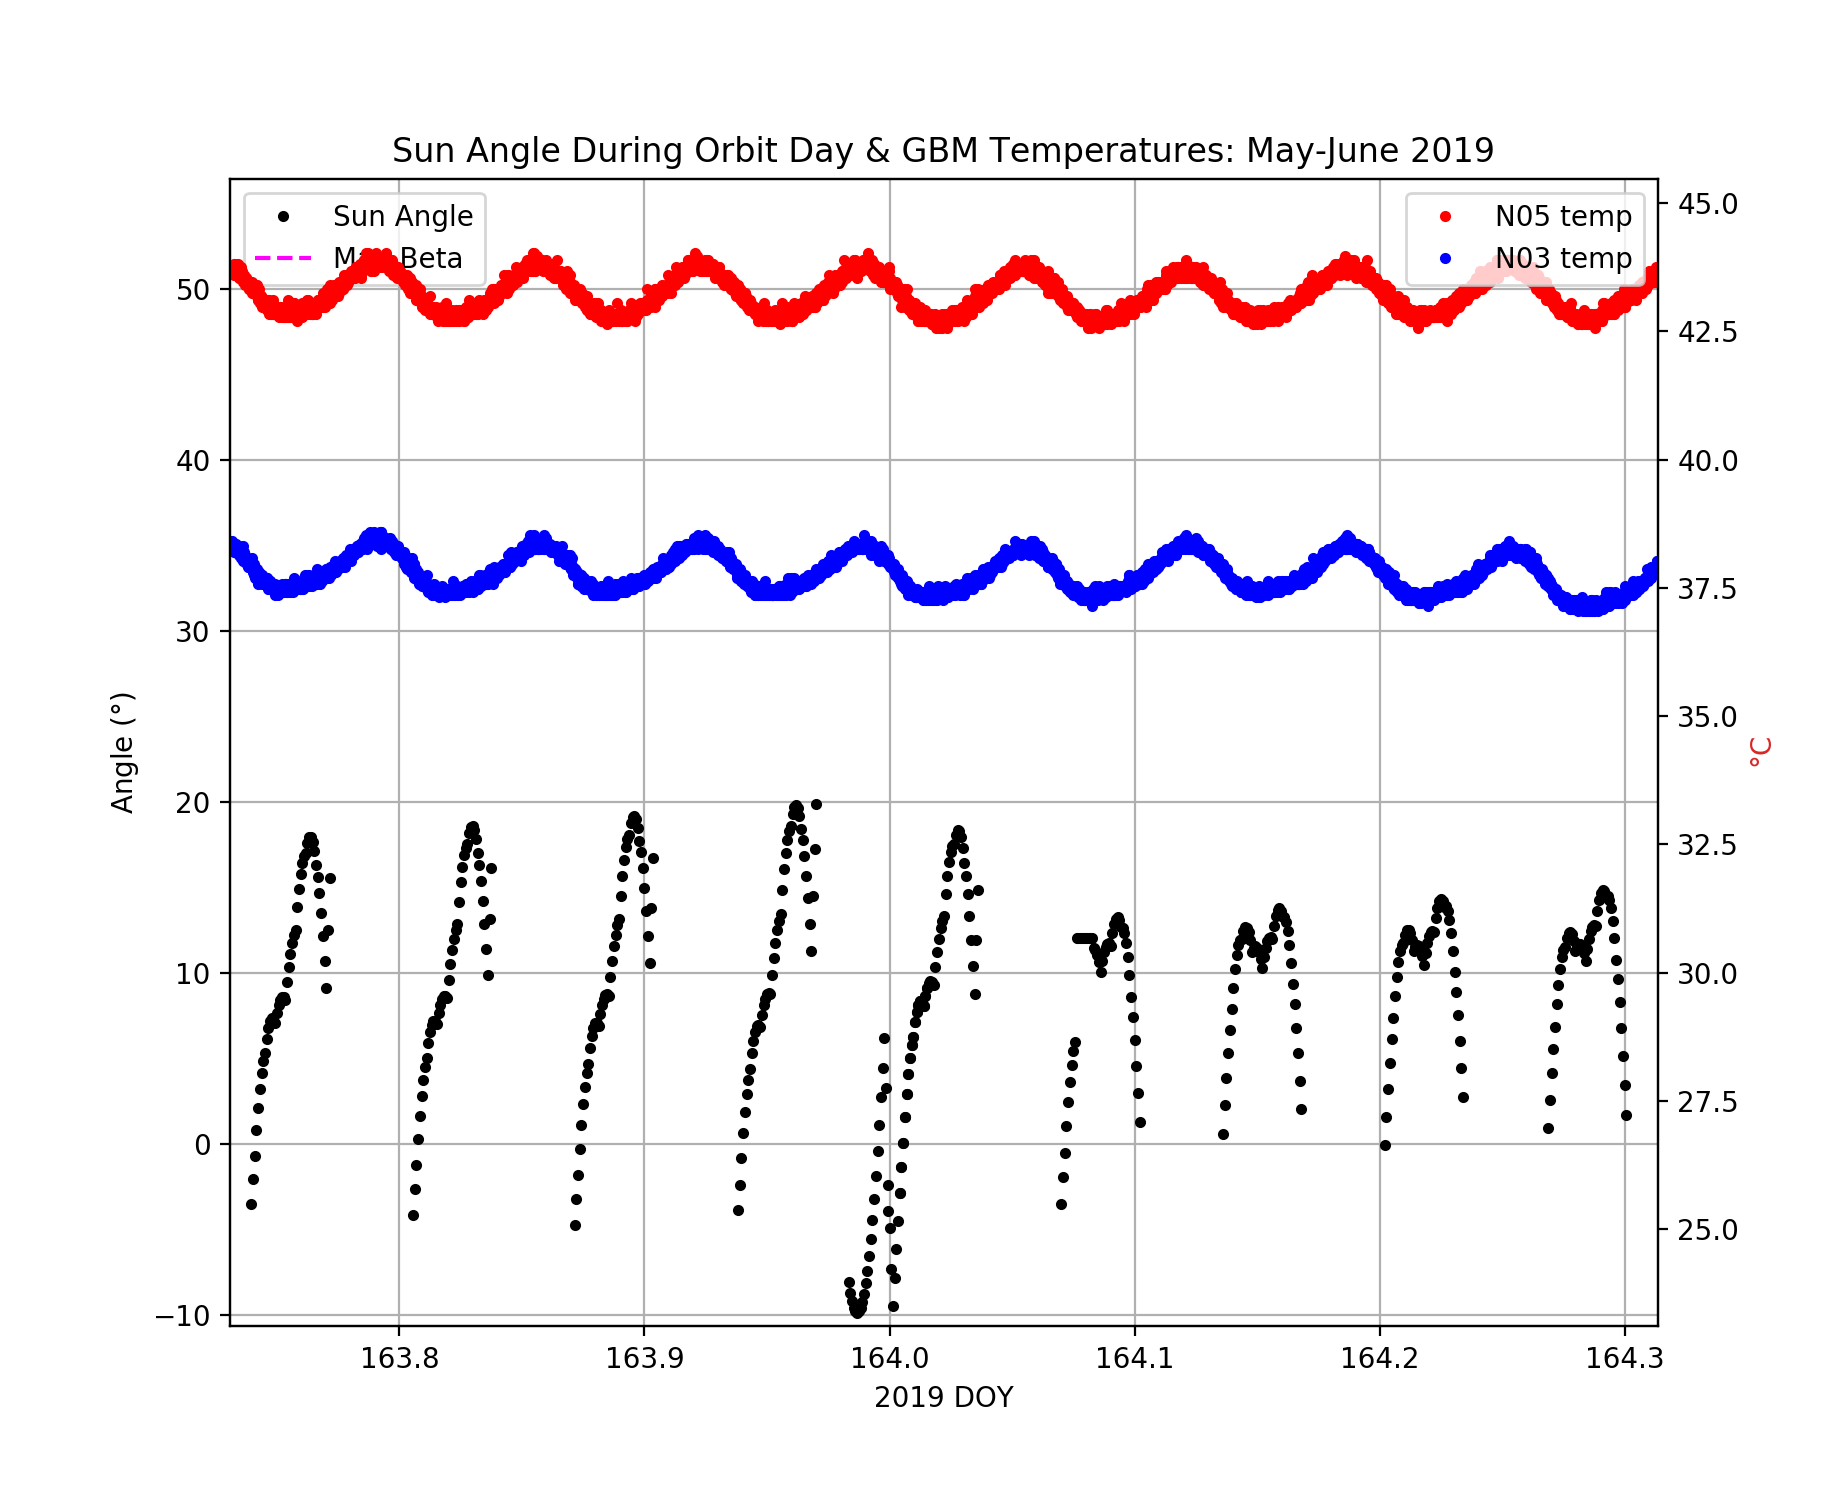
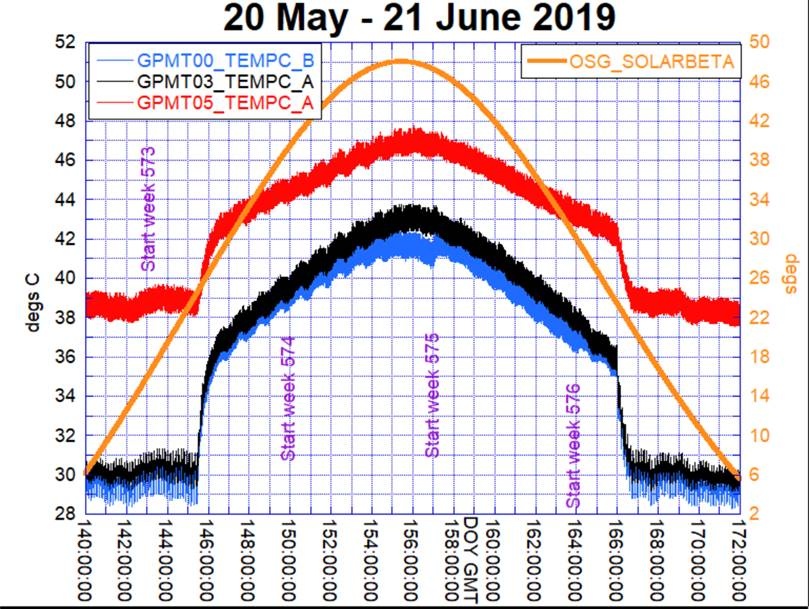
May-June 2019
Peak beta of +48.02 occurred on June 04 (DOY 155) at 16:00 UT. A -50° modified sine profile was used from 2019 DOY 145 to 165.
The progressively larger Sun angles seen from DOY 150 to ~156 can be attributed to the "drift" of orbital period defined in the rock profile with respect to actual orbital period of the spacecraft.