...
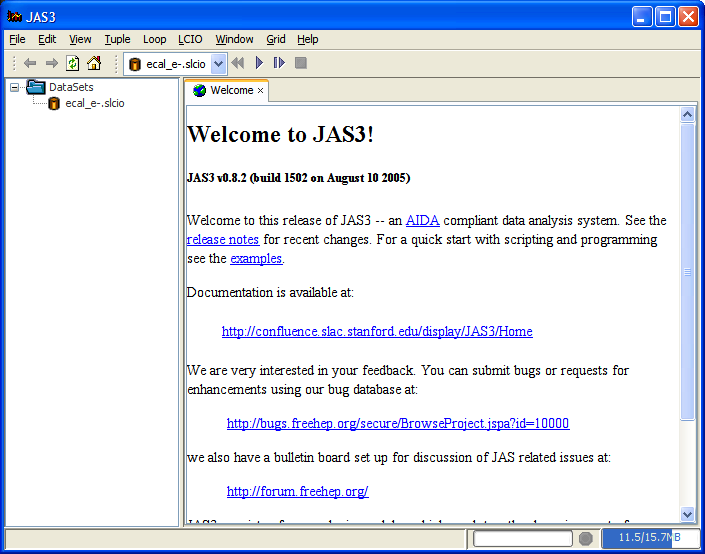
You can now close the plugin manager and open the data file (which should be called ecal-e-.slcio) using the "File", "Open File" menu item in the JAS3 menu bar. Once you open the file it should appear in the JAS3 tree, and a new item should appear in the JAS3 toolbar, allowing you to step through events. You can check that the file contents looks reasonable using two tools, the LCIO Event Browser, and the WIRED4 event display.

To use the Event Browser step to the first event (using the  button in the tool bar) and then from the LCIO menu select "Event Browser".
...
Now you should be able to select "File", "New", "WIRED4 View" in JAS3 and view the event. You should be able to step through different events to see how they look.
Analyzing the Data Files using JAS3
...
The final step in the analysis is to perform a fit to each energy distribution, to compute the measured energy resolution at each incident electron energy. We will fit a Gaussian function to each of the histograms we produced to compute the mean and sigma of the distribution, and we can then compute the energy resolution as sigma/mean. To compare to the published data we can then produce a plot of energy resolution (in percent) vs sqrt(electron energy), and compare to the published data tabulated below.
You have the choice of performing this part of the analysis using either Java, Python or Pnuts (a simple to learn Java-like scripting language). We have provided templates for the solution in each language in the ~//ex4 directory:
...