...
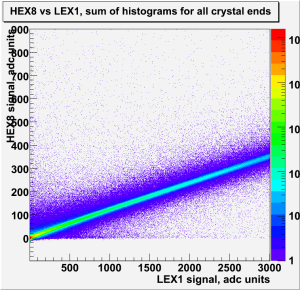
To study nonlinearity down to low energies ~10 MeV comparable to HEX8 noise it is necessary to properly average this noise. This is possible when using ADC units rather than reconstructed energy (or DAC values) because ADC values below pedestal are kept. The folowing plot shows 2d histogram of HEX8 vs LEX1 adc signals for all crystal ends and all events of one on-orbit nomSciOps run (244425100), the only selection is gemDeltaEventTime > 100 us.
To study the deviation from linearity each vertical slice of this 2d histogram was fitted with gaussian and the peak value of HEX8 signal used to find LEX1/HEX8 ratio for this bin. Then all this ratios were normalized to the value corresponding to LEX1 signal 10 MeV ( ~33 LEX1 units). The following plot shows this normalized LEX1/HEX8 ratio versus logarithm of LEX1 signal in MeV (black points). Curve with open circles shows the deviation from linearity obtained by charge injection calibration and used for nonlinearity correction.
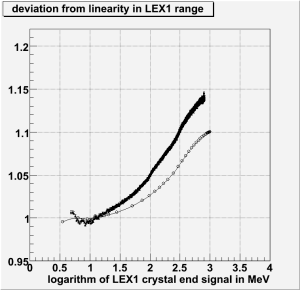
One can see that at high signals (300-1000 MeV) the deviation from linearity measured by real events is ~5% bigger than one measured by charge injection.