...
Include Page COVID-19 Forecasts for the US COVID-19 Forecasts for the US
Top 9 US
...
states by Positivity
...
The positivity rate is "the percentage of positive cases among those who are tested". See https://minnesota.cbslocal.com/2020/07/13/what-exactly-does-the-covid-19-positivity-rate-tell-us/ or https://www.cnn.com/2020/07/07/health/coronavirus-positivity-rate-explainer/index.html for more information. The following chart showing the positivity rate for US states is from https://coronavirus.jhu.edu/testing/testing-positivity where it is stated "On May 12, 2020 the World Health Organization (WHO) advised governments that before reopening, rates of positivity in testing (ie, out of all tests conducted, how many came back positive for COVID-19) of should remain at 5% or lower for at least 14 days."
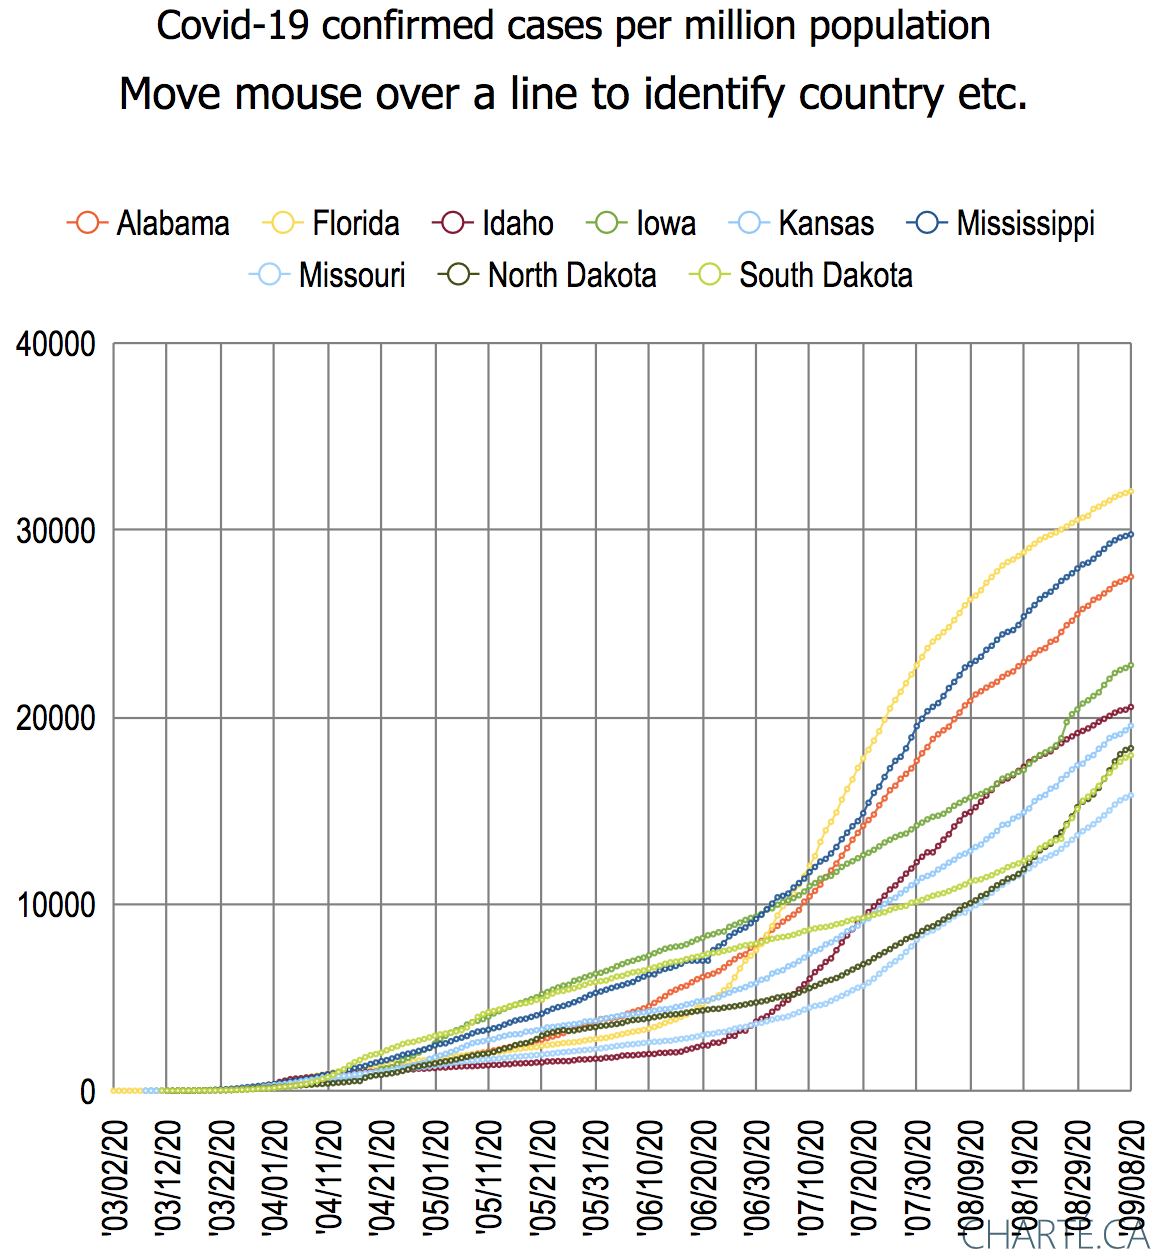
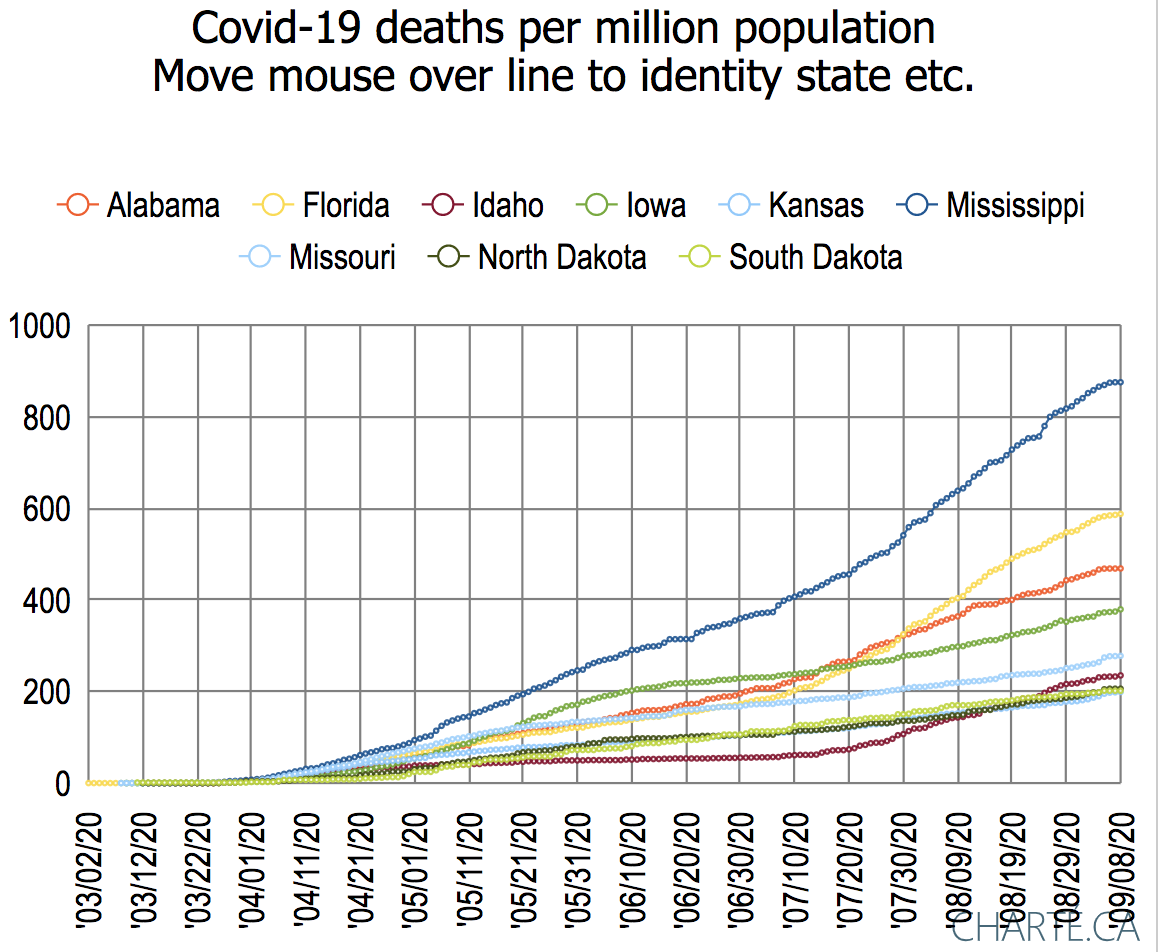
The top 9 states are shown below ranked by their Positivity Rate (from https://coronavirus.jhu.edu/testing/testing-positivity 9/8/2020) together with some demographics and statistics. The smoothing is a 7 day moving average.
- The population is from https://en.wikipedia.org/wiki/List_of_states_and_territories_of_the_United_States_by_population,
- the political leaning is from www.270towin.com updated: Sep. 9, 2020
- the Income per capita is from https://en.wikipedia.org/wiki/List_of_U.S._states_and_territories_by_income.
| State | ID | Population | Positivity | Covid-19 confirmed so far | deaths so far | %deaths/ confirmed | confirmed/ MPop so far | deaths/ MPop so far | smoothed (daily Confirmed/ MPop) | smoothed (daily Deaths/ MPop) | Political leaning | Income per capita ($) |
|---|---|---|---|---|---|---|---|---|---|---|---|---|
| North Dakota | ND | 756927 | 19.58% | 13872 | 156 | 1.12 | 18326.7343 | 206.0965 | 353.3083 | 2.076064 | Safe Republican | 33071 |
| South Dakota | SD | 858469 | 18.73% | 15403 | 173 | 1.12 | 17942.4068 | 201.5215 | 275.2408 | 0.99845539 | Safe Republican | 26959 |
| Alabama | AL | 4858979 | 18.42% | 133606 | 2277 | 1.7 | 27496.7231 | 468.617 | 176.1099 | 2.263850 | Safe Republican | 23606 |
| Kansas | KS | 2911641 | 18.36% | 56854 | 579 | 1.02 | 19526.4457 | 198.8569 | 224.5175 | 2.5513348 | Likely Republican | 27870 |
| Mississippi | MS | 2992333 | 17.28% | 89069 | 2619 | 2.94 | 29765.738 | 875.2368 | 186.0469 | 4.965070 | Safe Republican | 21036 |
| Iowa | IA | 3123899 | 15.31% | 71142 | 1185 | 1.67 | 22773.4635 | 379.3336 | 236.6091 | 2.7438239 | Leaning Republican | 28361 |
| Idaho | ID | 1654930 | 14.78% | 33978 | 389 | 1.14 | 20531.382 | 235.0553 | 140.2735 | 1.8990876 | Safe Republican | 23938 |
| Missouri | MO | 6083672 | 14.5% | 96181 | 1690 | 1.76 | 15809.6952 | 277.7928 | 221.7411 | 3.0057034 | Likely Republican | 26126 |
| Florida | FL | 20271272 | 13.32% | 650092 | 11915 | 1.83 | 32069.6205 | 587.7776 | 134.2646 | 3.8125735 | Tossup | 26582 |
...
Cumulative confirmed cases Click on chart for more details | Cumulative deaths Click on chart for more details |
|---|---|
Covid-19 smoothed confirmed cases per day per million population Click on chart for more details | Covid-19 smoothed deaths per day per million population Click on chart for more details |
|---|---|
Details about the timelines, government resposes to, and impact of Covid-19 on the US states can be found via https://en.wikipedia.org/wiki/Category:COVID-19_pandemic_in_the_United_States_by_state. It is not hard to believe that some of the surges are related to events, behaviors, interventions, and responses. For example:
- In South Dakota, the surge of confirmed cases in July following the July 3rd Mount Rushmore Independence Day celebration. This in turn was followed by a spike in confirmed cases following the Sturgis motorcycle rally August 7-16.
Observations:
...
ratio
| Include Page | ||||
|---|---|---|---|---|
|
...
US States time series plots of Covid-19 cases, May-June
...


