...
| Name | Population (K) | Region | Income per capita ($) | Pop-Density (Kpop/sq-km) | Median Age (yrs) | Covid-19 Information |
|---|---|---|---|---|---|---|
| Argentina | 45195.774 | S America | 20829 | 0.016 | 31.9 | |
| Australia | 25499.884 | Australasia | 49378 | 0.003 | 37.900002 | https://en.wikipedia.org/wiki/COVID-19_pandemic_in_Australia |
| Bolivia | 11673.021 | S America | 7576 | 0.011 | 25.4 | |
| Brazil | 212559.417 | S America | 15553 | 0.025 | 33.5 | |
| Chile | 19116.201 | S America | 24747 | 0.025 | 35.400002 | |
| Ecuador | 17643.054 | S America | 11612 | 0.064 | 28.1 | |
| New Zealand | 4822.233 | Australasia | 40748 | 0.018 | 37.900002 | |
| Peru | 32971.854 | S America | 13463 | 0.026 | 29.1 | |
| South Africa | 59308.69 | Africa | 13526 | 0.049 | 27.299999 |
confirmed cases linear Y-axis Click on chart for more information | confirmed/million population Click on chart for more information | Log10 confirmed/million population Click on chart for more information |
|---|---|---|
 |  |
Observations:

deaths linear Y-axis Click on chart for more information | deaths/million population Click on chart for more information | Log10 confirmed/million population Click on chart for more information |
|---|---|---|
 |  |  |
% Deaths/confirmed Click on chart for more information | Daily confirmed per million population Click on chart for more information | Daily deaths per million population Click on chart for more information |
|---|---|---|
 |  |
Observations:
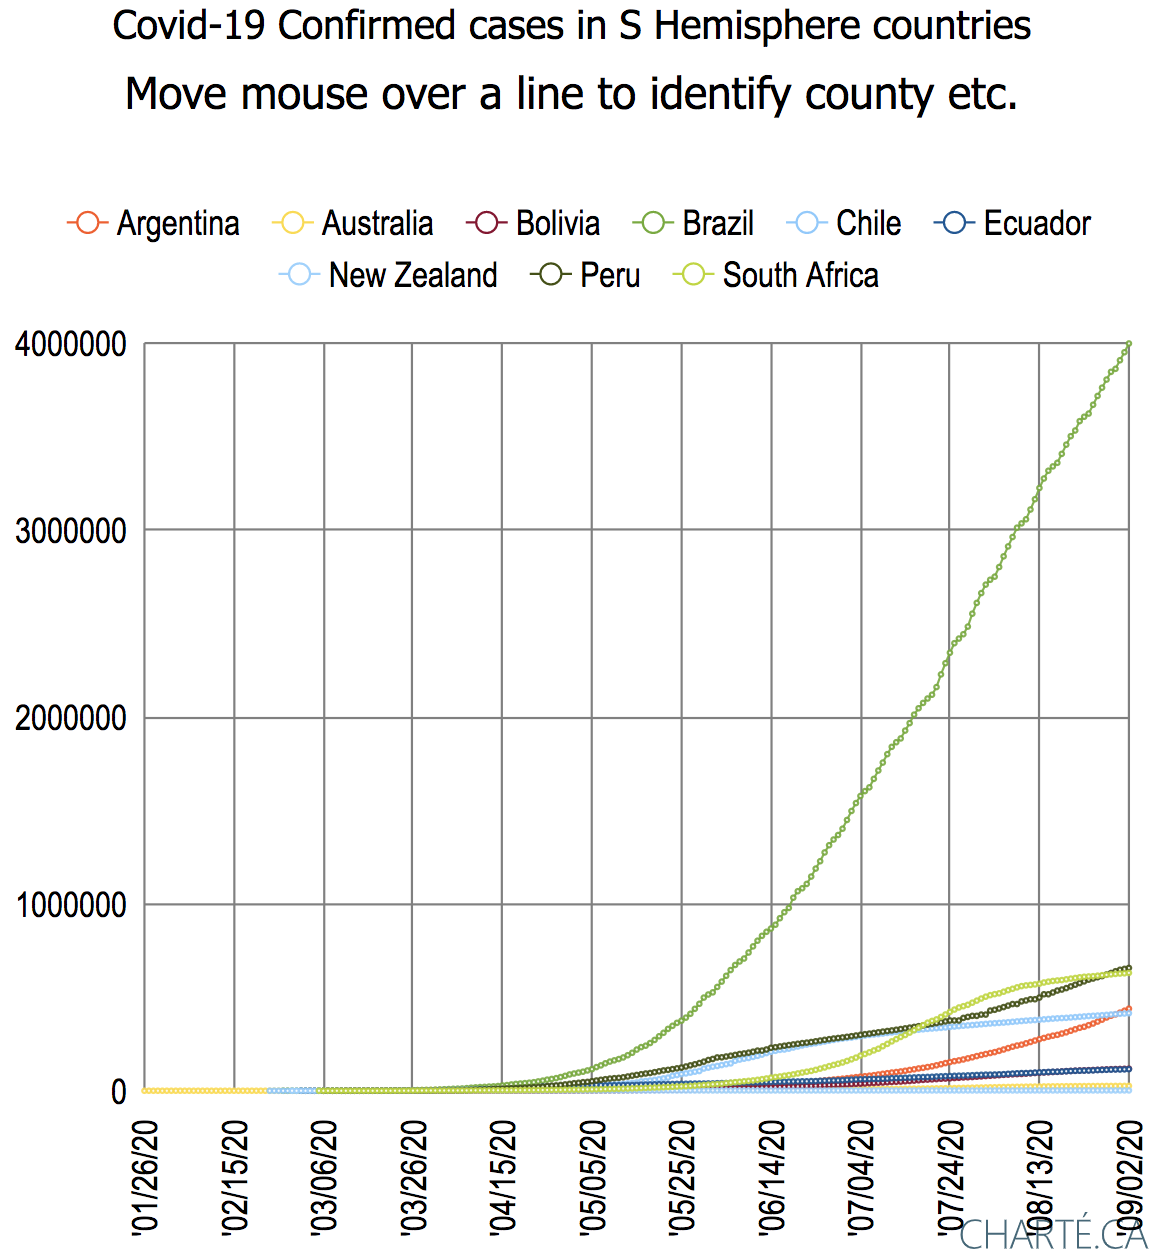
- As would be expected Brazil, with the largest population by far (~ 3.5 times that of the runner up South Africa) had the largest number of confirmed cases.
- Once one normalizes the confirmed cases by the population then Chile takes the lead followed by Peru and then Brazil both of which are catching up with Peru, then a gap before South Africa, Bolivia and Argentina. Ecuador comes next, having considerably flattened its curve compared to the previous nations, and finally Australia and New Zealand.
- On January 26, 2020, Australia was the first of these countries to confirm a case, almost four weeks before the second country (Chile)
- Australia experienced exponential growth in confirmed cases throughout the month of March before dramatically flattening its curve in April.
- Australia then experienced a further rise in confirmed cases starting the second week of June and extending to the third week of August.
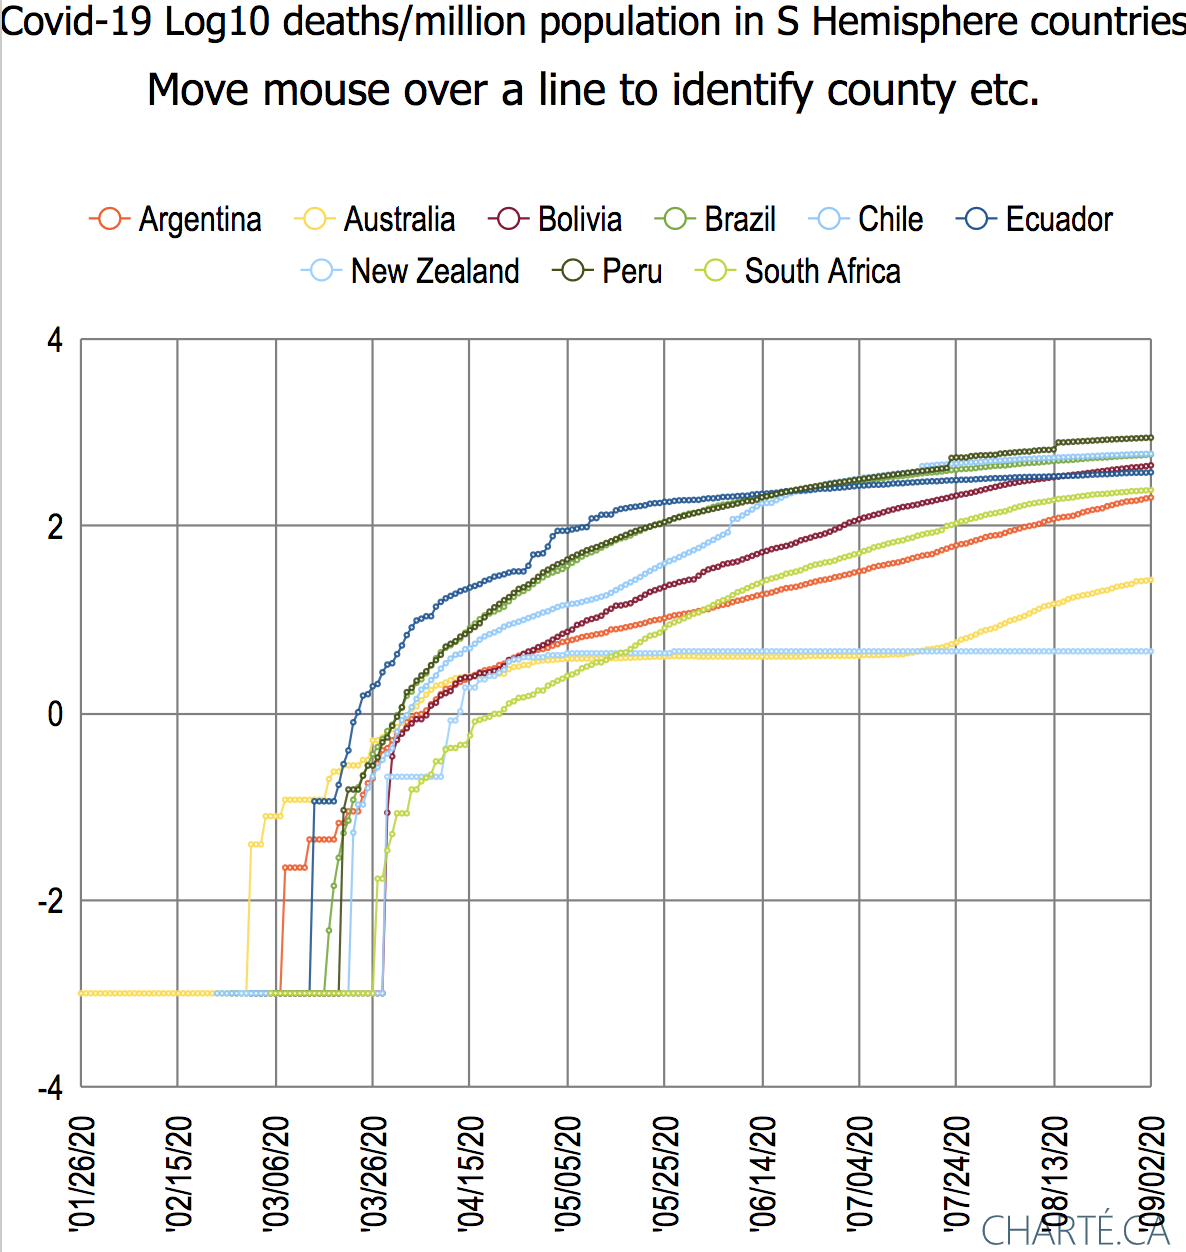
- Looking at the deaths, Brazil again has the most, over four and half time more than the runner up PeruAs would be expected Brazil, with the largest population by far (~ 3.5 times that of the runner up South Africa) had the largest number of confirmed cases.
- Once one normalizes the confirmed cases deaths by the population then Chile takes Peru is the lead leader followed by Peru and then Brazil, then a gap before South Africa, Bolivia and Argentina. Ecuador comes next, having considerably flattened its curve compared to the previous nations, and finally Australia and New Zealand
- It appears that all nations apart from New Zealand and
...
- Chile with Brazil close behind, then Bolivia, Ecuador, South Africa and Argentina.
- The Log10 charts indicate that New Zealand has managed to successfully flatten both its confirmed cases and deaths, while Australia after flattening the curves has experienced a rise in both metrics starting in July.
- It appears that the ratio of deaths/confirmed with time has peaked and is going down for Ecuador, Brazil and Australia. It apears to be rising again for Bo/livia, Peru and Australia
Northern Hemisphere countries with contrasting strategies 8/31/20
...