...
For the IPv4 data measurements using the list of PingER hosts, the script ran for about 6 hours and 45 minutes. The distribution histograms shown below show that the agreement between ping and nping average RTT is good:
PIngER targets from SLAC:
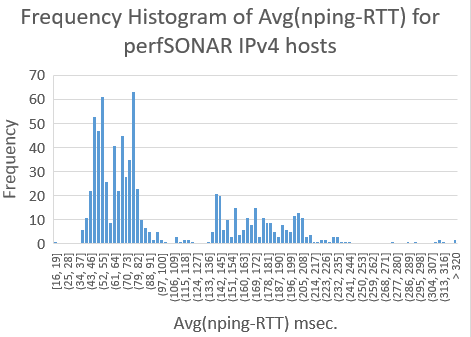
There are 728 PingER hosts responding to both ping and nping on port 80 (there are about 270 responding to port 22), 50% have Average(RTTs) for ping and nping within 2.15ms of one another. The hosts are in 160 different countries with China having the most hosts with 195, followed by the United States with 52, Indonesia with 37, Malaysia with 27 and Pakistan with 13. In terms of regions the top region is East Asia with 206 hosts, 101 from Africa, 63 from Europe and 58 from North America (Canada and the United States). There are 593 host that have 'www' in the name. The range of average ping RTTs is from 0.327ms to 377ms. The range of nping RTTs is from 2.3ms to 387ms.
The Frequency histograms of average ping and average nping RTTS are shown below (Excel spreadsheet is here)
...
To exemplify the differences in the RTTs measured by ping and nping we show the frequency distribution of the differences in the two Average RTTs. The histogram of the differences in the ping and nping averages RTTs is shown below.
Another way of looking at the data is to consider the relative differences, i.e. (Avg(ping_RTT)-Avg(nping_RTT)/(0.5(Avg(ping_rtt)+Avg(nping_RTT)), this gives the distribution below that shows the IQR of the averge difference is ~ 1.2%. If one looks at the hosts that have relative differences of > 22% or less than -22% (about 2% of the hosts), we find most are from China or have low RTTs (< 4 msec).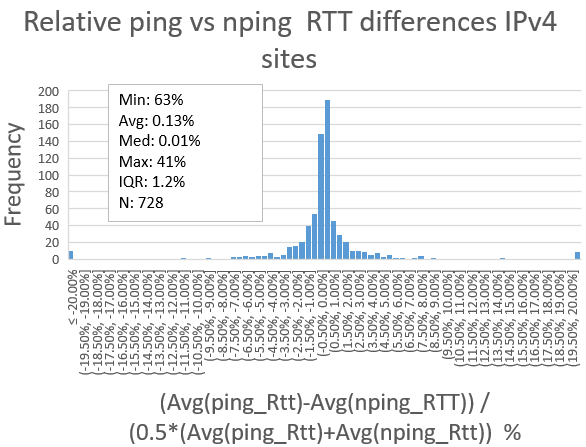
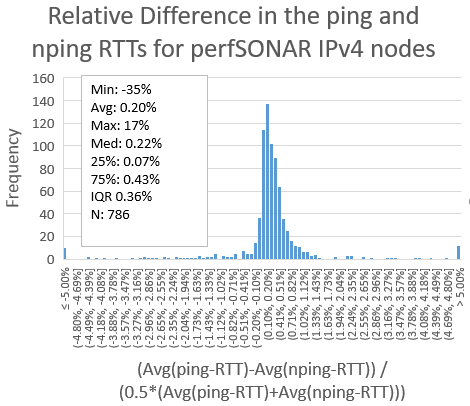
perfSONAR targets from SLAC
There are 786 perfSONAR target hosts that respond to both ping and nping IPv4 measurements. There are 317 in Canada and the US, 134 in 29 countries in Europe, 18 in E. Asia (all in Korea), 14 in Russia, 12 in Africa(Senega(2), Nigeria(1), Uganda(3), Niger(1), Ghana(4), Togo(1)) and 4 in each of S. Asia (3 in India and 1 in Pakistan) and Latin America (Brazil, Ecuador and Puerto Rica(2)). The regions for the other hosts are not identied in the perfSONAR database.
Histograms of the frequency distributions are shown below, the Excel spread sheet is here.:
 |  |  |
IPv6 measurements
PingER hosts seen from SLAC MA
...
- PingER targets: 50% of the 36 hosts measured have average(RTTs) within 0.26ms of oneanother).

Again the relative ping vs nping differences for IPv6 is shown below and shows an IQR of the relative average difference is 0.45%:
perfSONAR targets
From the perfSONAR JSON configuration file we found 154 hosts that have IPv6 addresses (see spreadsheet). Of these (using the perl script bin/ping-vs-tcp-ps-sq.pl --conf ps-v6-sq.cf | tee ps-v6-sq.txt, it ran for about 45 minutes) we found 6 hosts that did not respond to ping6 and 50 for which we were was unable to get the information from nping. This yielded 98 IPv6 capable perfSONAR nodes that respond to ping6 and nping. Of these 53 are in N. America (Canada and the U.S.), 30 in Europe (13 in the United Kingdom), 4 in Russia, and 1 each in Africa (Uganda) and Costa Rica. The spreadsheet is here.
...