...
Model | RA(°) | DEC(°) | Semi Major Axis (°) | Semi Minor Axis (°) | Pos.Ang.(°) |
283,990 | 1,355 | 0,300 | 0,190 | 327,000 | |
Pass 6 | 284.015(+/-0.004) | 1.392(+/-0.005) | 0.335(+0.117 -0.086) | 0.207 (+0.023 -0.021) | 330+/- 25 |
Pass 7 | 284.000(+/-0.006) | 1.374(+/-0.006) | 0.332(+0.109/-0.079) | 0.205 (+0.021/-0.017) | 327 +/-22 |
...
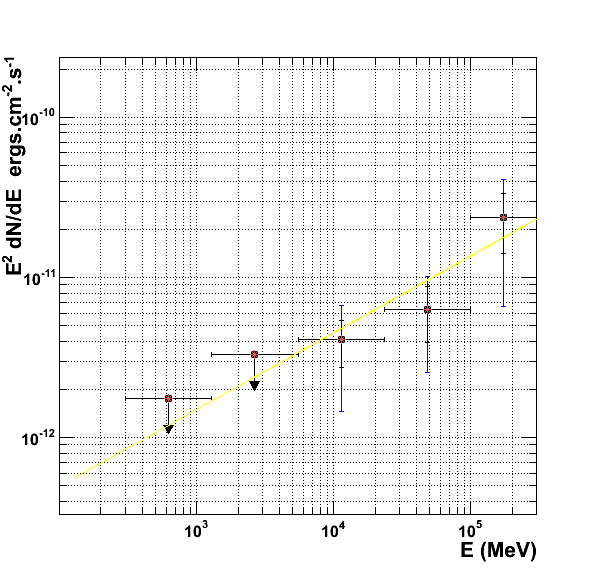
Fig. 11 : SED obtained using gtlike above 300 MeV. The best fit is show shown in yellow.
The source is fitted by a hard power law. The parameters of the best fit are those of the next table :
...
Fig. 13 ?-ray Luminosity of the Pulsar Wind Nebulae as a function of the spin-down
luminosity of the associated pulsar. All the pulsar wind nebulae detected by Fermi are
associated with young and energetic pulsars. Pulsar wind nebulae detected by Fermi are
marked with red stars. Blue squares represent pulsars for which GeV ?-ray emission
seems to come from the neutron star magnetosphere, and not from the nebula.
With more data
To compare our spectral points to those obtained with MAGIC (talk at the ICRC Klepser et al., Mapping the extended TeV source HESS J1857+026 down to
Fermi-LAT energies with the MAGIC telescopes) we reanalyzed the source to 300 MeV using more data (36 months instead of 31). Here are the results obtained : 
Fig. 14 Residual TS map obtained between 10GeV and 300GeV. Here HESS J1857 is not included in the model. The green contours are those obtained using HESS data (Aharonian et al.,2008).
The position of the Fermi excess is consistent with those of HESS. The black circle represents the position of PSR J1856+0245.
IRF | Int Flux(100MeV-100GeV) | Index | Lower limit (MeV) | Upper limit (GeV) | TS | gal |
|---|---|---|---|---|---|---|
P7SOURCE_V6 | (5.79 ± 0:75 ± 3.11)X10^{-9} | 1.52 ± 0.16 ± 0.55 | 100 | 100 | 38.7 | 1.09 |
Table 7: Best fit parameters for 36 month of data fitting between 300MeV and 300GeV.
Fig. 15 : SED obtained using gtlike above 300 MeV. The best fit is show in yellow. Statistic and systematics error bars are respectively the black and blue lines.
We added one source of systematics using a template consistent with those of HESS data (Aharonian et al.,2008). The SED thus obtained is consistent with the one shown by Klepser et al. at the ICRC.
Using our model we derived and upper limit on the DC emission of the pulsar :
F(100MeV-100GeV)< 9.77×10?9 ph/cm2/s leading to a limit on the gamma-ray luminosity of 8.27 × 1035erg/s.
In the paper
I'm now writting the draft of an A&A letter with M.-H. Grondin, M. Lemoine-Goumard, A.Van Etten, B. Stappers, A. Lyne, C. Espinoza.
...
I would like to show 3 figures which are th Fig. 4, 8 and 1214 and 16(comming soon).
The draft is coming soon.
...