...
Page
...
under
...
construction.
...
This
...
page
...
summarize
...
the
...
main
...
points
...
of
...
the
...
analysis
...
I
...
did
...
on
...
HESS
...
J1857+026
...
using
...
to
...
sample
...
of
...
data.
...
The
...
first
...
analysis
...
used
...
31
...
months
...
of
...
data
...
collected
...
from
...
August
...
4,
...
2008,
...
until
...
March
...
2011.
...
Only
...
gamma-rays
...
in
...
the
...
Diffuse
...
class
...
events
...
were
...
selected
...
and
...
we
...
excluded
...
those
...
coming
...
from
...
a
...
zenith
...
angle
...
larger
...
than
...
100°.We
...
have
...
used
...
the
...
P6_V11_Diffuse
...
instrument
...
response
...
functions
...
(IRFs).
...
We
...
included
...
in
...
the
...
model
...
all
...
the
...
sources
...
of
...
the
...
18
...
month
...
catalog
...
and
...
assiociated
...
diffuse
...
files.
...
The
...
second
...
analysis
...
used
...
the
...
same
...
amount
...
of
...
data.
...
Only
...
gamma-rays
...
in
...
the
...
source
...
class
...
events
...
were
...
selected
...
and
...
we
...
excluded
...
those
...
coming
...
from
...
a
...
zenith
...
angle
...
larger
...
than
...
100°.
...
We
...
have
...
used
...
the
...
P7_V6_SOURCE
...
IRFs.
...
We
...
included
...
in
...
the
...
model
...
all
...
the
...
sources
...
of
...
the
...
2FGL
...
catalog
...
and
...
assiociated
...
diffuse
...
files.
...
The
...
Region
...
of
...
Interest.
...
HESS
...
J1857+026
...
is
...
in
...
the
...
same
...
region
...
than
...
the
...
SNR
...
W44
...
which
...
is
...
the
...
brightest
...
source
...
of
...
the
...
region. 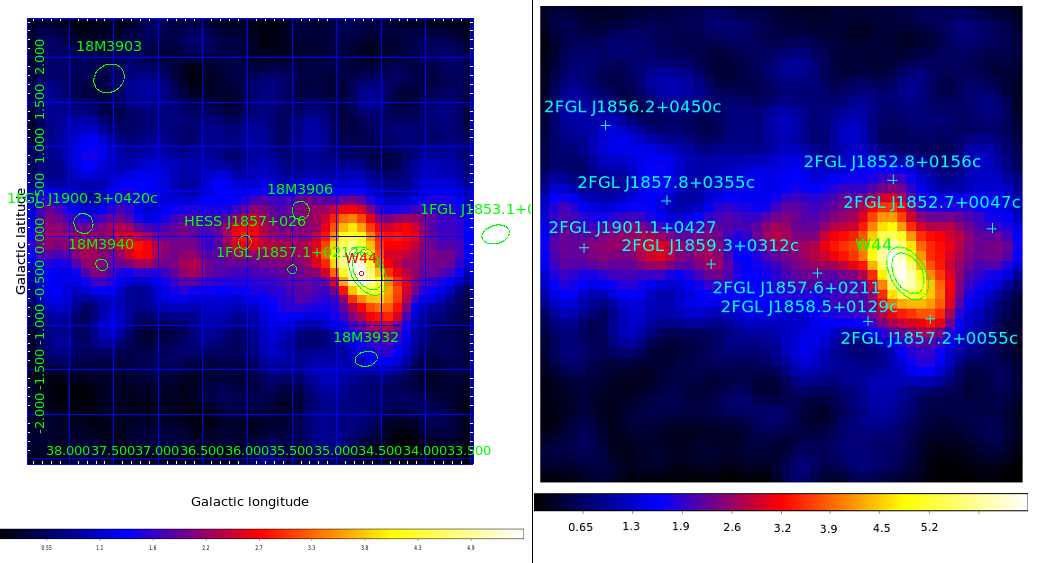
Fig 1. Counts map of the region above 6 GeV. Left Pass 6 analysis with 18 months catalog sources in green. Right : Same picture corresponding to the Pass 7 analysis with 2FGL sources represented in blue.
W44
The shape of W44 was fitted by an Elliptical Ring (ref. 1) and it spectra by a broken power law.
We saw an excess close to W44 and tried to refit the source to take into account this excess.
We refitted again the spectra of W44 by a Log-Parabola and studied the shape of W44.
The main point is that the results are consistent with previous work and with 2FGL cat.
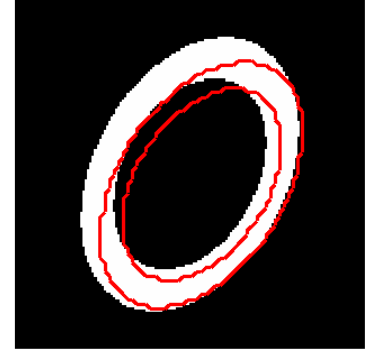
Fig. 2. Comparison between the result of ref. 1 (red contours) and our results using pass 6 (white ring) . There is no error taken into account in this templates. Figure to be updated with Pass 7
Model | RA(°) | DEC(°) | Semi Major Axis (°) | Semi Minor Axis (°) | Pos.Ang.(°) |
283,990 | 1,355 | 0,300 | 0,190 | 327,000 | |
Pass 6 | 284.015(+/-0.004) |
...
1.392(+/-0.005) |
...
0.335(+0.117 |
...
-0.086) |
...
0.207 |
...
(+0.023 |
...
-0.021) |
...
330+/ |
...
- |
...
25 | |
Pass 7 | 284.000(+/-0.006) |
...
1.374(+/-0.006) |
...
0.332(+0.109/-0.079) |
...
0.205 |
...
(+0.021/-0.017) |
...
327 +/-22 |
...
Table
...
1.
...
Parameters
...
obtained
...
by
...
fiting
...
the
...
shape
...
of
...
W44.
...
The
...
main
...
point
...
is
...
that
...
all
...
of
...
these
...
values
...
are
...
consistent
...
with
...
the
...
work
...
of
...
Tanaka
...
et
...
al.
...
2010.
...
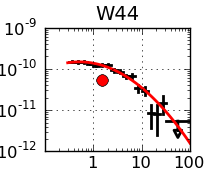
Fig.
...
3
...
SED
...
of
...
W44
...
given
...
by
...
pointlike.
...
Adding
...
a
...
new
...
source
...
to
...
Pass
...
7
...
Analysis
...
section
...
under
...
construction
...
Using
...
2FGL
...
sources,
...
Pass
...
7
...
IRFS
...
and
...
associated
...
diffuses,
...
we
...
found
...
a
...
low
...
energy
...
excess
...
quickly
...
decreasing
...
with
...
energy.
...
To
...
prevent
...
contamination
...
from
...
this
...
source
...
on
...
HESS
...
J1857
...
we
...
analysed
...
it.
...
The
...
best
...
fit
...
we
...
obtained
...
is
...
a
...
point
...
source
...
located at
RA=283.58
...
DEC=2.98
...
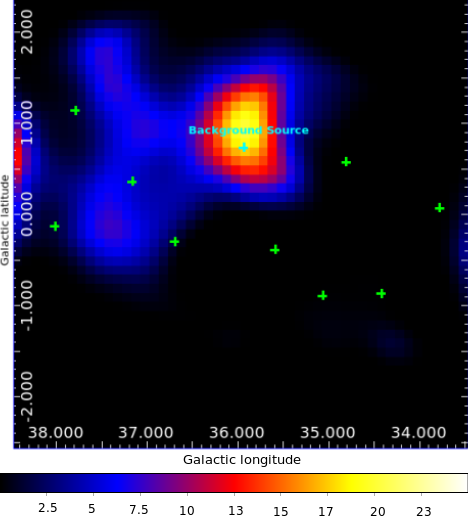
Fig.
...
4.
...
Residual
...
TS
...
map
...
between
...
100MeV
...
and
...
1.3GeV
...
using
...
pointlike.
...
Green
...
crosses
...
represents
...
2FGL
...
sources
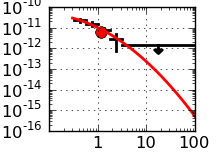
Fig. 5. SED of the source using pointlike.
The best fit using gtlike provided the following parameters alpha = 3.5 +/- 0.2, beta = 0.6 +/- 0.1, Eb ? 1.2 GeV, and N_0 = (3.1 +/- 0.5) X 10^{-12} photons/MeV/cm^2/s.
...
HESS
...
1857+026
...
Morphology
...
above
...
10GeV
...
We
...
made
...
an
...
analysis
...
of
...
the
...
morphology
...
of
...
HESS
...
1857+026
...
above
...
10GeV.
...
Three
...
hypotheses
...
were
...
tested
...
:
...
point
...
source,
...
gaussian
...
and
...
disk.
...
No
...
significant
...
extension
...
was
...
found
...
as
...
can
...
be
...
seen
...
in
...
the
...
following
...
table.
...
The
...
delta
...
show
...
that
...
we
...
do
...
not
...
detect
...
any
...
extension
...
of
...
the
...
source.
...
Hypothesis | Point | Gaussian | Disk | ||
|---|---|---|---|---|---|
TS | 33.38 | 41.35 | 42.21 | ||
Loglike | -48201.50 | -48197.55 | -48197.98 |
|
Table 2. TS and Loglike found above 10GeV for a point source, a gaussian and a Disk.
Fig. 4. Excess TSMap of a 10° * 10° roi around HESS 1856+026.
Fig. 5 Zoom of the previous TS map with a factor of 5. The green square represent an 2° * 2° roi and the green contours are those of HESS source.
Bibliography :
(1) Abdo et al., Science, 327, 1103-1106, 2010