"Data analysis == Piece of cake"
Sections in this tutorial
It is always a good idea for the people doing analysis to be able to look at their detector images and probe intensity values. Given that a typical LCLS experiment has millions of snapshots to choose from, it is also critical that you can quickly select images of interest and set regions of interest using masks. By the end of this tutorial, you will be able to browse images, jump to images of interest, generate masks, and find hits.
Citation for psocake (and other psana-based programs):
@article{Damiani:zw5004,
author = "Damiani, D. and Dubrovin, M. and Gaponenko, I. and Kroeger, W. and Lane, T. J. and Mitra, A.
and O'Grady, C. P. and Salnikov, A. and Sanchez-Gonzalez, A. and Schneider, D. and Yoon, C. H.",
title = "{Linac Coherent Light Source data analysis using {it psana}}",
journal = "Journal of Applied Crystallography",
year = "2016", volume = "49", number = "2", pages = "672--679", month = "Apr",
doi = {10.1107/S1600576716004349}, url = {http://dx.doi.org/10.1107/S1600576716004349}, }
Starting psocake in SPI mode
Make sure you have the psana environment setup (psana python Setup) before starting this tutorial. Also, check out a kerberos ticket by typing “kinit” which is needed for communicating with the experiment e-Log.
Type "psocake" on your terminal to open up the GUI. For single particle imaging, we will need to open it in spi mode (-m):
$ psocake -m spi
1) There are four parameters required to uniquely identify an image at LCLS. Type the experiment name, run number, detector name, and event number in the Experiment Parameters panel.
For this tutorial, we will look at experiment cxitut13, run 10, detector DscCsPad, event 11.
Note that available detector names will be printed on the terminal once you have typed in the experiment name and the run number.
#######################################
# Available area detectors:
# ('CxiDs1.0:Cspad.0', 'DscCsPad', '')
#######################################
2) You can specify the experiment parameters as command line arguments in psocake using the psana-style experiment run string:
$ psocake exp=cxitut13:run=10 -d DscCsPad -n 11 -m spi
3) You can also use the -e and -r arguments for the experiment and the run number:
$ psocake -e cxitut13 -r 10 -d DscCsPad -n 11 -m spi
To check psocake version:
$ psocake --version
Don’t worry if you don’t remember these arguments. For argument options, use --help:
$ psocake --help
Mask making
In this example, let's mask out pixels that should not be used for analysis, mask out the jet streak at the centre of the detector, and mask out the water ring.
Note: the Image Panel must be in the default "greyscale" colormap for the mask colors to display properly.
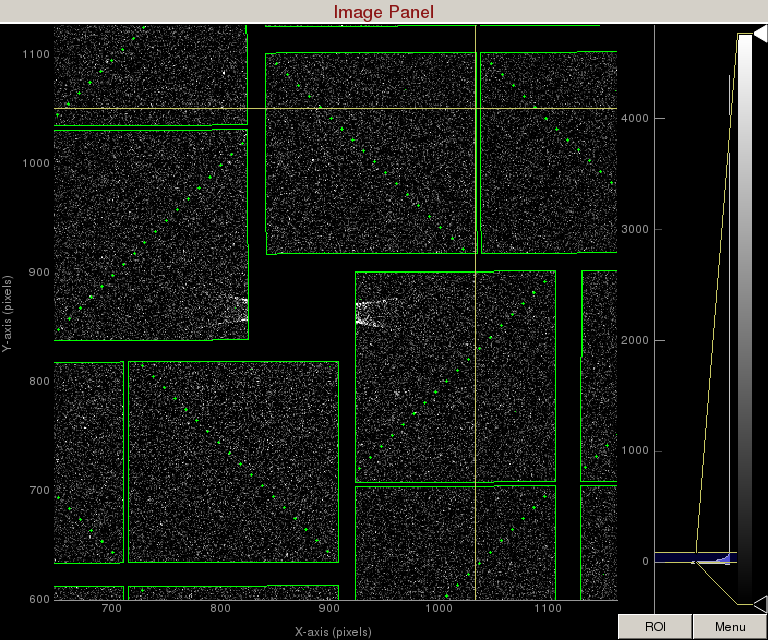
1) On the mask panel, click on "Use psana mask". This will mask out the following pixels that should not be used for analysis; calib, status, edge, central, unbonded pixels, unbonded pixel neighbor pixels. These pixels are shown as green on the image panel.
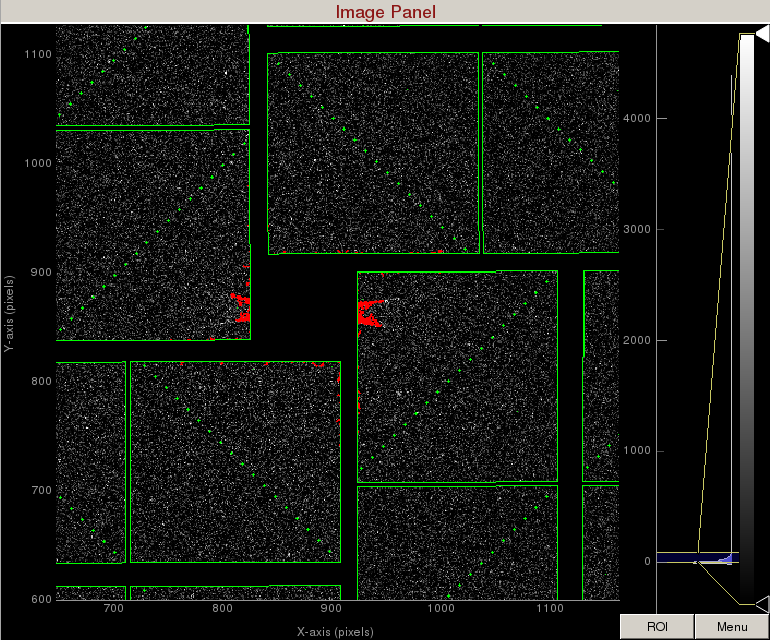
2) On the mask panel, click on "Use streak mask". This will mask out strong intensities originating from the edges of the central asics.
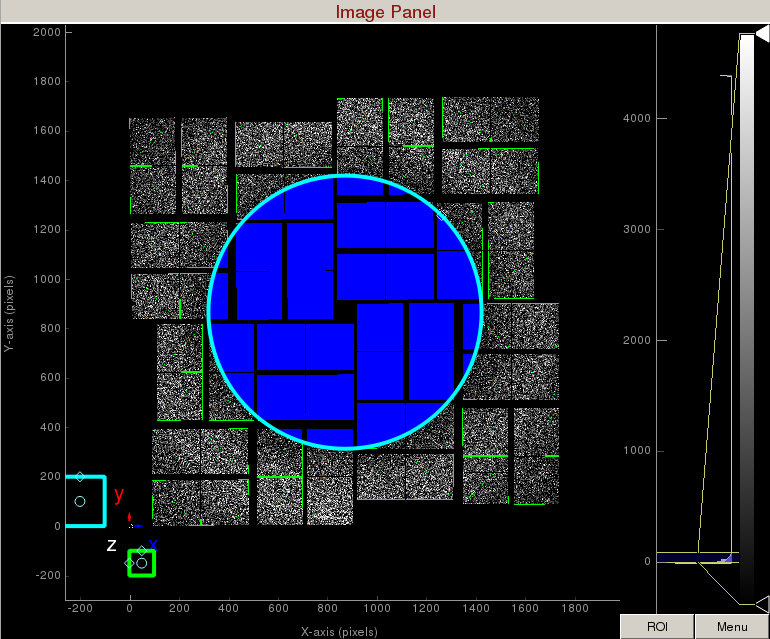
3) To make a donut mask over the water ring, click on "Use user-defined mask". This will bring up a cyan circle and cyan square mask generator.
Select "Toggle" in Masking mode. Move the cyan circle to the centre of the detector by dragging the circle. Resize the cyan circle by dragging the diamond on the perimeter. Once you are happy with the position, click "mask circular ROI" button on the mask panel.
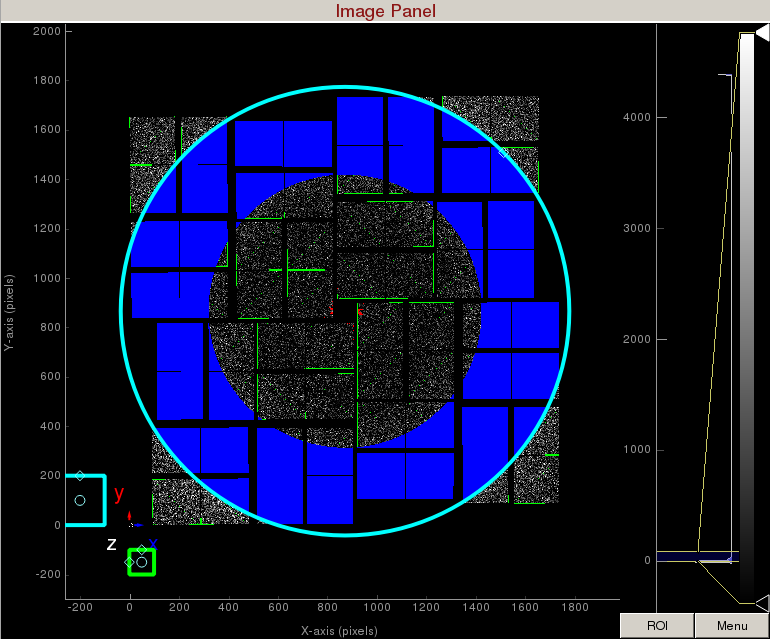
Increase the cyan circle again by dragging the diamond on the perimeter. Click "mask circular ROI" button on the mask panel. Because we are in the "toggle" mode, the previous mask gets toggled and disappears. The area that does not overlap with the previous mask get masked out.
To save the user-defined mask, click on "Save static mask" on the mask panel which will save the mask in the scratch folder. For this example, the mask will be saved here:
/reg/d/psdm/cxi/cxitut13/scratch/<username>/psocake/r0010/mask.npy (3D ndarray)
/reg/d/psdm/cxi/cxitut13/scratch/<username>/psocake/r0010/mask.txt (2D text)
You can load the user-defined mask using the "Load mask" button and selecting mask.npy.
Hit finding
In the Hit Finder panel set the "Algorithm" to “photonFinder”. For each image, the photonFinder will calculate number of pixels that are above a threshold.
To set this threshold, expand the photonFinder parameter list by clicking on the + sign under Algorithm.
- Set ADUs per photon: 200
In this example, we will try to count the number of pixels generated by the Bragg spots inside the water ring. So let's generate a mask that looks like this:

The output directory on the hit finder panel should already be automatically set to: /reg/d/psdm/cxi/cxitut13/scratch/<username>/psocake
Since we are analyzing run 10, /r0010 directory will be generated under the output directory.
The default setting will analyze run 10 on psanaq with 24 CPUs. Number of events to process set to -1 analyzes all the events.
Click "Launch peak finder”. For this demo, let's analyze only 30 events with 2 CPUs
- Run(s): 10
- CPUs: 2
- Number of events to process: 30
Note: You can launch hit finding jobs on multiple runs, e.g. Run(s) 1,10:13 will launch peak finding on runs 1, 10, 11, and 13.
The CXIDB file is generated in the output directory in the following format: <experiment name>_<4-digit run number>.cxi (i.e., /reg/d/psdm/cxi/cxitut13/scratch/<username>/psocake/r0010/cxitut13_0010.cxi)
As an aside, you can check the status of launched jobs by typing "bjobs" in your Terminal. This will display the job ID and the status amongst other information.
A logfile of the peak finding is also saved under the same directory, .<jobID>.log. Note the "." in front of the logfile name.
If the status stays in PEND or SUSP mode for awhile, then you may want to kill the jobs. To kill a batch job, type "bkill <jobID>". For more information, please refer to: Submitting Batch Jobs
Jumping to interesting images based on hit finder
Once you have submitted the hit finder job, let's plot the number of pixels found above the threshold for each event.
In the small data panel, you should already see the CXIDB filename and dataset displayed:
- filename: /reg/d/psdm/cxi/cxitut13/scratch/<username>/psocake/r0010/cxitut13_0010.cxi
- dataset: /entry_1/result_1/nHitsAll
"/entry_1/result_1/nHitsAll" is an array containing number of pixels found above the threshold for each event. Unfortunately the naming convention is cryptic, but it is how it is named inside a CXIDB file.
This should load a plot of all the pixels above a threshold per event found so far. Click "Refresh" to update the plot even if your batch job is still running.
You can click on the red marker in the plot to jump to the corresponding events. You should .
Saving hits in cxidb format
In the "Hit Finder" panel, we can save the hits in cxidb format. We define a hit as all the events with the metric /entry_1/result_1/nHitsAll above "Minimum threshold".
Optionally, if your data has high background scattering that you wish to subtract away then set the "Background threshold". By default, -1 will not perform any background subtraction. Otherwise, /entry_1/result_1/nHitsAll below "Background threshold" will be considered images containing background only.
Check you are ok with the queue and number of CPUs.
Click on "Save hits" to launch a batch job that will save the hits here:
Filename: /reg/d/psdm/cxi/cxitut13/scratch/<username>/psocake/r0010/cxitut13_0010.cxi
Dataset: /entry_1/instrument_1/detector_1/data
Bug/Comments:
Please send bug reports/comments:
Overview
Content Tools