Content
Login
In order to work with data on shared memory one has to login on specific monitoring node which is set in sxr experiment configuration file. Currently monitoring node is daq-sxr-mon06. It can be accessed through the chain of nodes (depending on where you are now):
ssh -Y [<user-login-name>@]psdev
e.g.-> dubrovin@psdev7a

ssh -Y [<user-login-name>@]sxr-daq
e.g.-> dubrovin@sxr-daq

ssh -Y [<user-login-name>@]daq-sxr-mon06
e.g.-> dubrovin@daq-sxr-mon06
Account sxropr do not have a permission to see the data and can't be used to run this app in full scale...
Make sure that your login name have a permission to see xtc and calib data for your experiment, e.g.
ls /reg/d/psdm/SXR/sxrx22915/xtc/
ls /reg/d/psdm/SXR/sxrx22915/calib/
see the list of files w/o permission issues or check permission directly
id <username>
getfacl /reg/d/psdm/SXR/sxrx22915/xtc/
If you can't see xtc files or calib directory, talk to POC.
Setup environment
source /reg/g/psdm/bin/conda_setup
source conda_setup --reldir /reg/neh/home/dubrovin/LCLS/con-ana-emon
First command sets regular psana-conda environment for current default release. Second command is required in current development mode to use updated version of code on the top of stable release con-ana-emon.
Run application
cd <any-directory>
emon
Application saves/reads a file with configuration parameters in local directory (should have write/read permission).
The file with configuration parameters makes life easy at restart application - most of parameters selected in previous session are already defined.
Configuration
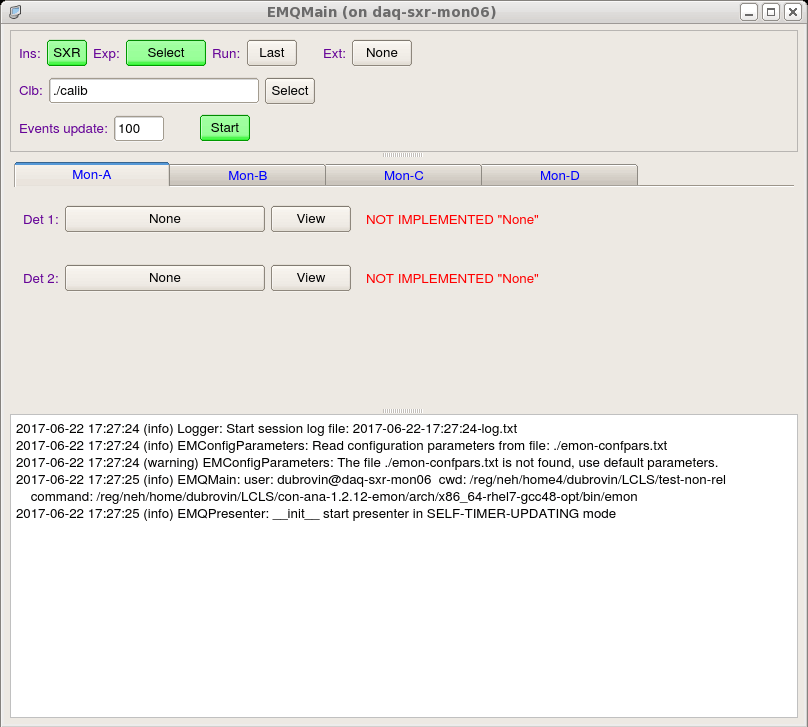
Main control window started from scratch and with configured fields:
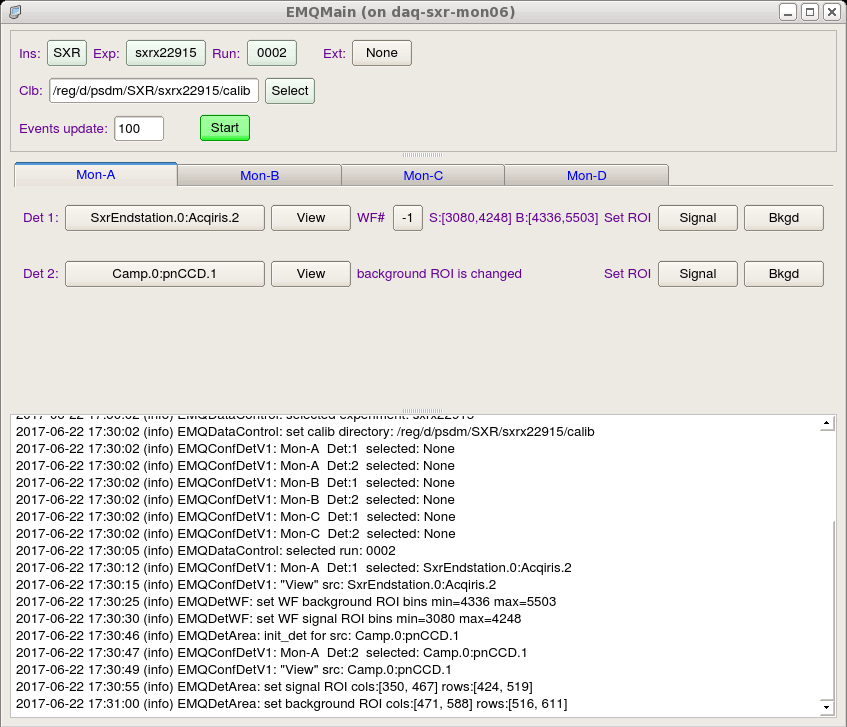
Set application configuration parameters in main GUI
- Exp:Select ->
- Run -> 2
- Ext -> shmem ### make sure that daq is running or use None to load data from xtc file
- Select one of three monitor tabs, e.g. Mon-A
- Det1: -> GMD, WF or Area -> View -> scroll/drug for signal, set ROI Signal; scroll/drug for background, set ROI Background,
- Det2: -> GMD, WF or Area -> View -> ...
- Select one of three monitor tabs, e.g. Mon-B
- Det1: ->...
- Det2: ->...
Events update (type in (int) number ~100 or 200)
Start
Set signal and background ROI
Setting ROI is very similar for Waveform and area detectors as shown below.
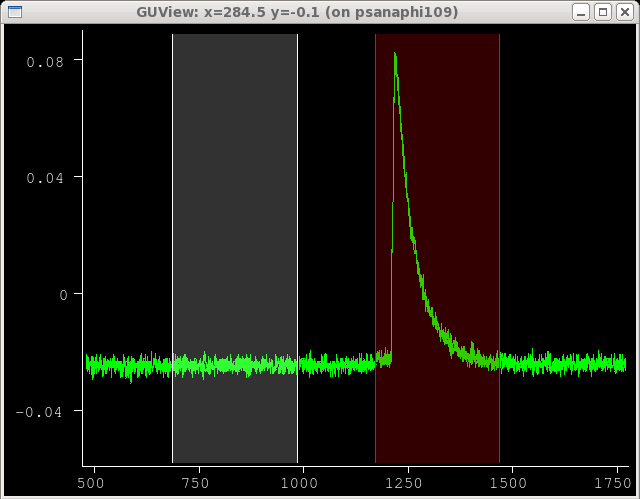
Waveform detector
- View waveform for selected source and channel
- Select ROI on image by click-drag-and-drop image and scrolling mouse to change zoom.
- Click Set ROI Signal/Bkgd button
- Zoom out to see entire selection
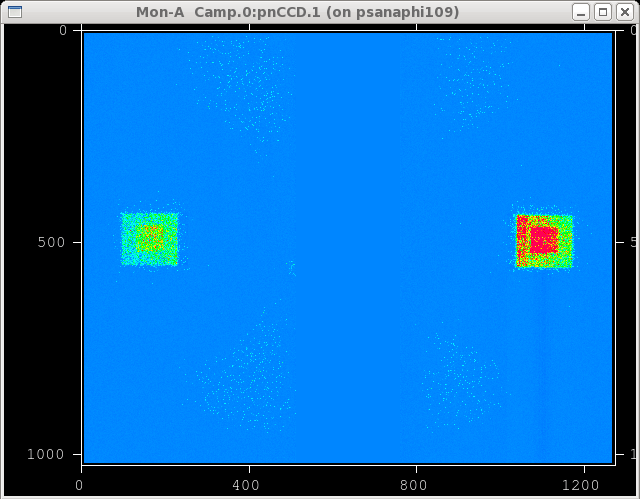
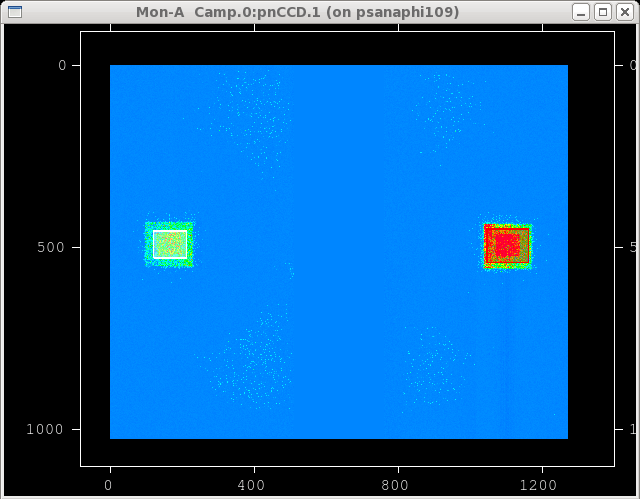
Area detector
- View area detector image for selected source
- Select ROI on image by click-drag-and-drop image and scrolling mouse to change zoom.
- Click Set ROI Signal/Bkgd button
- Zoom out to see entire selection
Monitoring plots
When both detectors of the monitor are set, monitoring plots will show up and update automatically after collection of desired number of events.
Three plots are implemented: correlations, residuals, and pearson-r vs time:
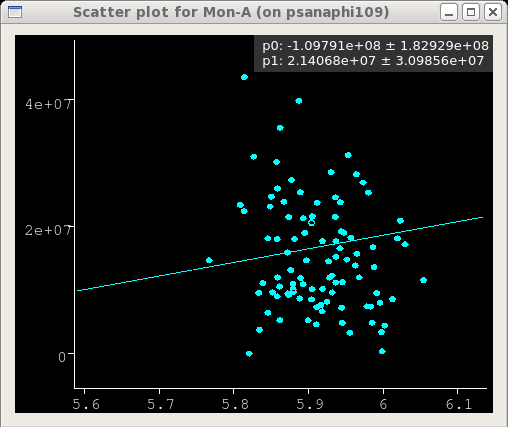
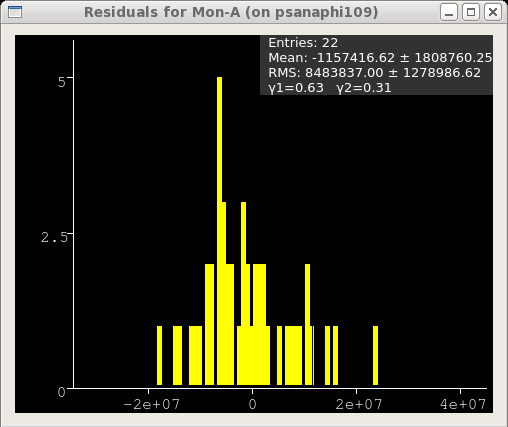
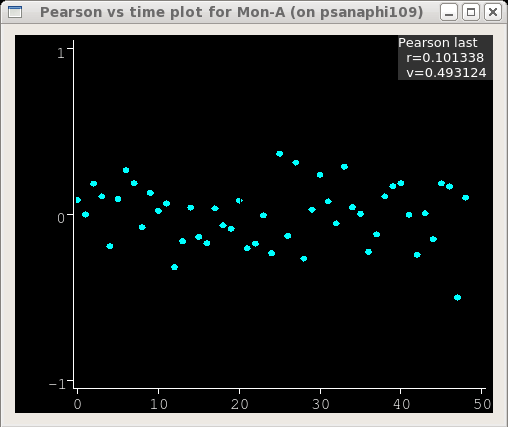
If any of plots need in minor scale correction, it can be done by click-drag-and-drop image. For completely off-scale plot it could be easier to close it, then plot will be re-drown in the next update with current scale.
Saved files
At exit emon saves a couple of useful files with configuration parameters and session log-file:
./emon-confpars.txt
/reg/g/psdm/logs/emon/2017/06/<log-file>.txt
What if something does not work?
This is a new app, so it is not perfect and some glitches are very possible. Many protections for different situation are included, but most likely not all. Below is a most probable list of problems with recommendations what to do if it happens.
| # | Problem | Reason | Solution |
|---|---|---|---|
| 1 | Everything is frozen and app does not respond on any button |
| kill and restart app:
|
| 2 | Plot does not show anything |
| close plot, at next update it will be re-opened with current scale |
| 3 | Plot shows two graphics... | It happens due to non-synchronous access to graphic objects. Previous event is not cleaned up. | Wait for next event for monitoring plots or click "Next" button for detector plot |
| 4 | Configuration should be completely different... | May be needed in changing run or experiment, or in order to start configuration from scratch | rm emon-confpars.txt |
References
Overview
Content Tools