- Created by Mikhail Dubrovin, last modified on Aug 07, 2023
Content
E-mail exchange
2018-11-12 Chris F - references Expand source
Ford, Christopher
Mon 11/12/2018, 4:30 PM

Hi Mikhail,
Currently there is no documentation for the JSON messages, only prototype code.
Thanks,
-caf

See create_msg() and its context in collection.py:
  https://github.com/slac-lcls/lcls2/blob/master/psdaq/psdaq/control/collection.py

The create_msg() function is also imported and used by a command line client, cmd.py:
  https://github.com/slac-lcls/lcls2/blob/master/psdaq/psdaq/control/cmd.py
2019-01-24 Chris O'G - minutes of mtg w Chris F. Expand source
Control-level gui thoughts
O'Grady, Paul Christopher <cpo@slac.stanford.edu>
Thu 1/24, 10:40 AMDubrovin, Mikhail;Ford, Christopher

code is in psdaq/psdaq/control
interface is in collection.py
can run one (or more) dtiproxy in a standalone mode for gui development (caf will send an example)
requirements:
- asynchronous processes to watch for the completion of the transitions
- error display
- copy the lcls1 daq gui as closely as we can
- receive messages directly from many drp nodes using a zmq many-to-one pattern
- longer term, if we follow lcls1 model, this gui would also be used to managing detector configurations
2019-01-24 Chris F - CLI for showPlatform Expand source
preview: 'daqstate' CLI for DAQ

Ford, Christopher <caf@slac.stanford.edu>

Thu 1/24, 12:06 PMO'Grady, Paul Christopher;Weninger, Clemens;Dubrovin, Mikhail
The brief demo below shows
three LCLS-II DAQ transitions (plat/alloc/connect) being automated by
the new 'daqstate' CLI. Two instances of dti_proxy were running at the
time, as shown by 'showPlatform.'
I intend to commit 'daqstate' to git this afternoon. Then, I will add an updated demo to Confluence.
Thanks,
  -caf

(ps-0.1.2) -bash-4.2$ daqstate -p1
reset

(ps-0.1.2) -bash-4.2$ showPlatform -p1
Platform | Partition      |    Node
         | id/name        | level/pid/host
---------+----------------+------------------------------------
    1      1/(None)

(ps-0.1.2) -bash-4.2$ daqstate -p1 --state connected
connected

(ps-0.1.2) -bash-4.2$ showPlatform -p1
Platform | Partition      |    Node
         | id/name        | level/pid/host
---------+----------------+------------------------------------
    1      1/(None)         drp-no-teb/19944/psbuild-rhel7-01
                            drp-no-teb/19916/psbuild-rhel7-01
(ps-0.1.2) -bash-4.2$ daqstate -p1
connected
(ps-0.1.2) -bash-4.2$
2019-01-24 Matt W - run LCLS control GUI Expand source
Weaver, Matt <weaver@slac.stanford.edu>
Thu 1/24, 12:22 PMO'Grady, Paul Christopher;Dubrovin, Mikhail;Ford, Christopher

You can execute the DAQ on drp-tst-dev011 by running

cd /reg/g/pcds/dist/pds/tst/scripts
../../tools/procmgr/procmgr start testgui.cnf
../../tools/procmgr/procmgr stop testgui.cnf  (when you're done)

The IP address of
drp-tst-dev011 appears in testgui.cnf.  You can replace it with some
other node.  Don't try to run fast, because the event data is getting
broadcasted on the cds-tst network (since we don't have
a FEZ or multicast filtering).
-Matt
2019-02-02 Chris F - How to run your own state machine Expand source
How to run your own state machine
Ford, Christopher <caf@slac.stanford.edu>
Fri 2/1, 4:54 PMDubrovin, Mikhail

Hi Mikhail,
Here is a test procedure to get you going:

1. Open two terminals on the same host (e.g. drp-tst-acc06)
2. In both terminals, "source setup_env.sh" in your fullly built git repository.
3. In one terminal, start a state machine by running "collection -p6 -v".
4. In the other terminal, set a state by running "daqstate -p6 --state connected" (for example).

I reserved platform 6 for your use.  Please include the "-p6" flag when running DAQ programs that accept a platform flag.
I've put a daqstate demo including screen shots on Confluence: https://confluence.slac.stanford.edu/display/~caf/daqstate+Demo
As we discussed this morning, your GUI should be able to set and get the
state using the DaqControl interface like daqstate does.
Thanks, -caf
2019-02-06 Chris F - monitorStatus Expand source
Ford, Christopher <caf@slac.stanford.edu>
2019-02-06, 3:37 PMO'Grady, Paul Christopher;Weninger, Clemens;Dubrovin, Mikhail

Earlier today I pushed incremental improvements to collection.py and daqcontrol.py.
Now daqcontrol supports monitoring of events  via a simple blocking interface.
I think the implementation of the daqstate command, below, is really quite succinct.
Thanks,-caf

---------------------------------------------------------

    # instantiate DaqControl object
    control = DaqControl(host=args.C, platform=args.p, timeout=args.t)

    if args.state:
        # change the state
        rv = control.setState(args.state)
        if rv is not None:
            print('Error: %s' % rv)

    elif args.transition:
        # transition request
        rv = control.setTransition(args.transition)
        if rv is not None:
            print('Error: %s' % rv)

    elif args.monitor:
        # monitor the status
        while True:
            transition, state = control.monitorStatus()
            if transition is None:
                break
            print('transition: %-10s  state: %s' % (transition, state))

    if not args.monitor:
        # print current state
        print(control.getState())

===================

Ford, Christopher <caf@slac.stanford.edu>
2019-02-06, 3:19 PMDubrovin, Mikhail

Open three terminals on drp-tst-acc06, then proceed with instructions below.

Terminal #1: Start as before
  $ collection -p6

Terminal #2: Run daqstate with new "--monitor" flag
  $ daqstate -p6 --monitor

Terminal #3:  Run these commands
  $ daqstate -p6 --state connected
  connected
  $ daqstate -p6 --state paused
  paused
  $ daqstate -p6 --state running
  running

You should see the following output on terminal #2:
  transition: plat        state: unallocated
  transition: alloc       state: allocated
  transition: connect     state: connected
  transition: configure   state: paused
  transition: enable      state: running

Thanks, -caf
2019-02-07 Chris F - zmq uri Expand source
I just recently created a new branch, collection_front, for this development activity.
I think my branch missed your example code. Would you commit it to the new branch please?

> To merge it with real gui I need to get somehow the port name for zmq socket connection
> and "topic" of messages for filtering.
> Is there any method which returns this info for monitoring process?

We don't use zmq filtering.  In our current python code call: setsockopt(zmq.SUBSCRIBE, b'')
We do have a method for finding the zmq port number.  It is a function of the platform number.

In the collection_front branch it looks like this:
    from psdaq.control.collection import front_pub_port
    port = front_pub_port(platform) # getting the zmq port name


Ford, Christopher <caf@slac.stanford.edu>
2019-02-07, 6:04 PMDubrovin, Mikhail

Hi Mikhail,
> To merge it with real gui I need to get somehow the port name for zmq socket connection
> and "topic" of messages for filtering.

For reference, please see how the socket is initialized in the DacControl constructor, here:

  https://github.com/slac-lcls/lcls2/blob/collection_front/psdaq/psdaq/control/collection.py

    def __init__(self, *, host, platform, timeout):
        self.host = host
        self.platform = platform
        self.timeout = timeout
        # initialize zmq socket
        self.context = zmq.Context(1)
        self.front_sub = self.context.socket(zmq.SUB)
        self.front_sub.connect('tcp://%s:%d' % (host, front_pub_port(platform)))
        self.front_sub.setsockopt(zmq.SUBSCRIBE, b'')

Remember to use the collection_front branch!
Thanks, -caf
2019-02-28 Chris F - zmq error message parser Expand source
Ford, Christopher <caf@slac.stanford.edu>
Thu 2019-02-28, 4:59 PM

msg['body']['error']

See liine 21 for example decoding:
https://github.com/slac-lcls/lcls2/blob/collection_front/psdaq/psdaq/control/daqstate.py
2019-03-07 Chris F - example getPlatform() reply Expand source
Ford, Christopher
2019-03-07, 1:59 Dubrovin, Mikhail

Hi Mikhail,
Yesterday I added a new 'active' field to the JSON object returned by getPlatform().  It can be 0 or 1.
In control_gui, the table displayed by the Partition / Display
button should only include entries for which body[level][id]['active']
== 1.
In other words, the entries with active==0 should be hidden for that button.
See below for an example getPlatform() reply.

getPlatform() reply:

{'drp': {'10924343274495976064': {'active': 1,
                                  'proc_info': {'host': 'drp-tst-dev008',
                                                'pid': 280697}}},
'drp-no-teb': {'-5055484696195183223': {'active': 1,
                                         'proc_info': {'host': 'daq-tst-dev02',
                                                       'pid': 18384}}},
'teb': {'8929931608234960614': {'active': 1,
                                 'proc_info': {'host': 'drp-tst-dev001',
                                               'pid': 279130}}}}
2019-03-08 Chris F - procmgr Expand source
======= Commonly used procmgr commands =========
Start:
  procmgr start psdaq/psdaq/cnf/lab3-dubrovin-test.cnf

Restart (stop then start):
   procmgr restart psdaq/psdaq/cnf/lab3-dubrovin-test.cnf

Status:
  procmgr status psdaq/psdaq/cnf/lab3-dubrovin-test.cnf
2019-03-11 Chris F - selectPlatform Expand source
2019-03-11 1:39 PM

Hi Mikhail,
I just checked in (to the lcls2 master branch) a new selectPlatform()
interface for updating the 'active' field.
See below for a demonstration of the interface using the CLI.
Thanks,
-caf
(ps-2.0.0) -bash-4.2$ selectPlatform -p6 -h
usage: selectPlatform [-h] [-p {0,1,2,3,4,5,6,7}] [-C COLLECT_HOST]
                      [-t TIMEOUT] [-s LEVEL/PID/HOST] [-u LEVEL/PID/HOST]
optional arguments:
  -h, --help            show this help message and exit
  -p {0,1,2,3,4,5,6,7}  platform (default 0)
  -C COLLECT_HOST       collection host
  -t TIMEOUT            timeout msec (default 2000)
  -s LEVEL/PID/HOST     select (may be repeated)
  -u LEVEL/PID/HOST     unselect (may be repeated)
(ps-2.0.0) -bash-4.2$
(ps-2.0.0) -bash-4.2$ showPlatform -p6
Platform | Partition      |    Node
         | id/name        | level/pid/host (* = active)
---------+----------------+------------------------------------
    6      6/(None)         drp-no-teb/27023/daq-tst-dev02 *
                            teb/379729/drp-tst-dev001 *
                            drp/385531/drp-tst-dev008 *
(ps-2.0.0) -bash-4.2$
(ps-2.0.0) -bash-4.2$ selectPlatform -p6 -u teb/379729/drp-tst-dev001
(ps-2.0.0) -bash-4.2$
(ps-2.0.0) -bash-4.2$ showPlatform -p6
Platform | Partition      |    Node
         | id/name        | level/pid/host (* = active)
---------+----------------+------------------------------------
    6      6/(None)         drp-no-teb/27023/daq-tst-dev02 *
                            teb/379729/drp-tst-dev001
                            drp/385531/drp-tst-dev008 *
(ps-2.0.0) -bash-4.2$
(ps-2.0.0) -bash-4.2$ selectPlatform -p6 -u drp-no-teb/27023/daq-tst-dev02
(ps-2.0.0) -bash-4.2$
(ps-2.0.0) -bash-4.2$ showPlatform -p6
Platform | Partition      |    Node
         | id/name        | level/pid/host (* = active)
---------+----------------+------------------------------------
    6      6/(None)         drp-no-teb/27023/daq-tst-dev02
                            teb/379729/drp-tst-dev001
                            drp/385531/drp-tst-dev008 *
(ps-2.0.0) -bash-4.2$
(ps-2.0.0) -bash-4.2$ selectPlatform -p6 -s
drp-no-teb/27023/daq-tst-dev02 -s teb/379729/drp-tst-dev001
(ps-2.0.0) -bash-4.2$
(ps-2.0.0) -bash-4.2$ showPlatform -p6
Platform | Partition      |    Node
         | id/name        | level/pid/host (* = active)
---------+----------------+------------------------------------
    6      6/(None)         drp-no-teb/27023/daq-tst-dev02 *
                            teb/379729/drp-tst-dev001 *
                            drp/385531/drp-tst-dev008 *
(ps-2.0.0) -bash-4.2$

======================================================
2019-03-11 4:30 PM
Hi Mikhail,
I recently checked in a refinement to selectPlatform() that limits it to
the UNALLOCATED state.
CLI testing is shown below.
At first, selectPlatform returns an error because the system is in
CONNECTED state.
After changing to UNALLOCATED state, selectPlatform succeeds.
What this means for control_gui...
In the "Partition Selection" GUI, the checkboxes and "Apply" button
should only be active while in the UNALLOCATED state.
Thanks,
 -caf

(ps-2.0.0) -bash-4.2$ showPlatform -p1
Platform | Partition      |    Node
         | id/name        | level/pid/host (* = active)
---------+----------------+------------------------------------
    1      1/(None)         drp/388851/drp-tst-dev008 *
                            teb/382746/drp-tst-dev001 *
                            drp-no-teb/4524/daq-tst-dev02 *
(ps-2.0.0) -bash-4.2$
(ps-2.0.0) -bash-4.2$ selectPlatform -p1 -u teb/382746/drp-tst-dev001
Error: selectPlatform only permitted in unallocated state
(ps-2.0.0) -bash-4.2$
(ps-2.0.0) -bash-4.2$ daqstate -p1
last transition: connect  state: connected
(ps-2.0.0) -bash-4.2$
(ps-2.0.0) -bash-4.2$ daqstate -p1 --state unallocated
(ps-2.0.0) -bash-4.2$
(ps-2.0.0) -bash-4.2$ daqstate -p1
last transition: dealloc  state: unallocated
(ps-2.0.0) -bash-4.2$
(ps-2.0.0) -bash-4.2$ selectPlatform -p1 -u teb/382746/drp-tst-dev001
(ps-2.0.0) -bash-4.2$
(ps-2.0.0) -bash-4.2$ showPlatform -p1
Platform | Partition      |    Node
         | id/name        | level/pid/host (* = active)
---------+----------------+------------------------------------
    1      1/(None)         drp/388851/drp-tst-dev008 *
                            teb/382746/drp-tst-dev001
                            drp-no-teb/4524/daq-tst-dev02 *
(ps-2.0.0) -bash-4.2$

=================================================================
2019-03-12 9:49 AM
Hi Mikhail,
The CLI equivalent of updating checkboxes to select nodes is
selectPlatform.py.

Three steps to read/modify/write:
  1) body = control.getPlatform()
  2) Modify 'active' values (0 or 1) in body dictionary.
  3) control.selectPlatform(body)
https://github.com/slac-lcls/lcls2/blob/master/psdaq/psdaq/control/selectPlatform.py
2019-03-13 Chris F - on button activity Expand source
Ford, Christopher <caf@slac.stanford.edu>
Re: selectPlatform.py CLI example
2019-03-13, 2:31 PM

Here is my initial feedback:
 - Select button should be active only when state is UNALLOCATED.
 - If Select->Apply is successful, an Allocate transition should be
triggered.
 - Display button should be active only when state is ALLOCATED or greater.
 - If user skips the Select button, Display button's list should default
to full, not empty.
   ...in other words, everything is selected by default.  That's why
active=1 initially.


2019-03-13, 2:38 PM
Hi Mikhail, Earlier I wrote: - Select button should be active only when
state is UNALLOCATED. My mistake! In state ALLOCATED and greater, just
the Select button's checkboxes and Commit should be inactive. In other
words, the user should be able to view but not modify the selection in those states.
2019-03-21 Mike B - configdb methods Expand source
2019-03-21, 12:25 PM
Browne, Michael C.
configDB methods

So, I've changed the methods in configdb.py and added a few entries to
the configuration database.  Currently, there are hutches 'TMO' and
'CXI'.  'TMO' has aliases 'BEAM' and 'NOBEAM', each of which has a
configuration for the device 'testdev0'.  This has a single device
configuration, which is an instance of 'test'.  'CXI' also has 'BEAM'
and 'NOBEAM' aliases, but these are both empty.

Access the configuration database using:
    import psana.dgramPort.configdb as cdb
    c = cdb.cdb("mcbrowne:psana@psdb-dev:9306", default_hutch)
    There is a security implication here, of course.  But this will do
    for now.

Find the hutches in the database:
    list_of_hutch_names = c.get_hutches()

Find the aliases in a hutch:
    list_of_alias_names =
    c.get_aliases(hutch=name_or_None_for_default_hutch)

Find the device configurations available for all hutches:
    list_of_device_configuration_names = c.get_device_configs()

Find the devices in an alias in a hutch:
    list_of_device_names = c.get_devices(key_or_alias,
    hutch=name_or_None_for_default_hutch)

Retrieve a configuration for a device:
    config = c.get_configuration(key_or_alias, devicename,
    hutch=name_or_None_for_default_hutch)
    The config is a dictionary: keys are device configuration names, and
    values are typed JSON dictionaries.

Modify a configuration for a device:
    new_key = c.modify_device(alias, devicename, config,
    hutch=name_or_None_for_default_hutch)
    The config is a dictionary in the form retrieved from
    get_configuration, *not* a typed JSON dictionary!  If successful,
    this returns an integer key that can be used to refer to the new
    configuration of the alias.  On failure, this routine raises an
    exception.

As ever, let me know if there are any issues.
    --Mike
2019-03-26 Chris F - get instrument Expand source
3:21 PM
    # instantiate DaqControl object
    control = DaqControl(host=args.C, platform=args.p, timeout=args.t)
    # get instrument/hutch name
    instrument = None
    try:
        instrument = control.getInstrument()
    except Exception as ex:
        print('getInstrument() Exception: %s' % ex)

======================================================================

4:36 PM
Hide original message
Add '-P <instrument>' flag to the 'collection' entry in your cnf file:
    diff --git a/psdaq/psdaq/cnf/lab3-dubrovin-test.cnf
    b/psdaq/psdaq/cnf/lab3-dubrovin-test.cnf
    index 1da8848..c2d2970 100644
    --- a/psdaq/psdaq/cnf/lab3-dubrovin-test.cnf
    +++ b/psdaq/psdaq/cnf/lab3-dubrovin-test.cnf
    @@ -25,7 +25,7 @@ collect_host = 'drp-tst-acc06'

     procmgr_config = [
      {                        id:'procstat', flags:'p',
    conda:conda_rel, cmd:'procstat -t '+username+' -e0 -n none
    p'+platform+'.cnf.last'},
    *- { host: collect_host,    id:'collection', flags:'sxp',
    conda:conda_rel, cmd:'collection -v'},
    **+ { host: collect_host,    id:'collection', flags:'sxp',
    conda:conda_rel, cmd:'collection -v -P TME'},*
     #{ host: 'daq-tst-dev02', id:'ts_proxy', flags:'sxp',
    conda:conda_rel, env:epics_env, cmd:'ts_proxy -v -C '+collect_host+'
    DAQ:LAB2:PART:'+platform},
      {                        flags:'xp', id:'control_gui',
    conda:conda_rel, cmd:'control_gui -H '+collect_host},
     # test clients
After restarting DAQ, you should see:
    (ps-2.0.0) -bash-4.2$ showPlatform -p6
    Partition|         Node
    id/name  | alias            level/pid/host (* = active)
    ---------+-----------------------------------------------------
    6/TME      testClient2a     test/23912/daq-tst-dev02 *
               testClient2b     test/23929/daq-tst-dev02 *
    (ps-2.0.0) -bash-4.2$
2019-10-11 Chris F - DaqControl interface updated to support 'record' flag Expand source
Ford, Christopher <caf@slac.stanford.edu>
Fri 10/11/2019 1:10 PM

New interface:
    #
    # DaqControl.setRecord - set record flag
    #   True or False
    #
    def setRecord(self, recordIn):

 Two updated interfaces -- added a 4th value, the record flag:
    #
    # DaqControl.getStatus - get status
    #
    def getStatus(self):
    #
    # DaqControl.monitorStatus - monitor the status
    #
    def monitorStatus(self):
2019-10-11 Chris F - request for Stop button in Users' tab Expand source
Ford, Christopher <caf@slac.stanford.edu>
Fri 10/11/2019 2:53 PM

Placement is on user mode tab, between play/pause and record buttons.
Appearance is a square.   See also: https://en.wikipedia.org/wiki/Media_control_symbols


Tooltip is "Stop running"
Visibility is true if and only if the current state is in { 'starting', 'paused', 'running' }

Action is to set  the 'configured' state.
Example code for setting the 'configured' state:

       cmd = 'configured'
       if daq_ctrl is not None :
            daq_ctrl.setState(cmd)
            logger.debug('daq_control.setState("%s")' % cmd)
        else :
            logger.warning('daq_control() is None')
2019-10-15 Chris F - Record button active states Expand source
Ford, Christopher <caf@slac.stanford.edu>
Tue 10/15/2019 5:01 PM


Hi Mikhail,

> In what states Record button should be active?

{reset,unallocated,allocated,connected,configured}
Thanks,
-caf
2019-10-30 Chris F - manually stop process Expand source
> ERR: found b'procstat', expected 'partca-6' on host localhost port 29602

This indicates that a previous procmgr session was not fully stopped before a new one started, leaving a port in use.

Manually, one can stop the process in 2 steps:
1. telnet localhost 29602
2. ctrl-x
2020-02-12 Chris F - in-progress messages Expand source
Ford, Christopher <caf@slac.stanford.edu>
Tue 2/11/2020 6:32 PM

Hi Mikhail,
Today control_gui acts on file reports and error reports using a zmq socket.
On the same socket I propose adding a new "progress report" message with
 3 fields: transition, elapsed seconds, and total seconds.
Note that receiving a error report should clear the progress report window.
See below for an example sequence of 30 progress reports followed by an error report.
There is no guarantee that updates will arrive at 1 Hz.
Only certain slow transitions will generate progress reports.
What do you think?  Is this enough information for control_gui to generate an in-progress indication?
Thanks,
 -caf

2020-02-11 17:58:21,111 tst-control[255932]: <D> progressReport: rollcall 1/30
2020-02-11 17:58:22,113 tst-control[255932]: <D> progressReport: rollcall 2/30
...
2020-02-11 17:58:49,157 tst-control[255932]: <D> progressReport: rollcall 29/30
2020-02-11 17:58:50,159 tst-control[255932]: <D> progressReport: rollcall 30/30
2020-02-11 17:58:50,159 tst-control[255932]: <E> drp/cam_1 did not respond to rollcall
===========
Hi Mikhail,
Earlier today I pushed support for in-progress messages.
Initially, only the "rollcall" transition is updated.  Later I will add "configure".
These new messages share the same zmq socket as asynchronous error reports.
See below for an example "progress" message.
Any questions?  Please let me know.
Thanks,
 -caf

{
    "body": {
        "elapsed": 1,
        "total": 30,
        "transition": "rollcall"
    },
    "header": {
        "key": "progress",
        "msg_id": "0950388569-845203000",
        "sender_id": null
    }
}
2020-02-25 Ric - add space-separator in error log Expand source
Claus, Ric
Tue 2/25/2020 1:15 PM
Hi Mikhail,
  I thought about it some more and perhaps it would be best to scroll
the error panel by one window height when the state machine moves from
the Reset state to the next state.  That way, the error window would
appear to be blank at the start of a run cycle,
although the previous information could be retrieved by scrolling or
resizing the GUI.  I think we might have left the impression at the
meeting to clear it when the Reset state is entered, which seems like
not the best thing because it would erase error messages
that occurred in the process of resetting.  Does that make sense to you?

  Thanks for thinking about it!
  Ric
2020-02-27 Chris F - comments on progress bar and error update Expand source
Hi Mikhail,
Making good progress!
I have 3 comments/requests:
1. Progress bar appears in Expert tab only. Is that what Chris O'Grady requires?
2. Progress bar is unlabeled. It is important to show *which* transition is in progress
3. Error message should clear hourglass cursor in addition to progress bar.
Thanks,
 -caf
2020-10-22 RIc, Chris(both) - exteriment, run, non-expert UI Expand source
Claus, Ric <claus@slac.stanford.edu>
Thu 10/22/2020 6:07 PM
Hi all,

  After watching a couple people struggling to remember that they need to select ‘configure' to end a run using control_gui in the last couple of days, I thought perhaps it would be good to bring back the control_gui user panel.  IMO, users shouldn’t have to know how our control state machine is put together in order to interact with the DAQ.  The user panel should be intuitive, so the idea is that it would have just a few buttons:

- Select: This remains the same, Roll-call and "modal” window.
- Configure: This causes transitions from the current state to Configured through Configure.  This is for when the user has edited the configDb with the sub-panel at the top of the GUI and now wants to run with this new information.
- Start/Stop (toggles): This causes transitions from the current state to Running.  If starting from Running, it traverses to Configured.
- Recording On/Off (toggles): Toggles the recording flag.  If the current state is Running, the state machine is traversed to Configured and back to Running to open or close the files.
- Reset: This brings about a clean slate.  If there are any errors that prevent transitions from going through, it acts like selecting Reset currently does.  Else it traverses the state machine to Deallocated.

The current configuration editor portion would stay the same.
As always, the progress bar should appear when necessary.

In addition, there should be some information on the panel:
- The Run number is displayed
- Number of events since Start is displayed
- Number of Damaged events (and/or Damage rate) since Start is displayed
These last two would probably get their data from prometheus.

Because first impressions are so important, I would argue we do this, or something similar, sooner rather than later.  We want the users to go home feeling like they didn’t have to struggle or be slowed down by our stuff.

  Ric

====
O'Grady, Paul Christopher <cpo@slac.stanford.edu>
Thu 10/22/2020 6:11 PM
> Hi Chris and Mikhail,
>
> Stefan (leading the FEE commissioning effort) requested that we add a print statement in control_gui with the run number when we begin/end a run.  This would happen only when we are recording (where the run number makes sense).   Something like:
>
> Begin recording run 25
> End recording run 25
>
> Would that be possible?  Thanks!
>
> chris

====

Ford, Christopher <caf@slac.stanford.edu>
Thu 10/22/2020 6:37 PM
Hi Chris, Ric, Mikhail,

Both the run number (which people are asking for today) and the experiment name (which I suspect people will be asking for soon) are included in status messages today.

I believe control_gui is already subscribing to these status messages, so the next step is extracting more details from the existing messages.

        [excerpt from control.py]

        body = {'state': self.state, 'transition': self.lastTransition,
                'platform': self.cmstate_levels(),
                'config_alias': str(self.config_alias), 'recording': self.recording, 'bypass_activedet': self.bypass_activedet,
                'experiment_name': expname, 'run_number': self.run_number, 'last_run_number': self.last_run_number}

Thanks,
 -caf

====

Dubrovin, Mikhail
Thu 10/22/2020 8:52 PM
Chris,
What is the best place to show run and experiment info in the control_gui window?
It could be a message in the logger window or they may have a static fields.
Mikhail

====

Ford, Christopher <caf@slac.stanford.edu>
Thu 10/22/2020 9:18 PM
(added Ric, to join two similar email threads)

Hi Mikhail,

In LCLS-I this information appeared in the control_gui logger window.
However, in LCLS-I the procstat window showed a list of open data files, from which one could deduce the current run number and experiment name.

Unless the list of open data files is displayed somewhere for the user, I would favor having the run number and experiment name displayed in a static location (where they won't scroll away).

What do other folks think?

Thanks,
 -caf

====

Claus, Ric <claus@slac.stanford.edu>
Thu 10/22/2020 9:46 PM
Right.  That was my thinking.  As I tried to indicate in my other message, it would be good to reserve some room for event and damage counters, too, if people agree.  If I understood Stefan Moeller correctly last night, he wants to see the number of recorded events.

  Ric
> On Oct 22, 2020, at 9:18 PM, Ford, Christopher <caf@slac.stanford.edu> wrote:
>
> I would favor having the run number and experiment name displayed in a static location (where they won't scroll away)

===

Ford, Christopher <caf@slac.stanford.edu>
Tue 10/27/2020 11:04 AM
Hi Mikhail,
Exp is not updated until BeginRun.
Run # is not updated until BeginRun+Recording.
Thanks,
 -caf
2020-10-28 Chris F. - earlier experiment name and (last) run number info Expand source
Ford, Christopher
Wed 10/28/2020 4:36 PM
Hi Mikhail, Chris,

About an hour ago I pushed a change to control.py that initializes experiment_name and last_run_number early on instead of waiting for the BeginRun transition.

Below, I propose pseusdocode for displaying either "run_number" or "last_run_number" based on  the current state.

What do you think?

Thanks,
 -caf

----------------------------------------------------------------
if RecordingFlag == True and State in {STARTING, PAUSED, RUNNING}:
    control_gui reports "current run: {run_number}"
else:
    control_gui reports "latest run: {last_run_number]"
----------------------------------------------------------------
2023-08-07 Ric - setup for daq in fee Expand source
2023-08-07 10:30am
Claus, Ric <claus@slac.stanford.edu>
Dubrovin, Mikhail
Hi Mikhail,

  It looks like you should be able to set up to work in the FEE quite easily.  Please make a copy of psdaq/psdaq/cnf/fee_teststand.cnf and change the first line to select platform 4:

if not platform: platform = ‘4’

You probably won’t need AMI, so you can comment out the last line.
To avoid conflicting with someone else, change ‘drp_cmd1’ on line 68 to ‘drp_cmd0’.
Then, ssh -YC to drp-neh-ctl002, run setup_env.sh and try ‘procmgr start fee_dubrovin.cnf’ (or whatever you’ve called it) from wherever you’ve placed the copy.  This should bring up the GUIs and let you work with Control_Gui.
  I hope I didn’t forget anything!  Please let me know how it goes.
  Btw, if you think you need to change the configDb for timing_0, please let me know.  We probably don’t want to change that entry to avoid messing up Valerio or Riccardo.  Instead, we should make a copy of it and modify that, I think.
Ric

Sorry, one other thought, Mikhail.  Perhaps you should use the development configDb.  Change line 12 to:
cdb  = 'https://pswww.slac.stanford.edu/ws-auth/devconfigdb/ws’
Ric
Set up and running
Build
ssh -Y pslogin
ssh -Y psbuild
cd <path>/lcls2
git branch -a
git checkout collection_front
source setup_env.sh
build_all.sh
Setup on 2023-08-07
psana
ssh -YC to drp-neh-ctl002
psdaq/psdaq/cnf/fee_teststand.cnf > fee_dubrovin.cnf

in fee_dubrovin.cnf
if not platform: platform = ‘4’

# line 12 to:
cdb  = 'https://pswww.slac.stanford.edu/ws-auth/devconfigdb/ws’

You probably won’t need AMI, so you can comment out the last line.
To avoid conflicting with someone else, change ‘drp_cmd1’ on line 68 to ‘drp_cmd0’.

procmgr start fee_dubrovin.cnf -p4
Run control processes
ssh -Y psdev.slac.stanford.edu
ssh -Y daq-tst-dev02
cd <path>/lcls2
source setup_env.sh

Terminal #1: Start as before
  $ collection -p6

Terminal #2: Run daqstate with new "--monitor" flag
  $ daqstate -p6 --monitor

Terminal #3:  Run these commands
  $ daqstate -p6 --state connected
  connected
  $ daqstate -p6 --state paused
  paused
  $ daqstate -p6 --state running
  running
Branch and conda release
git branch -a
git checkout collection_front

source setup_env.sh
conda env list
conda activate ps-0.1.2
Run procmgr
ssh -Y daq-tst-dev02
cd <path>/lcls2
. setup_env.sh
procmgr start psdaq/psdaq/cnf/lab3-dubrovin-cam.cnf -p6

TEMPORARY:
procmgr restart psdaq/psdaq/cnf/lab3-caf-cam.cnf -p1

showPlatform -p1 -C drp-tst-dev009
daqstate -p1 -P tst -C drp-tst-dev009 --bypass 1
daqstate -p1 -P tst -C drp-tst-dev009 --transition rollcall
showPlatform -p1 -C drp-tst-dev009


# collection hist can be found in psdaq/psdaq/cnf/lab3-dubrovin-cam.cnf
# in line like: collect_host = 'drp-tst-acc06
Enabled buttons for state - new approach from Chris F
| Config Type | Config Edit | Partition Select | Partition Show | Recording | Target State | |
|---|---|---|---|---|---|---|
| RESET | * | * | * | * | ||
| UNALLOCATED | * | * | * | * | ||
| ALLOCATED | * | * | * | * | * | |
| CONNECTED | * | * | * | * | * | |
| CONFIGURED | * | * | * | * | ||
| STARTING | * | * | * | |||
| PAUSED | * | * | * | |||
| RUNNING | * | * | * |
where [*] marks active items.
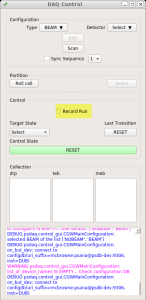
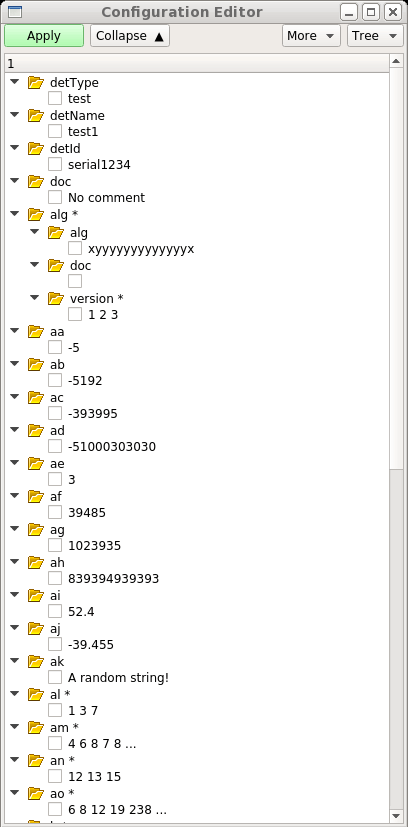
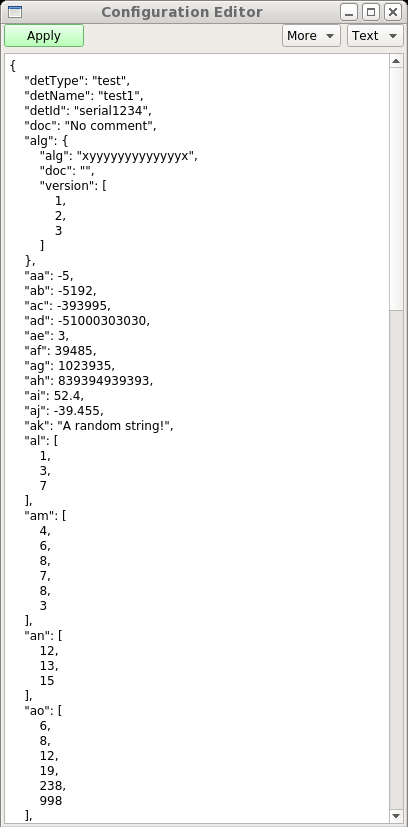
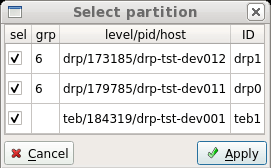
Implementation of GUI
Replica of LCLS1+
Main control GUI, configuration editor in "tree" and "text" modes, and partition selection pop-up window
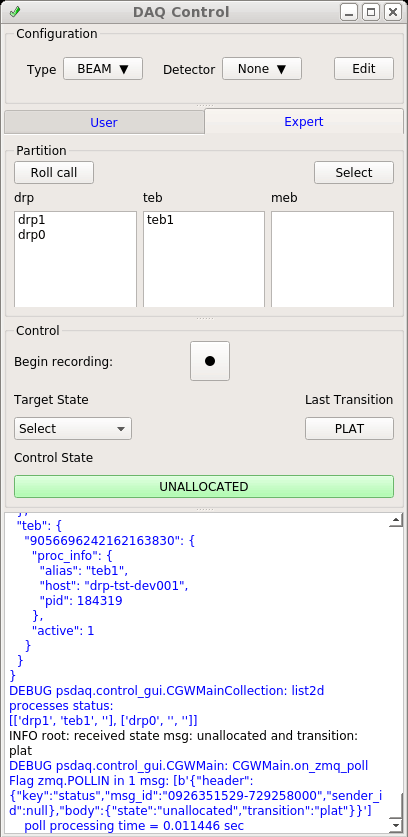
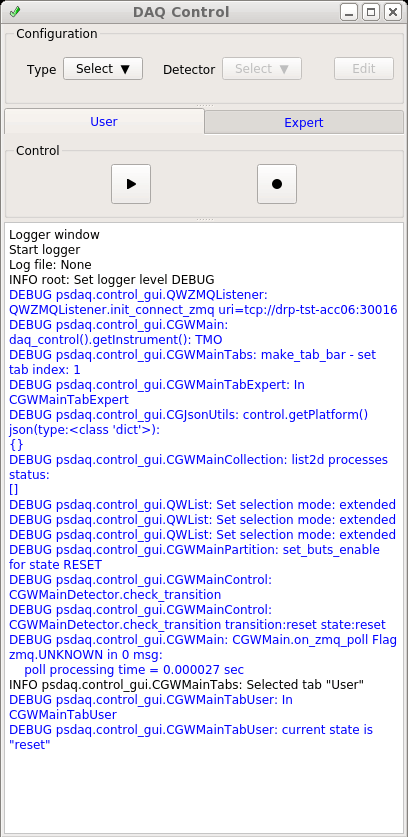
Version for LCLS2
Expert and User views
References
See create_msg() and its context in collection.py: https://github.com/slac-lcls/lcls2/blob/master/psdaq/psdaq/control/collection.py
The create_msg() function is also imported and used by a command line client, cmd.py: https://github.com/slac-lcls/lcls2/blob/master/psdaq/psdaq/control/cmd.py
- LCLS-I DAQ control GUI screenshots: Operating the DAQ - Starting a run
- LCLS-II DAQ: State machine schema
- L2S-I End-to-End Teststand and NEH
- daqstate Demo
- No labels
Overview
Content Tools