Contents:
Editing a configuration
If the DAQ system is not already running, then there should be a "Restart DAQ" icon on the operators console. Open that to start the DAQ system. When you do you will get a number of windows opening. In XPP or XCS, use "restartdaq" from a terminal. "restartdaq -w" will put the windows in predetermined locations on the screens/
Example: Opal camera configuration
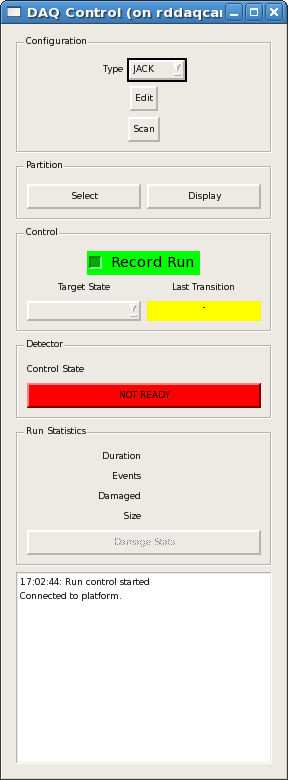
To edit the configuration click the Edit button near the top of the control gui window shown below.
Clicking Edit brings up a new Reconfigure window with two columns labeled Device and Component. Click on an entry in the Device column to display one or more corresponding entries in the Component column. In this example, an OPAL-1000 device named BPS has been selected.
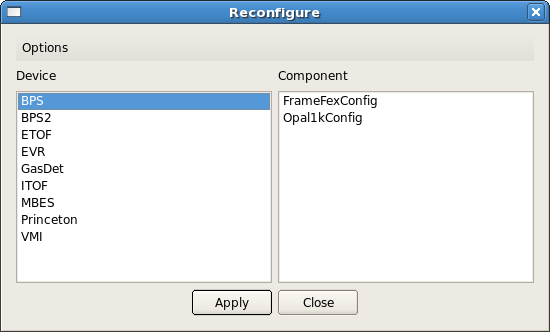
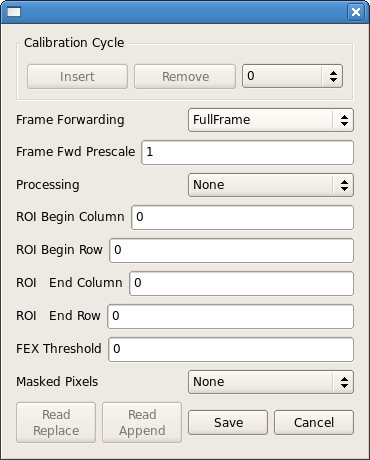
After selecting the device of interest on the left, click on each component on the right to edit it. In this example there are two configurable components. This screen opens to edit FrameFexConfig (feature extraction):
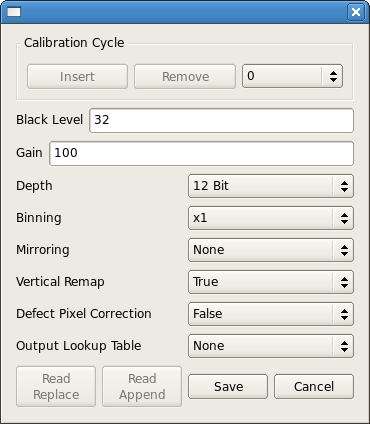
This screen opens to edit Opal1kConfig (OPAL-1000 camera):
Review the current settings and make any changes necessary in the editing windows. Click on the Save button if you wish to close the window and save changes, otherwise click on the Cancel button to close the window without saving. If you saved any changes in the edit windows, click on the Apply button in the Reconfigure window to commit those changes to the DAQ configuration.
Changing a configuration while running
If changes are commited to the DAQ configuration while a DAQ run is in progress, the DAQ system will automatically end the run, unconfigure, configure, then begin a new run. If recording data, the run number will be incremented. The configuration does not vary within a single recorded run.
Configuring the EVR
The EVR (Event Receiver) is responsible for generating readout triggers for the detector. It can be configured to generate trigger pulses of a selected polarity, duration, and delay, and in response to signaled events (eventcodes) from the accelerator timing system like the arrival of beam. The EVR configuration screen, labeled "EVR" is found among the other detector configurations as described above. After clicking "EVR" in the "Reconfigure" window, you will be able to select either "EvrConfig" or "EvrIOConfig" in the "Component" section. 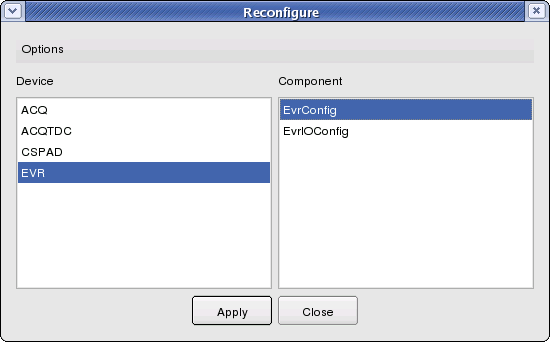
The "EvrIOConfig" panel is not in use anymore, the names for the triggerlines are now set from the <hutch>.cnf. The "EvrConfig" panel allows you to edit the trigger settings. 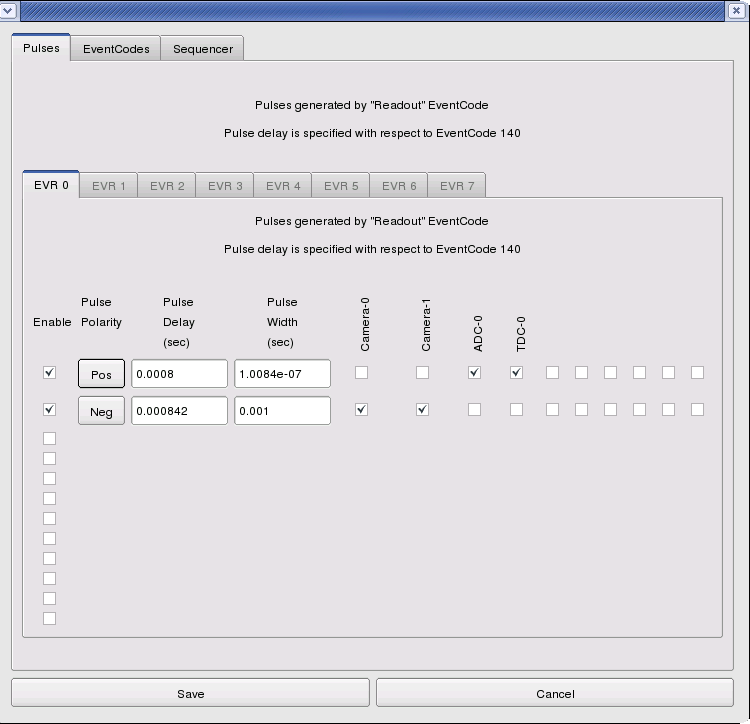
The "EvrConfig" panel has three tabs labeled "Pulses", "EventCodes", and "Sequencer". The Pulses tab allows you to edit the set of trigger pulse parameters along with the set of output lines they drive. Pulse delays and widths are expressed in seconds assuming the global timing system clock runs at exactly 119MHz. The pulse delays are expressed with respect to the timeslot reserved for the arrival of eventcode 140 (the eventcode that signifies the presence of beam). The software will internally modify this number when a readout eventcode other than 140 is selected (see below) in order to maintain the same pulse delay with respect to the timing system fiducial. 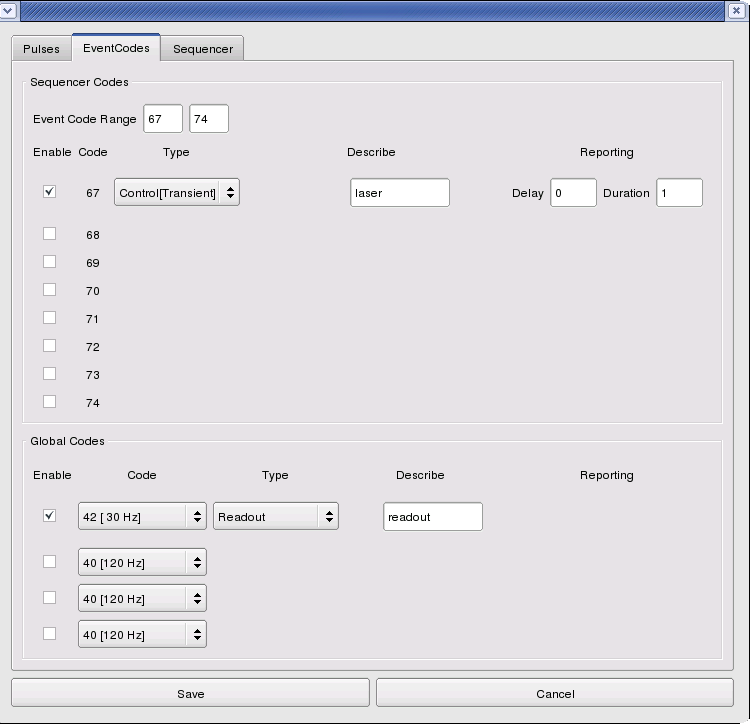
The EventCodes tab is where you can select to record the arrival of various eventcodes and choose the eventcode from which the trigger pulses will be generated. The Sequencer Codes section is now depreacted and cannot be selected anymore. An eventcode can be designated as Readout, Command, Control(Transient), and Control(Latch). An eventcode designated as Readout will generate the trigger pulses on each occurrence. There should be only one eventcode designated as such. An eventcode designated as Command will generate a software event which can be used for software command generated readout (like for a Princeton camera). That software generated event will collected along with the other detectors on the next occurrence of a Readout event. An eventcode designated as Control(Transient) will be recorded in the datastream for each occurrence with the specified delay and duration (in units of readout occurrences). This allows a record to track the occurrence of some event triggered from that eventcode elsewhere, like the pump laser for instance. It is also possible to add a list of event codes to record in the <hutch>.cnf file, removing the need to set commonly used event codes in the EVR config if they are needed for recording only. An eventcode designated as Control(Latch) will be recorded in the datastream on every readout event following its occurrence until the complementary Control(Latch) code is received. For example, a pulse picker state can be recorded by the occurrence of the commands responsible for its "Open" and "Close" operation. For many experiments, only the Readout eventcode needs to be designated.
The Sequencer tab allows the Event Sequencer to be configured in the same panel for convenience. It provides the same function as the EPICS Sequencer configuration described later.
Selecting detectors for readout
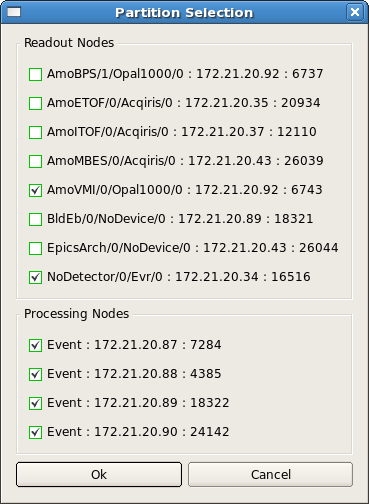
To select detectors for readout click the Select button in the Partition panel of the control gui window shown below.
A new window opens, and initially all detectors used the last time the DAQ was run are selected. If nodes had to be powercycled, the processes running on them are deselected. Sometimes processes will just become unselected, so be sure to check your partition!
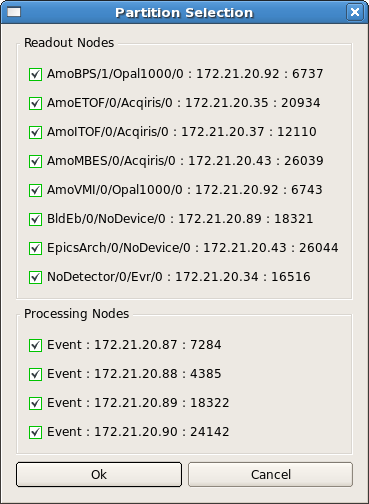
Click on a checkbox to unselect the corresponding readout node. Do not unselect the Nodetector/0/Evr/0 node, as it provides timing for the DAQ system.
Here are some reasons for selecting a subset of readout nodes:
- Remove unused readout nodes to reduce data volume
- Remove an unresponsive readout node to eliminate errors
- Test a readout node in isolation
Please note that for ami to (reliably) work, you need to select all dss nodes that are listed in the <hutch>.cnf file.
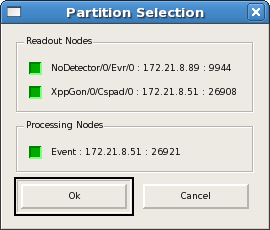
The following example shows the selection of a single camera. Note that the Evr is always required:
Click the OK button to save the selection and close the window, or click the Cancel button to discard changes.
Starting/stopping a run
If the DAQ system is not already running, then there should be a "Restart DAQ" icon on the operators console. Open that to start the DAQ system. When you do you will get a number of windows opening.
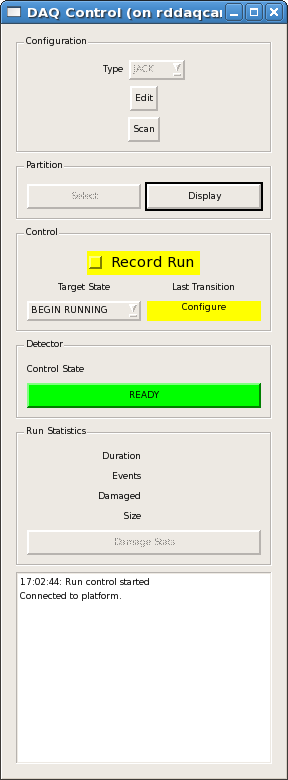
First, examine the control gui window shown below. From the Configuration panel, select the appropriate configuration Type.
Next, you should click on the Partition Select button to choose what devices will be in the system during the run. You will get a window like the one shown below, just click on an item to toggle its state as in or out of the partition during the run.
Once you have clicked "OK" above, you will get a target state offering to allow you to start the run. You can see this below. Just select "BEGIN RUNNING" to start the run.
If you wish to record the run, make sure that the Record Run box in the Control panel is clicked and green (default). If you don't wish to record the run, unselect "Record Run". It will turn yellow to indicate the run will not be recorded.
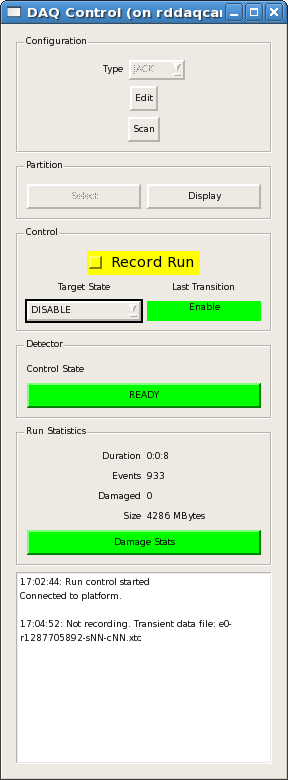
You can stop the run from the control gui window by selecting one of the available Target States from the box in the Control Panel. The states are "disable", "end running" or "shut down".
- Disable will allow you to continue the same run later.
- End Running will end the run so that next time you will get a new run number.
- If you need to reconfigure or are finished, then shut down.
Watching progress of a run
Once the run is going you can watch the progress of it on the control gui window. It will show you the statistics, like the duration of the run and the number of events including the damaged event count. The bottom pane gives the file status, recording or not. Notice that the file names are given even if not recording. Embedded in the file name, you will see the run number.
Other windows will show you the status of the DAQ processes, or allow you to do online monitoring of each device.
Running scans
Most every experiment requires efficient acquisition of data coordinated with changes in the beamline or detector; i.e. a parameter scan. The DAQ system provides two separate interfaces for automating such a scan.
Launching a Scan from DAQ Control GUI
The first interface is part of the DAQ Control GUI, and is found by clicking the "Scan" button in the "Configuration" section of the main GUI window. This opens a dialog which has two tabs : one for scanning an EPICS process variable ("PV") and one for scanning a DAQ trigger delay.
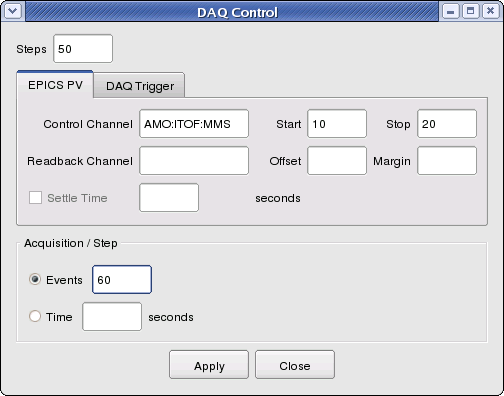
For the EPICS PV scan, the user chooses the number of steps, the name of the PV to control, and the start and stop value of that variable. The scan points will be calculated linearly from the steps, start, and stop values:
- 1 step = 2 scan points {start, stop},
- 2 steps = 3 data points {start, (start+stop)/2, stop},
- 3 steps = 4 data points {start, start*2/3+stop*1/3, start*1/3 + stop*2/3, stop}, and so on.
A readback channel may also be entered if there is a need to separately monitor the precision with which the control variable makes its steps. In this instance, the "offset" specifies any systematic difference of the readback value from the control value, and the "margin" specifies how accurately the readback channel (minus offset) must match the control channel for data acquisition to continue.
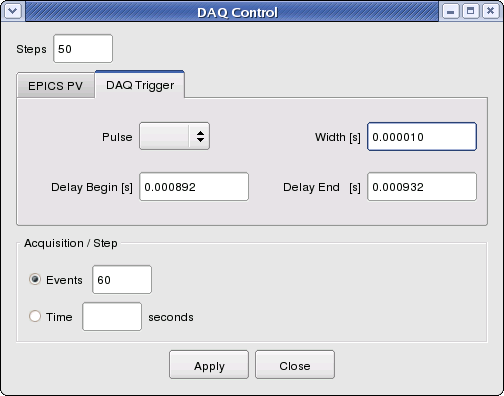
For the DAQ trigger scan, the user provides the number of steps, the pulse number to scan, the width of the pulse (in seconds), and the begin and end delay settings of the pulse (also in seconds). The scan points for the delay values are calculated linearly from the steps, begin, and end values as described above for EPICS PVs.
Finally, the user enters either the number of events to acquire at each step or the amount of time with which to acquire events at each step. Clicking "Apply" will interrupt any current running and start the scan in a new run. The scan will proceed automatically to completion. It may be interrupted manually by choosing "EndRunning" from the "Target State" button. "BeginRunning" will launch another scan as long as the "Scan" button remains highlighted. Close the Scan dialog to disable scans.
Launching Scans Remotely (scripted)
The DAQ system also supports a socket interface to allow scripts or other processes to make acquisition requests of the DAQ. In this way, the script becomes responsible for iterating the scan variable (setting an EPICS PV) and commanding the DAQ to acquire data at each scan point. Thus, non-linear scans or multi-dimensional scans may be implemented as needed by the user.
This is integrated into the <hutch> python environment which most hutches have which is described in more detail elsewhere. We recommend using that over writing your own scripts.
An example Python script for running a scan may look like this:
import socket
import DaqScan
import ConfigDb

if __name__ == "__main__":
#
#  Connect the socket to the appropriate hutch DAQ system
#
    s = socket.socket(socket.AF_INET, socket.SOCK_STREAM)
    s.connect((options.host,options.port))
#
#  Get the current configuration key in use and set the value to be used
#   (assumes we are using the same detector configuration as currently running)
#
    cdb = ConfigDb.Db()
    cdb.recv_path(s)
    key = DaqScan.DAQKey(s)
    key.set(key.value)
#
#  Send the structure the first time to put the control variables
#    in the file header
#
    data = DaqScan.DAQData()
    data.setevents(0)
    data.addcontrol(DaqScan.ControlPV('EXAMPLEPV1',0))
    data.addcontrol(DaqScan.ControlPV('EXAMPLEPV2',0))
    data.addmonitor(DaqScan.MonitorPV('BEAM:LCLS:ELEC:Q',options.qbeam,1.))
    data.send(s)
#
#  Wait for the DAQ to declare 'configured'
#
    result = DaqScan.DAQStatus(s)
    print "Configured."
#
#  Wait for the user to declare 'ready'
#    Setting up monitoring displays for example
#
    ready = raw_input('--Hit Enter when Ready-->')
    for cycle in range(options.cycles):
        data = DaqScan.DAQData()
        data.setevents(options.events)
        data.addcontrol(DaqScan.ControlPV('EXAMPLEPV1',cycle))
        data.addcontrol(DaqScan.ControlPV('EXAMPLEPV2',100-cycle))
        data.addmonitor(DaqScan.MonitorPV('BEAM:LCLS:ELEC:Q',options.qbeam,1.))
        print "Cycle ", cycle
        data.send(s)
        result = DaqScan.DAQStatus(s)  # wait for enabled , then enable the EVR sequence if needed
        result = DaqScan.DAQStatus(s)  # wait for disabled, then disable the EVR sequence if needed
#
#  Wait for the user to declare 'done'
#    Saving monitoring displays for example
#
    ready = raw_input('--Hit Enter when Done-->')
    s.close()
When the socket connects, manual control through the DAQ Control GUI is disabled. The script retrieves detector readout configuration from the DAQ system, creates a new one if needed (advanced), and instructs the DAQ which configuration to use. Then, the script informs the DAQ what are the scan variables to be controlled (for communication to the online monitoring and recorded data), and what EPICS PVs, if any, should be monitored as a condition for taking data (none is common). Then, the script takes responsibility for controlling the scan variables, and informs the DAQ of the scan variable settings at each step and the number of events to acquire. The DAQStatus method is called to enable the DAQ to acquire data. A second call to DAQStatus then waits for the DAQ to complete the acquisition for that step. When the socket is closed, manual control through the DAQ Control GUI resumes.
Running the sequencer
The event sequencer window can be launched from the main epics window for each experiment. The following images show the location of event sequencer menus in difference epics windows:
- AMO:
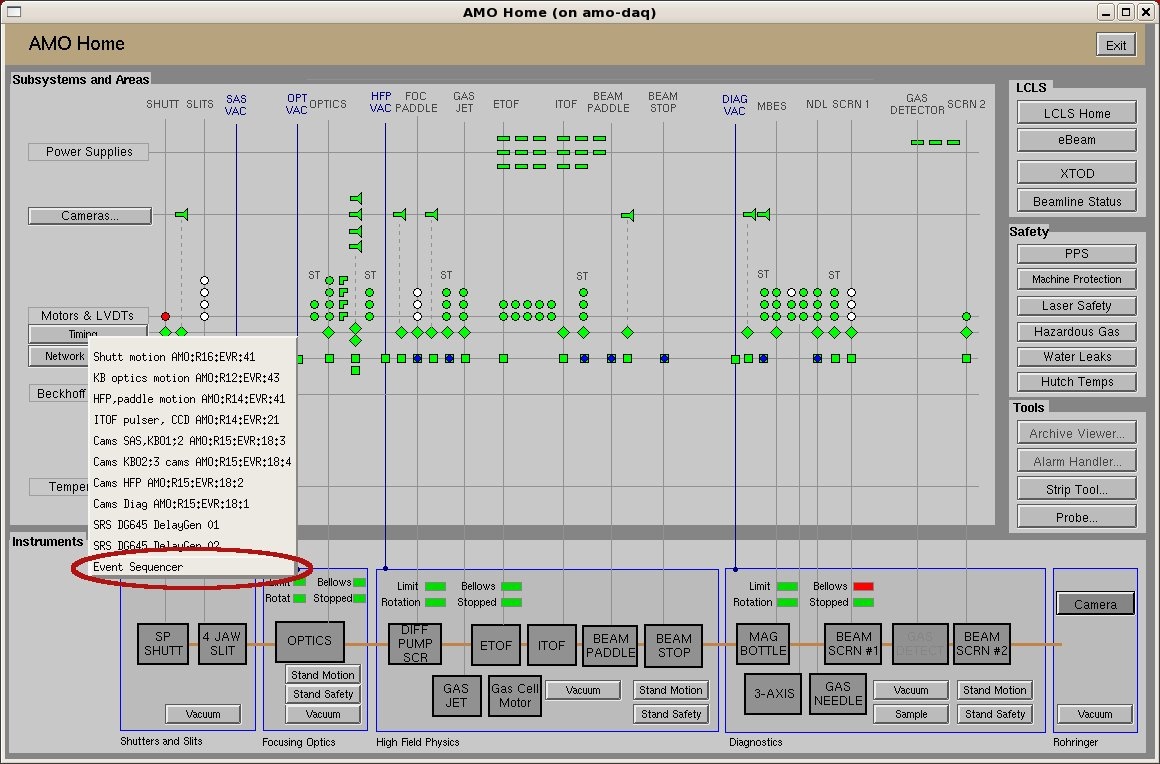
Note: Click on the menu "Timing"->"Event Sequencer" to bring up the event sequencer window. - SXR:
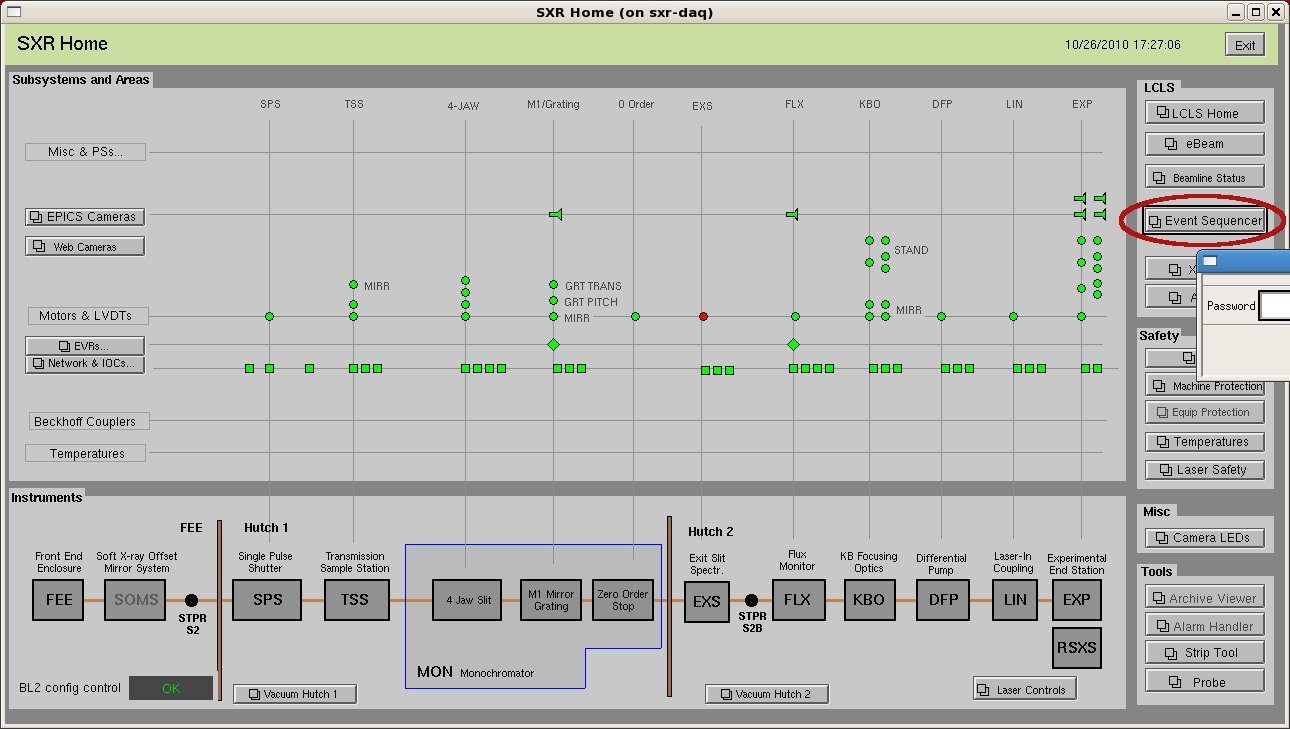
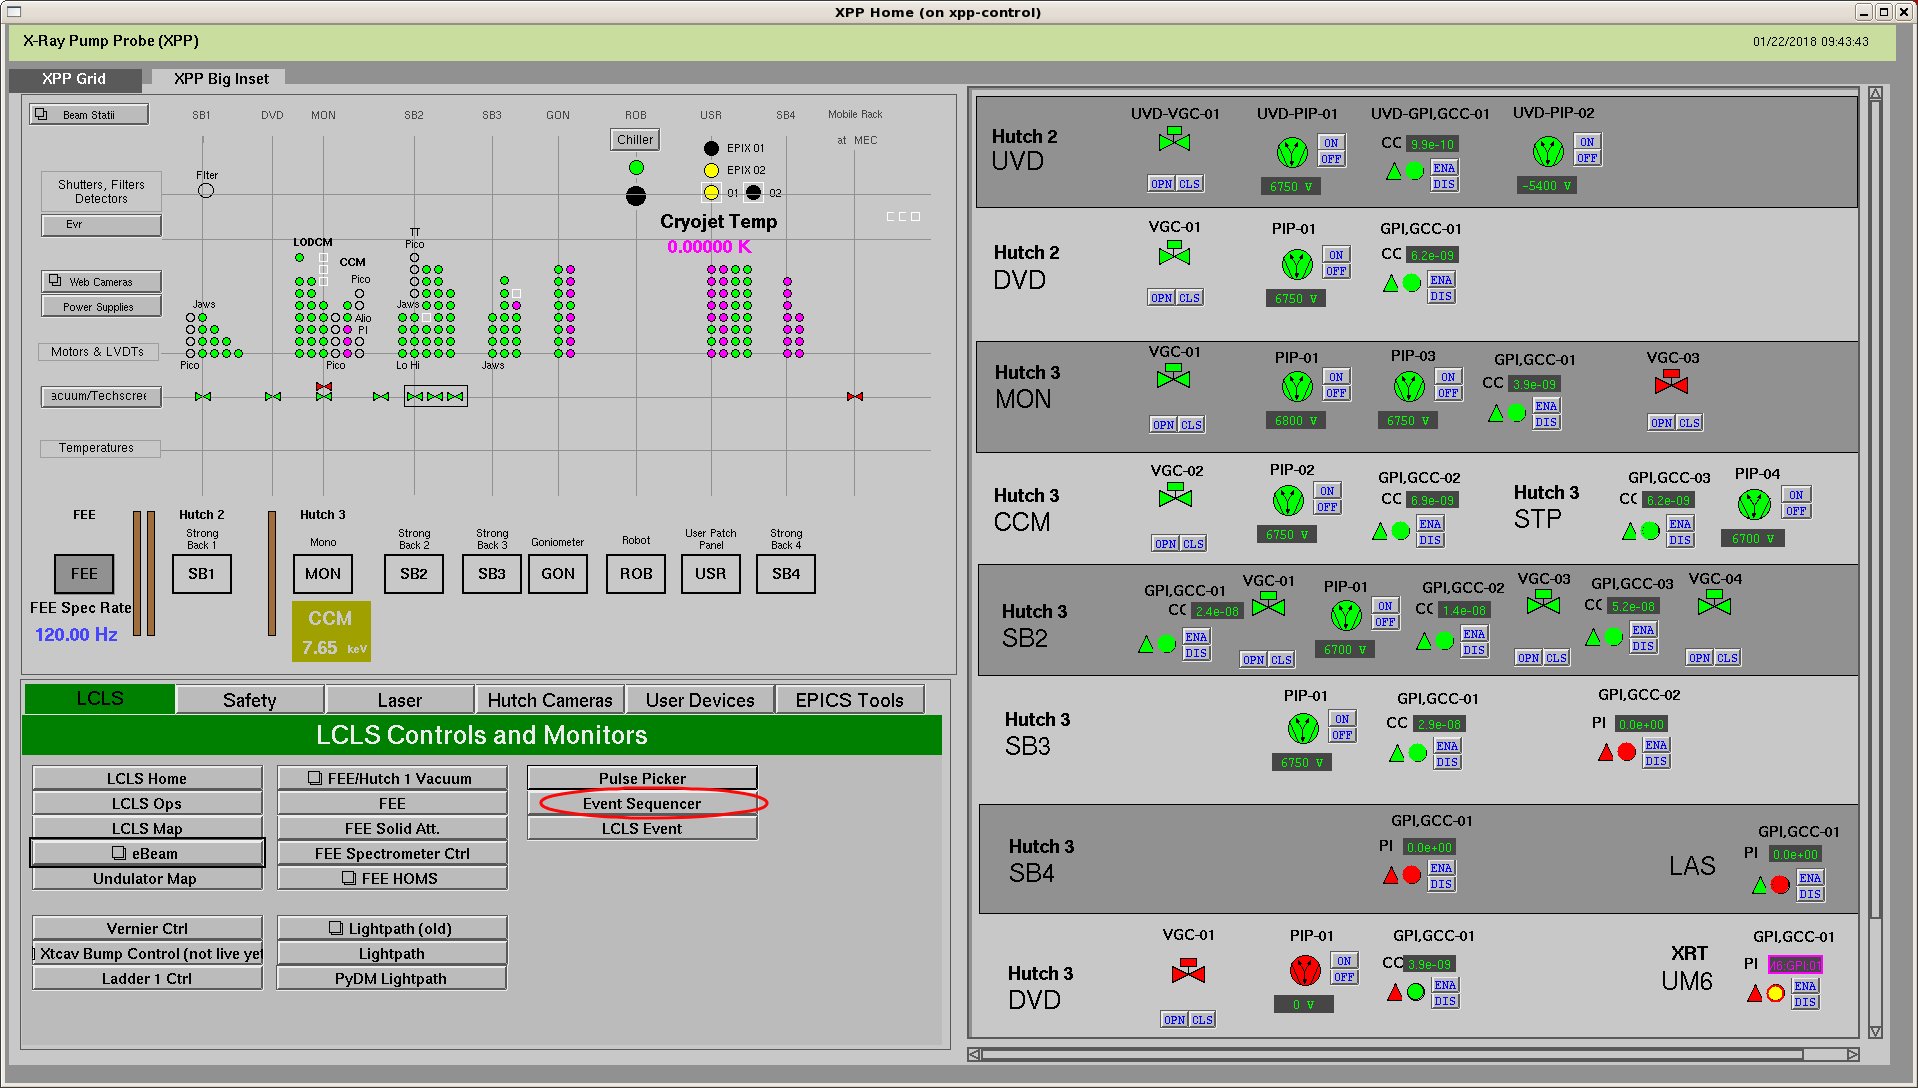
Note: The event sequencer window is password protected. - XPP or XCS: look in the LCLS tab of the lower left region of the screen.
After clicking on the event sequencer button in the epics window, and entering the password (if necessary), the event sequencer window will pop up, as below: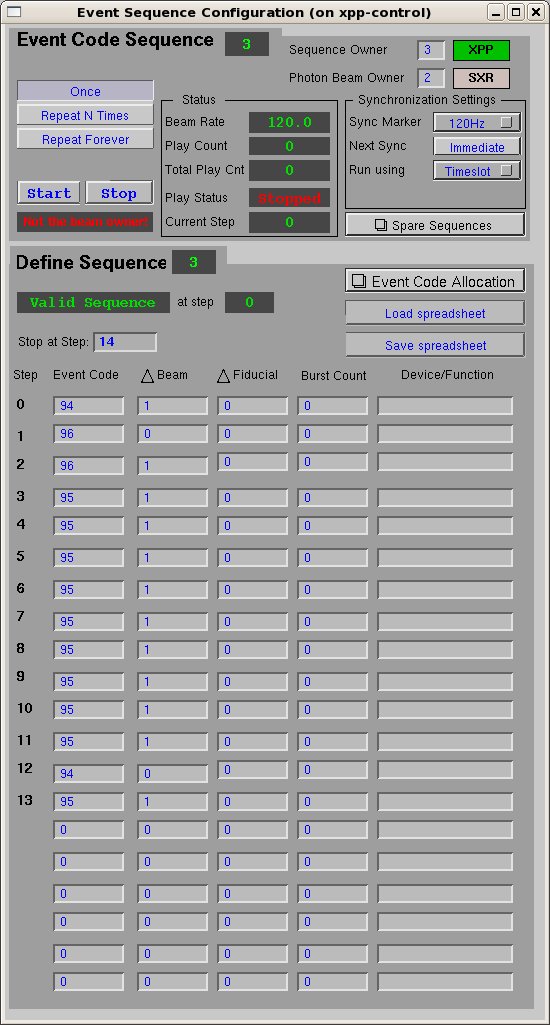
The main function of the "Run Sequence" part is to let you start or stop the sequence playing, but clicking on the "Start" or "Stop" button.
Also it shows the current beam rate, play counts and the running status of the sequencer. You can also control the play looping by clicking on
"Once", "Repeat N Times" or "Repeat Forever". More details can be found at this confluence page.
The event sequencer window has upper (titled as "Run Sequence") and lower parts (titled as "Define Sequence"). Here we only focus on the upper part.
If you click on "Repeat N Times", there will show an additional input field for entering the number of loops.
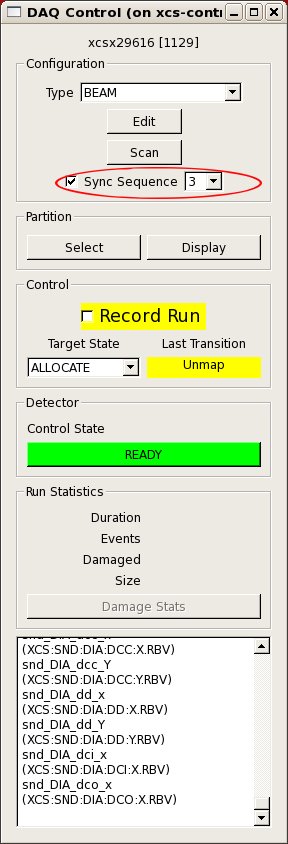
In the DAQ, you have the option to select "Sync Sequence" where you have to enter the sequence you want to sync to. The DAQ will now start the sequencer on the "enable" transition and stop it on "disable". This is useful for scans in which a sequence will be repeated for each step. Please check that the timing of the sequence running the the DAQ works, in particular if you have slow to configure detectors in the DAQ.
Recovering from errors:
LCLS-1 DAQ Tier-1 Troubleshooting
Scans etc (presentation from Oct 2021)
Running scans, PVs, elog, and smalldata tools overview
Overview
Content Tools