Controls Engineering Specification Document for Wire Scanners
Contents:
Unknown macro: {maketoc}
Brief Summary:
Wire Scanners are used to measure beam profile at various points through the LCLS. A small wire is moved at constant velocity through the beam line, and measurements are acquired that are proportional to the charge of the intercepted beam, at specific points during the travel. The mechanism will provide a means to measure the profile in X and Y, and U, the diagonal. The wires are minimally invasive as they move through the beam, although the self amplified spontaneous emission (SASE) of the downstream beam may be affected.
This document accompanies a related document, the Wire Scanner Mechanical Engineering Document, LCLS Document number 1.3-105 to form a complete Engineering Specification.
Keywords:
Profile, diagnostics, emittance, wire, scanner
Key WBS Numbers:
1.2.2.3.1 |
Injector/Controls/Electron Beam Diagnostics/Wire Scanners |
1.2.8.5 |
Injector/Controls/Linac to DL1/Wire Scanners |
1.2.9.3 |
Injector/Controls/Dog Leg 1 Bend/Wire Scanners |
1.3.2.6.1 |
Linac/Controls and Power/Electron Beam Diagnostics/Wire Scanners |
1.3.5.1 |
Linac/Electron Diagnostics/Wire Scanners |
2.2.2.3.1 |
Injector/Controls/Electron Beam Diagnostics/Wire Scanners (OPC) |
2.2.8.5 |
Injector/Controls/Linac to DL1/Wire Scanners (OPC) |
2.2.9.3 |
Injector/Controls/Dog Leg 1 Bend/Wire Scanners |
2.3.5.1 |
Linac/Electron Diagnostics/ Wire Scanners (OPC) |
Levels of Design Detail
This document addresses requirements put forth in the Linac Wire Scanner System Requirements, LCLS Physics Requirements Document number 1.1-313.
This document specifies a design by presenting different views of the subsystem, each at increasing levels of detail.
At the highest level of abstraction is the Wire Scanner subsystem. A subsystem consists of components, and each component contains elements.
When describing components or their elements, this document makes use of UML, the Unified Modeling Language, to indicate certain aspects of structure or behavior. A thorough but terse explanation of UML can be found in UML Distilled, by Martin Fowler, Addison-Wesley. UML is simply a way to describe system and software designs, primarily using standard diagrams.
Subsystem Level Design
At the highest level of abstraction, there are three main components in the wire scanner subsystem.
- The wire scanner assembly itself.
- A readout mechanism, typically a photomultiplier tube (PMT) placed downbeam from the scanner, to measure bremsstrahlung radiation. A gas-filled ionization chamber may also be used, and a measurement of the charge picked up on the wires themselves might also provide readout data.
- An operator's console application will provide control and readout of the measured profile.
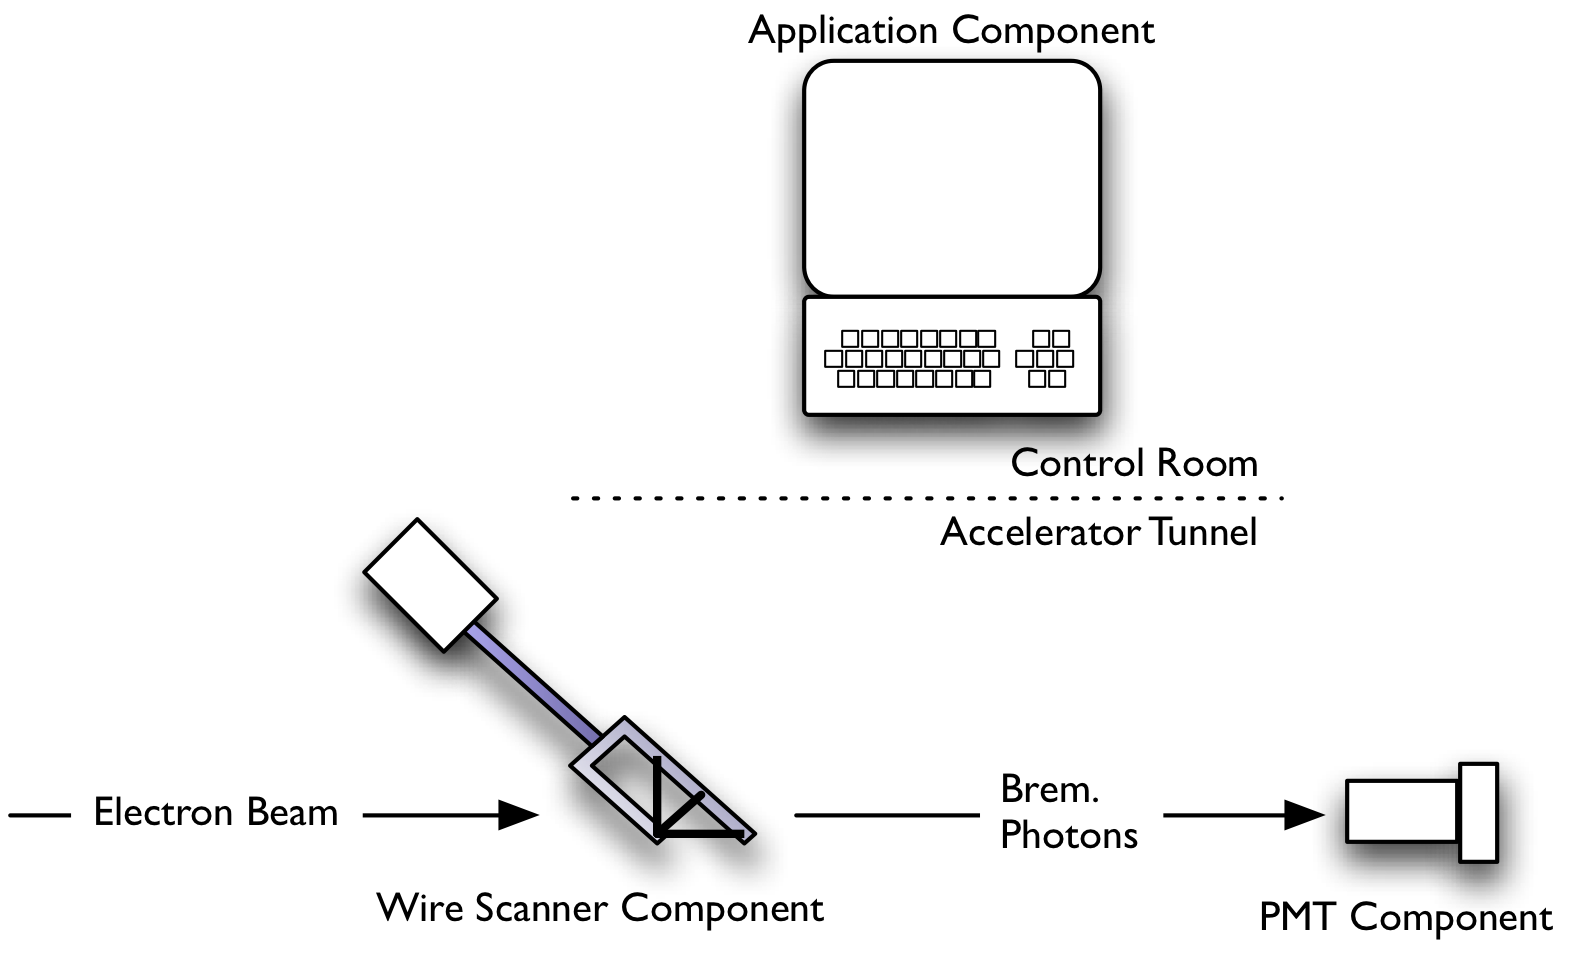
Figure 1. Subsystem Overview
High Level Operation
The wire scanner subsystem makes beam profile measurements.
- The operation starts when a person or piece of software requests a profile measurement, typically from a computer located in the control room.
- The wire scanner assembly shown in Figure 1 will move wires through the electron beam at a 45-degree angle. The horizontal wire will move across the beam from top to bottom, and likewise the vertical wire moves through the beam from one side to the other. The third wire, mounted at a right angle to the motion, travels through the beam following the direction of the wire frame's motion.
- Two different reactions occur as the wires interact with the electrons in the beam bunch. We will assume that both methods of instrumentation will be used for all wire scanners.
- Secondary emission occurs, which can be measured by the current draw in the wire itself.
- Bremsstrahlung radiation is produced, which produces photons that are visible by photomultiplier tubes downbeam.
- One or both of these reactions are measured to get a numeric value that is proportional to the beam charge at a specific position, across a specific axis of the beam's profile, at a specific point in time. Regardless of the method, for simplicity we shall refer to this as the measured beam intensity.
- As the pulsed electron beam further interacts with the wires, more data points are acquired and a simple graph of intensity versus position is built up for each axis. Each axis' graph will ideally have a Gaussian style distribution.
The simple action of measuring beam intensity with a moving wire relies primarily on two measurements; reading the wire's position and reading a measure of beam intensity. To do this accurately and efficiently introduces more complexity.
- Both measurements must be made as close to one another in time as possible, as determined by a common trigger based on the beam bunch arrival. The wire position is actually calculated by measuring the motion of the motor.
- The software can correct for bunch-to-bunch variations in transverse centroid position, by measuring beam centroids from surrounding Beam Position Monitors (BPMs) and using them with a beamline model.
- Wire motion velocity can be reduced when the wires are close to the beam. It can be increased when moving to another position without intercepting the beam for measurement.
Subsystem States
The wire scanner subsystem will attempt to transition to the positioned state after it starts. Specifically, it will position the wires such that minimal motion is required to have it intercept and scan through the beam.
Initially, their position might not be known, or perhaps they are sitting at a limit. In any case, the wires will be moved to the optimal position.
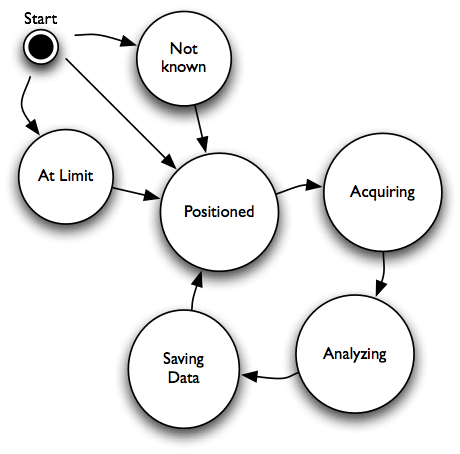
Figure 2. High Level States of Wire Scanner Operation
From the positioned state, the system will acquire data by scanning the wire(s) through the beam, and be in the acquire state. Once acquired, data will be saved to a file, or given to some program as input, for further analysis and interaction with the user. This state of saving data might best be named starting to save data, because the analysis and user interaction is started asynchronously, and the wire scanner component is allowed to proceed to another scan, if requested.
Detailed state information is shown below.
Component Level Design
Each of the three components shown in Figure 1 requires associated equipment. An overview of these elements is shown in Figure 3.
- The wire scanner assembly requires a motor to move the wires through the beam line. It also requires an analog to digital converter (ADC) to measure the induced current from secondary emission on the wires themselves. A computer processor, a single board computer must have access to the ADC and motion controller, and be accessible on a network from the control room. This processor is called an EPICS Input/Output Controller (IOC).
- The PMT requires a base to provide high voltage as well as a source for that high voltage which can be remotely controlled. It requires an ADC to read the current produced by the photoelectric reaction in the tube. For Ion chambers, high voltage is also required, as well as a supply of ionizing gas, such as Argon.
A combination of PMTs and Ionization chambers will typically be used for any given wire scanner instance, and we'll refer to both as PMTs in this document. 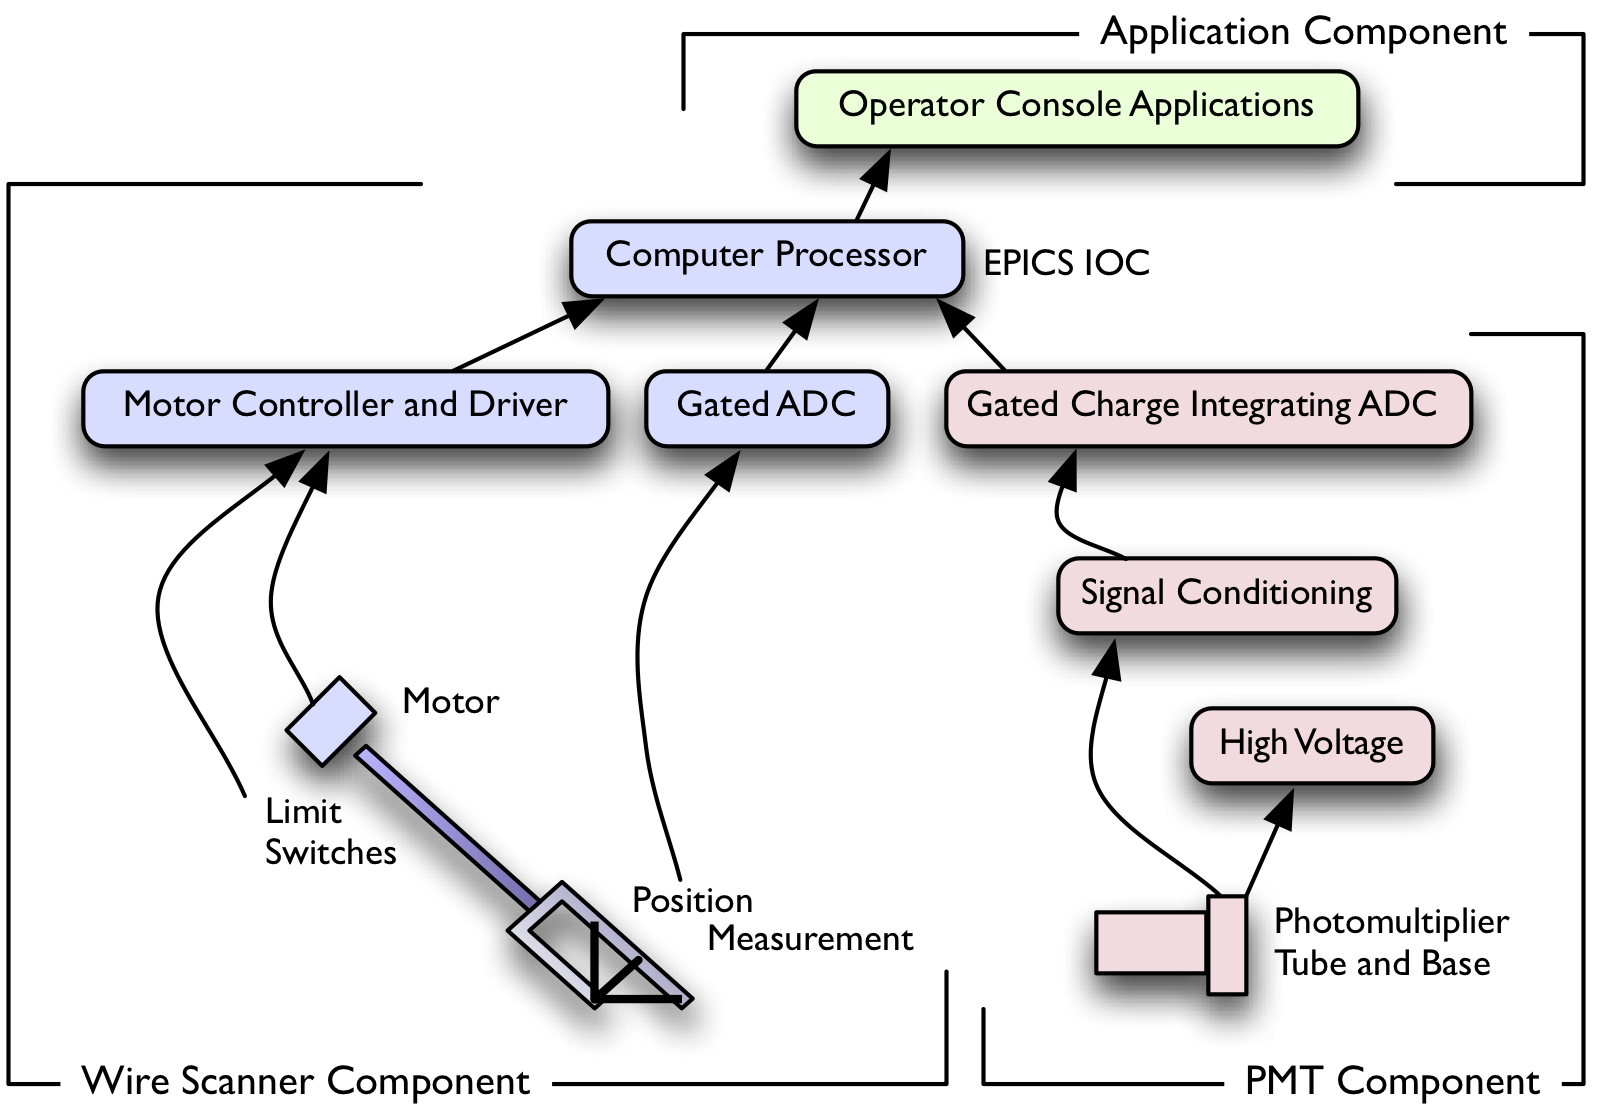 Figure 3. Component Overview with Required Elements
Note that the Gated ADC for position measurement is used primarily for calibration. It can also be used if alternate operating modes are tested. Specifically, if we can read position information from an encoder device on a pulse-by-pulse basis, this might prove a viable alternative to reading the steps remaining in the motor controller to determine wire location.
Details of how these elements interact are described below, but it's important to note that the user's perception of speed is important, and we want to take advantage of all tasks that can occur simultaneously. As Figure 4 shows, the actions of motion control, acquiring data and displaying information can all be done concurrently.
As mentioned above, a time component is missing, and specifically the acquisition of the position and of the beam intensity must be synchronized with the intercept of the wires by the beam. Figure 3 does not show the timing elements required by the process. 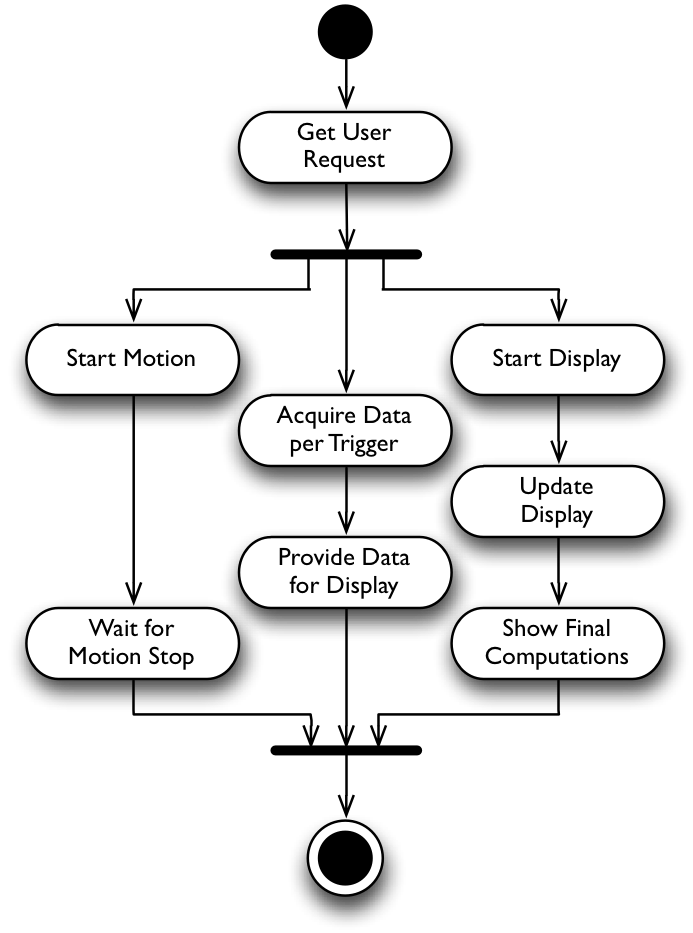 Figure 4. The Concurrent Nature of Wire Scanner Components
Component Activities
We can show the sequence of actions that would typically occur between key elements in the wire scanner.
Figure 5 shows the communication between components, assuming beam intensity data and Wire Position data can be read by a single computer (IOC.) 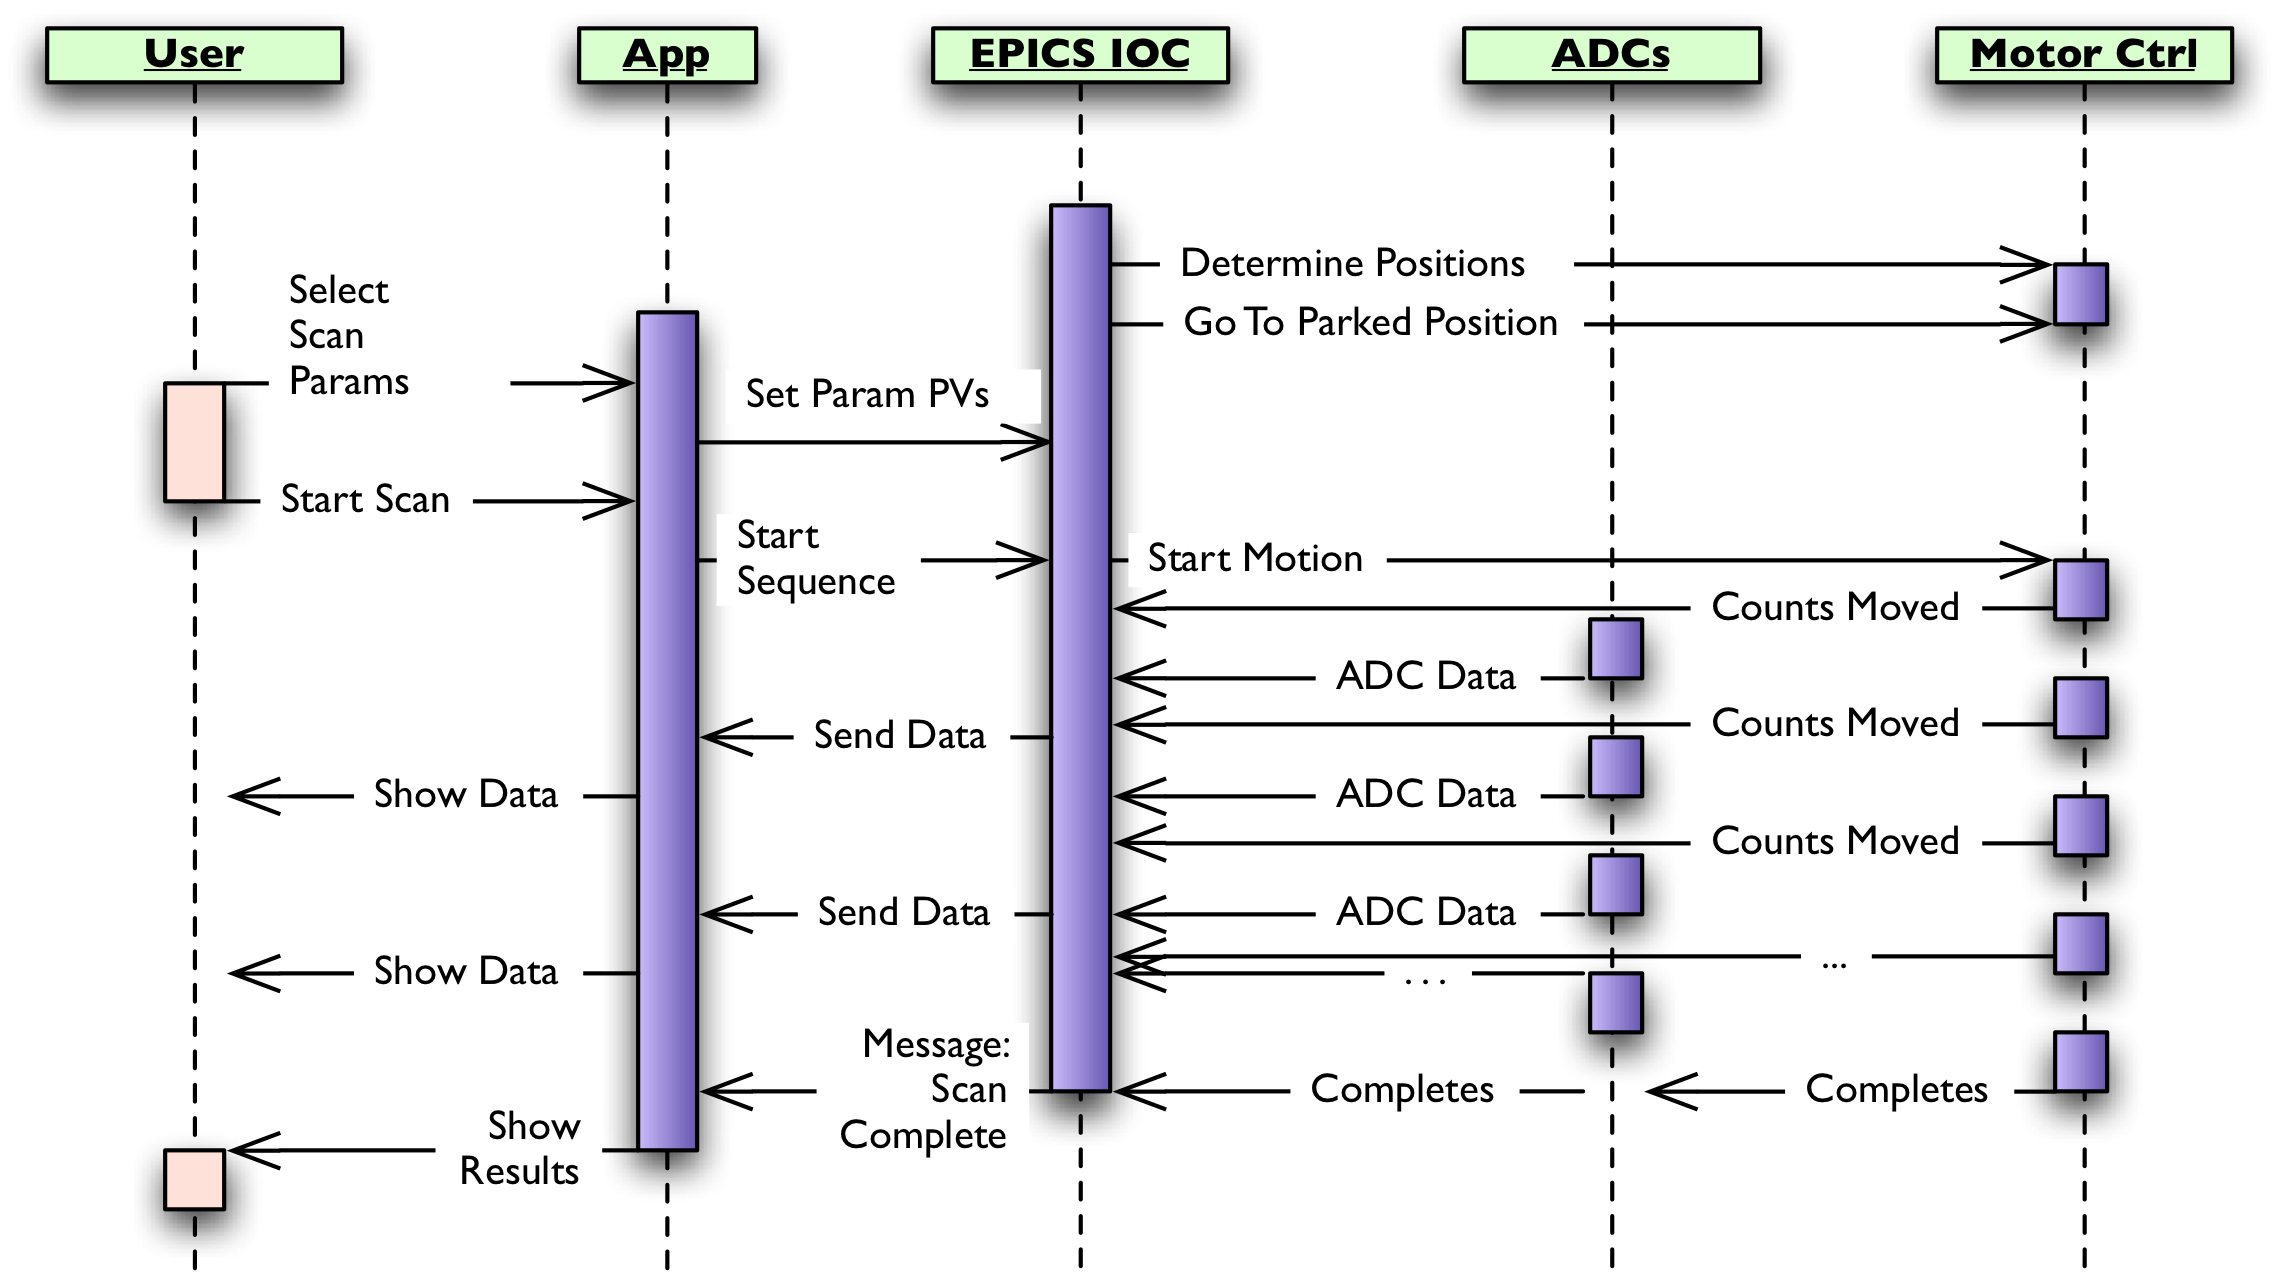 Figure 5. High Level Actions Between Elements
Time is indicated by the vertical axis in Figure 5. Note on the right that the EPICS IOC requests the motion controller element to determine it's position, then move to a well-defined position if not already there. This is done before any user action, typically when the IOC processor starts. Once the user starts a wire scan, motion is started and, until the motion completes, motor counts and ADC data are read with each beam pulse interrupt and passed to the application where it is presented to the user.
Element Level Design
The term element is used in this document to identify those devices, cables, assemblies and pieces that make up a component. It is only an issue of terminology.
Details are described from the bottom up, from details of hardware elements to user interaction.
Organization of Elements
Most of the elements shown in Figure 3 must exist for each wire scanner, but some can be shared. A gated ADC might have several input channels for example, which wire scanners in close proximity could share, and motor controllers can often control multiple motors.
If wire scanner and associated PMTs are in close proximity to one another, a single IOC could be used to manage the system, as shown in Figure 6. 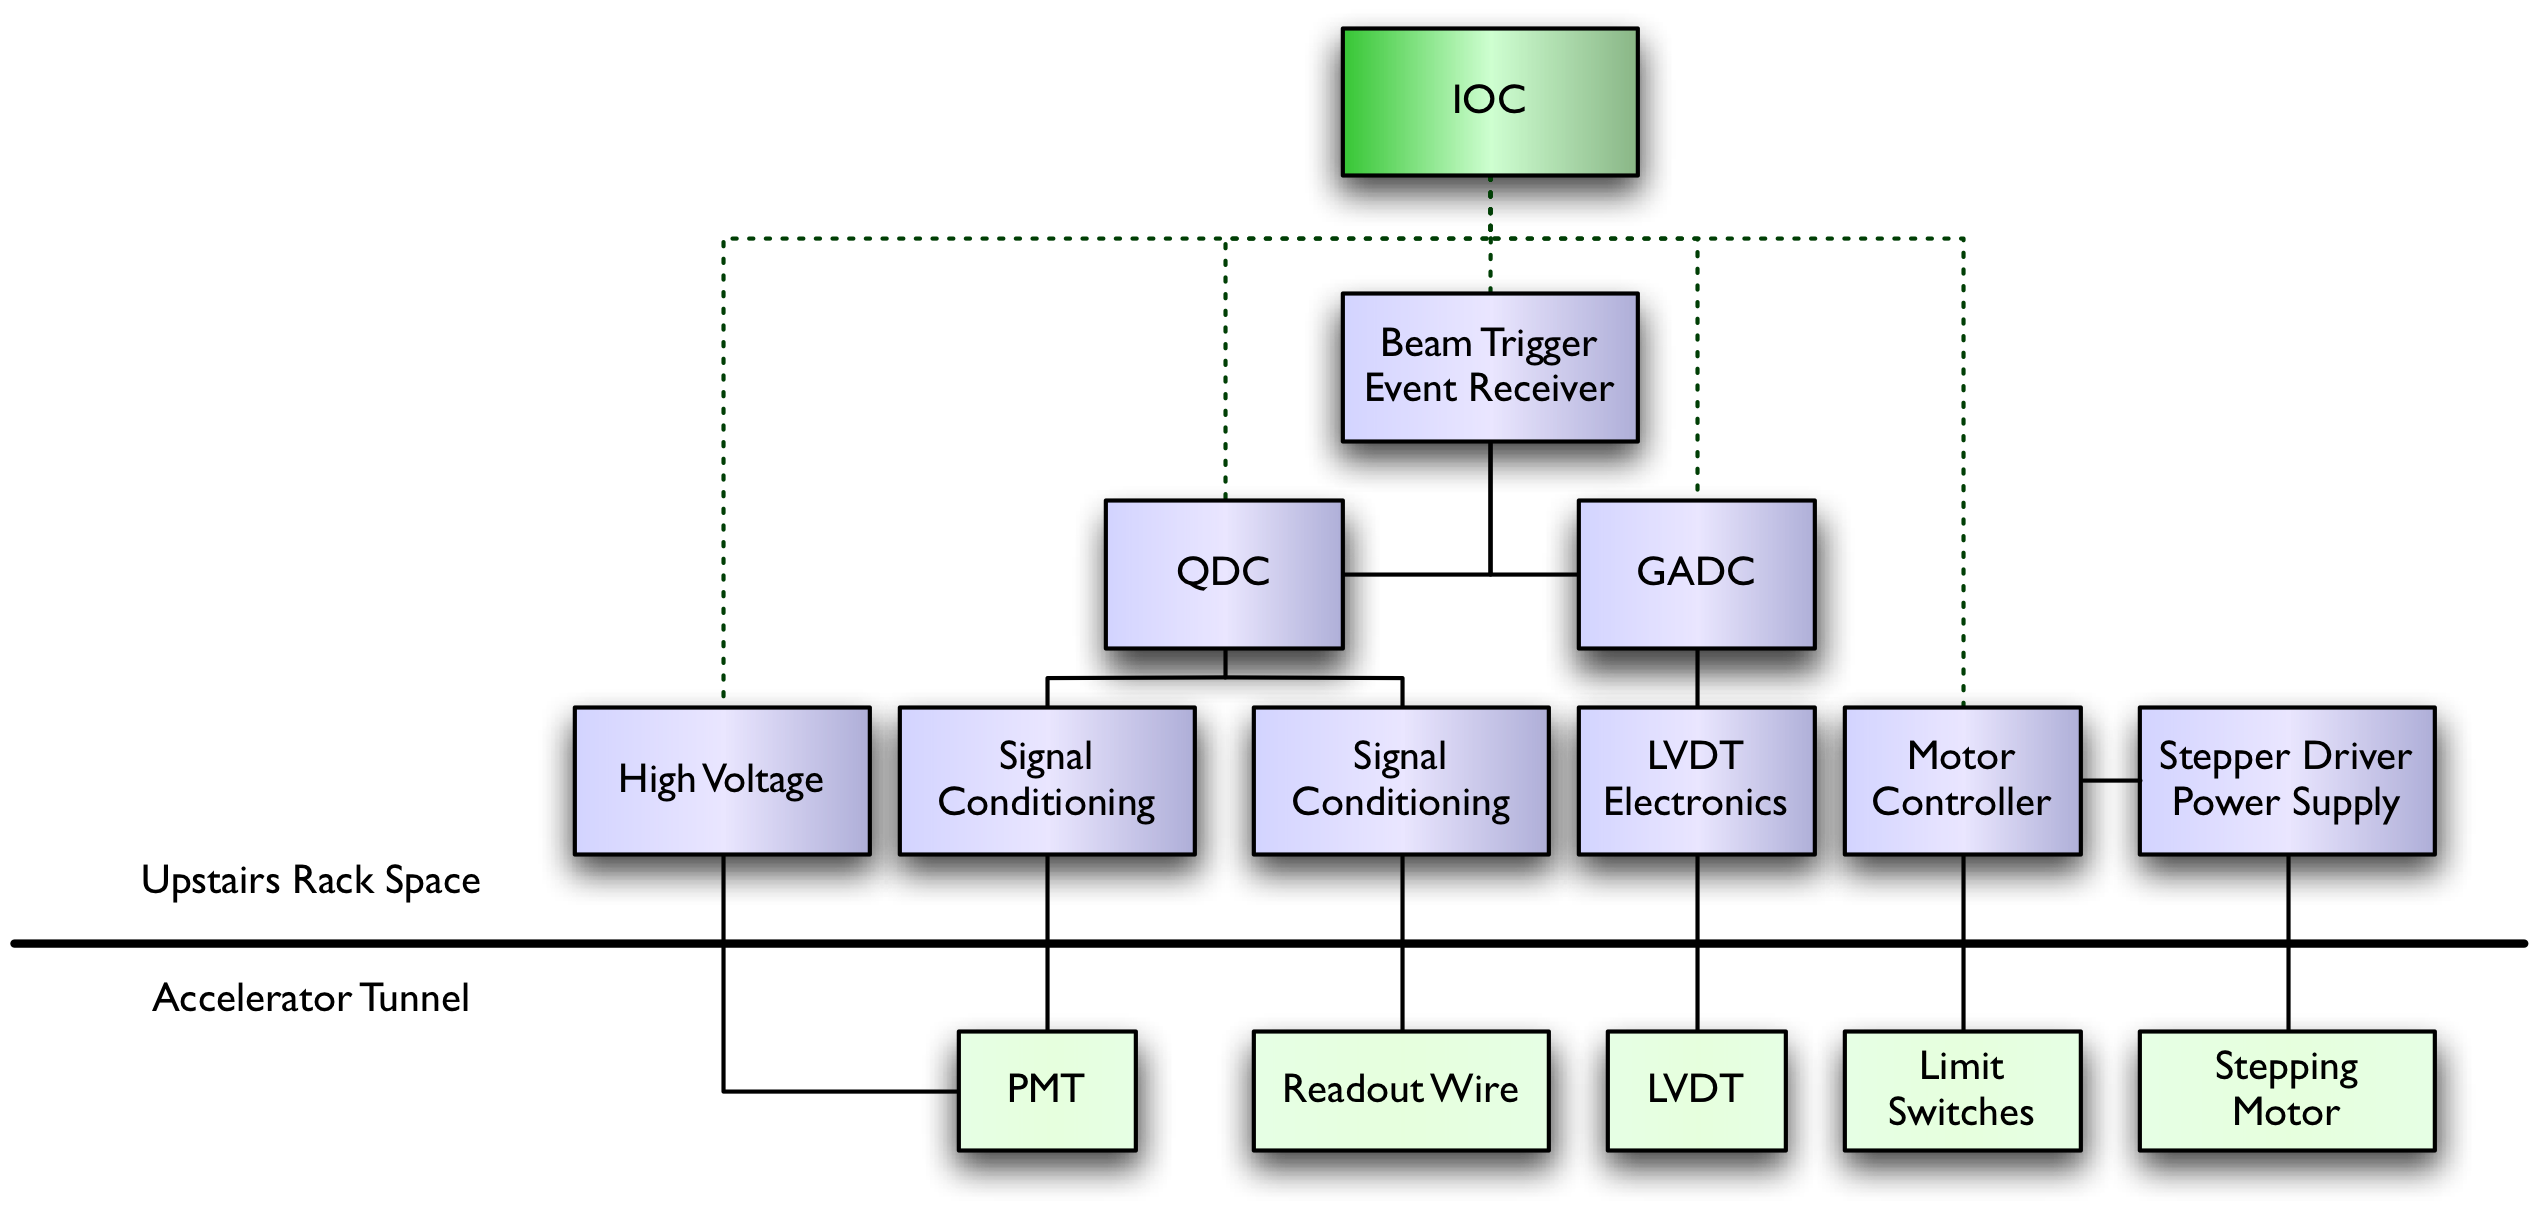 Figure 6. Wire Scanner Elements Managed by a Single IOC.
The dotted lines coming down from the IOC indicate local register-based device access. There are five main devices that the IOC needs to access directly.
The QDC attached to the readout wire is shown as a proof of concept; previous experience at SLAC has shown direct wire readout to be unreliable, but LCLS beam characteristics might provide better results. This QDC will be read and tested when LCLS beam is available, to see if this approach is feasible and reliable.
Unfortunately, the PMT component is sometimes far downbeam from the wire scanner component and because their analog signals have limited range, they will require a separate IOC to reside closer to the PMT. Figure 7 shows the subsystem with a PMT instrumented in a separate IOC. 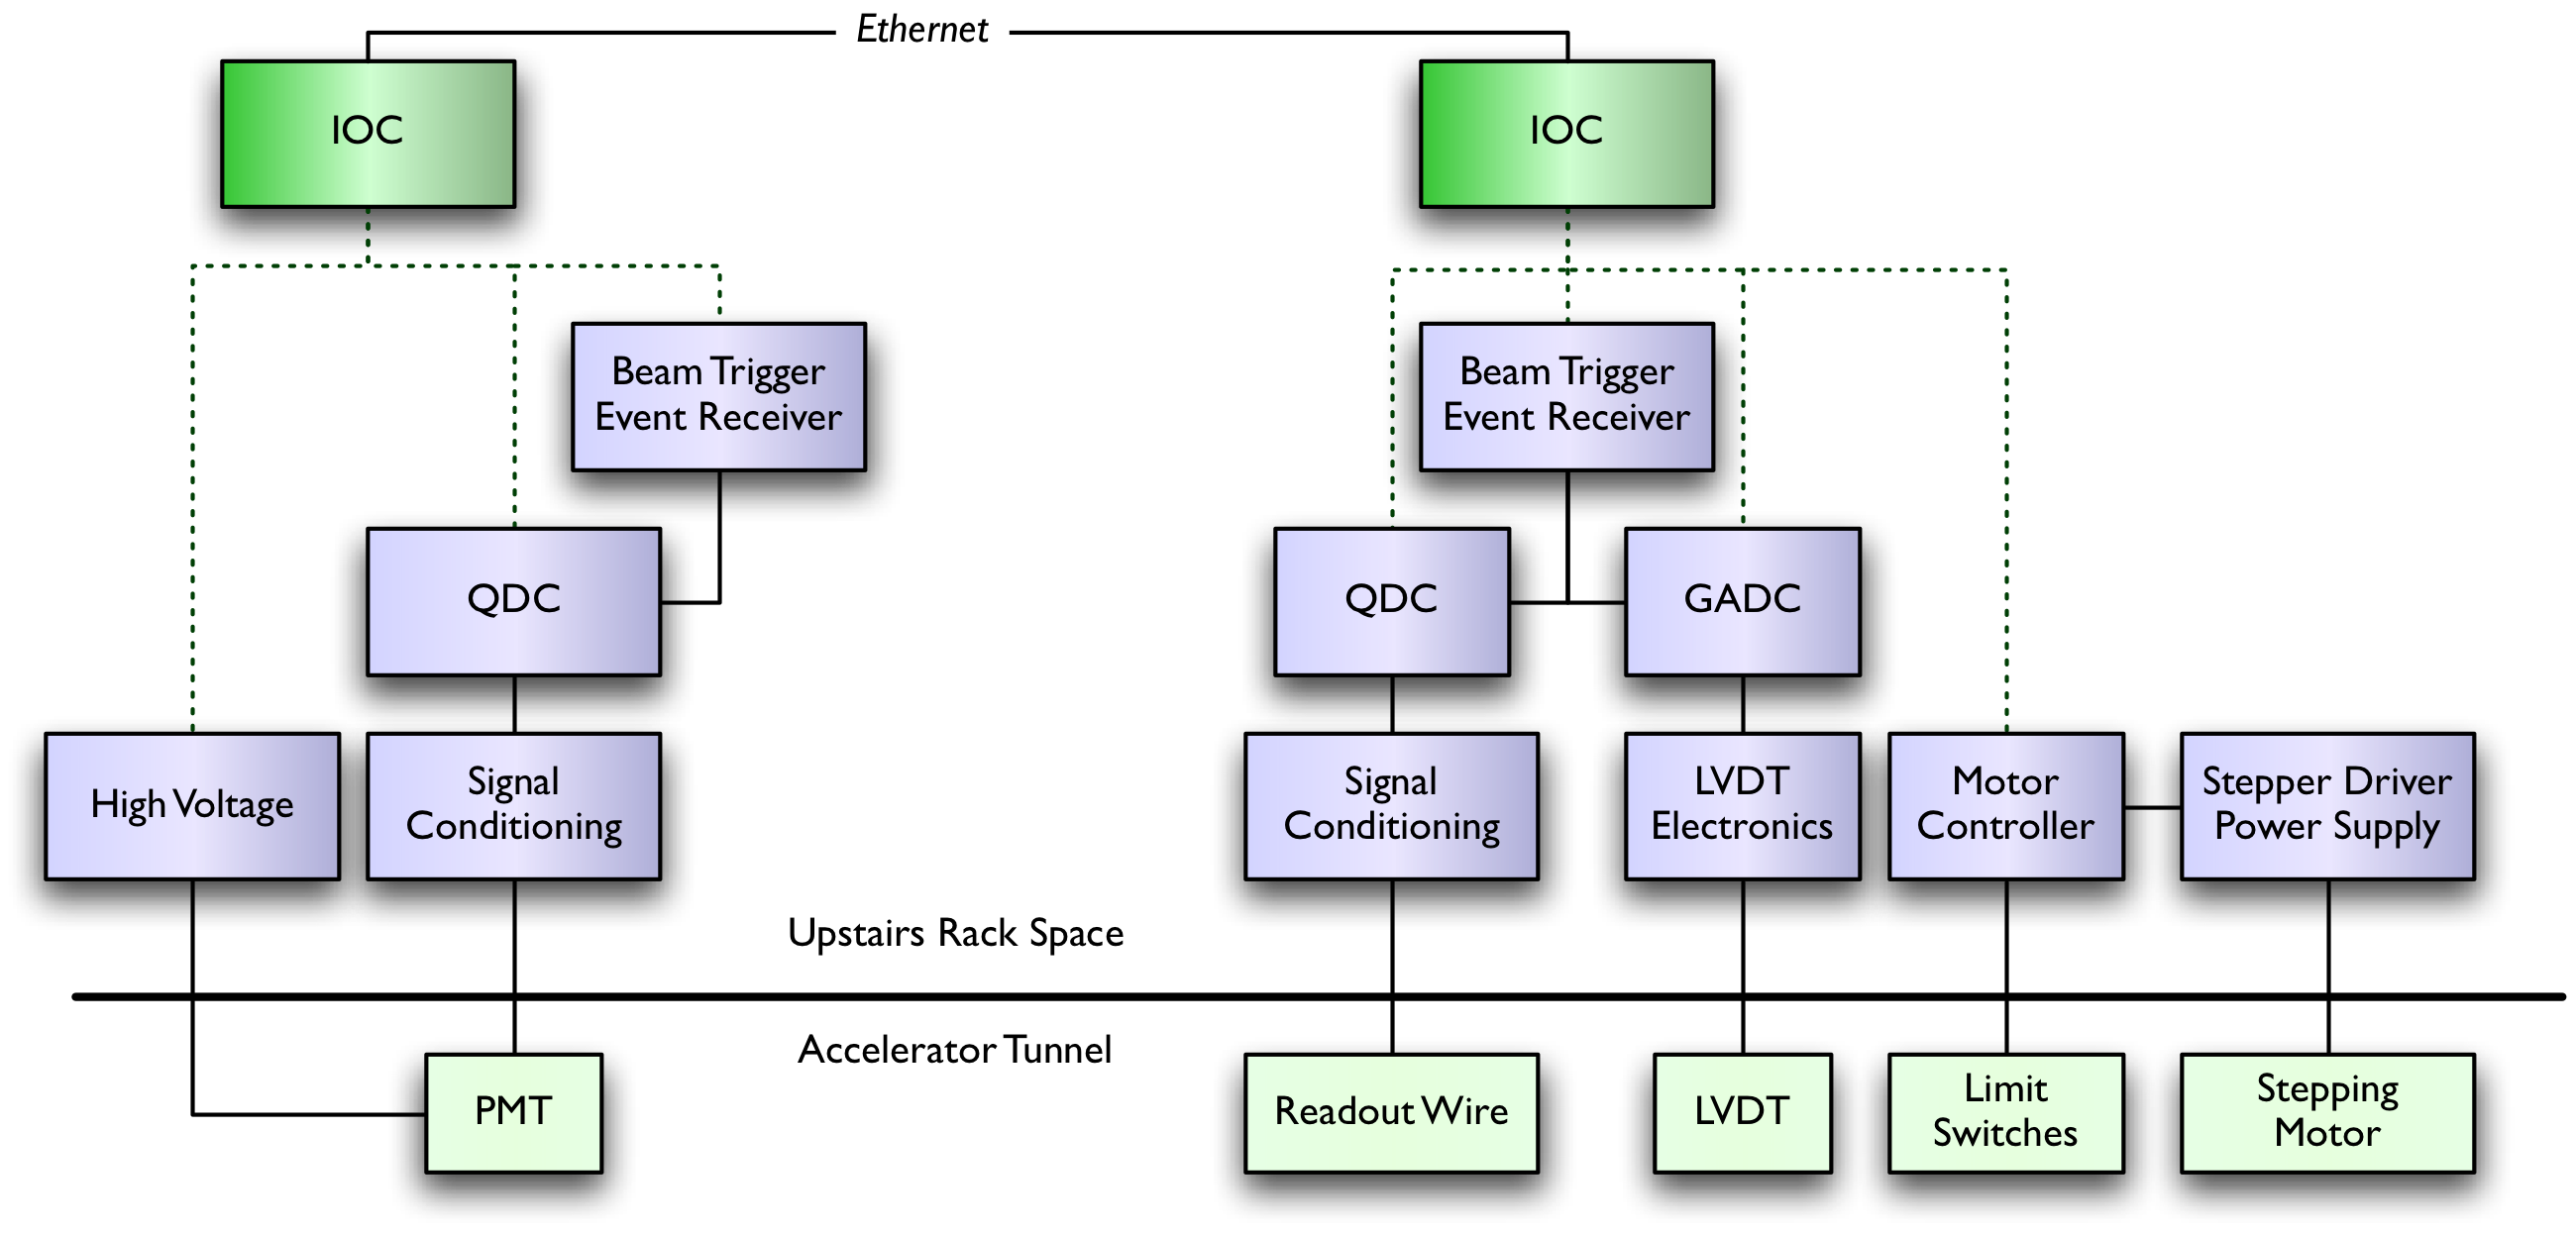 Figure 7. Wire Scanner Elements Managed by Multiple IOCs.
The LVDT is a Linear Voltage Differential Transformer device, used to measure linear position. It will be used for calibration and quality assurance, but potentially for pulse-by-pulse position measurement as well.
Component Behavior Details
Whether managed in a single IOC or not, the PMT data and the wire's position data will be correlated with a common external identifier, the ID word from the accelerator timing system. This identifies the beam pulse and supplies a timestamp that can be saved on different computers to correlate data acquired by the same event.
The Beam Trigger Event Receiver (EVR) produces a TTL-level signal at a specific rate, tied to the beam itself. Delays can be programmatically set to ensure the ADC channels start conversion at the right time. Also, the wire position is not read directly, but is estimated by looking at the number of motor pulses generated by the motor controller.
We can consider a more detailed sequence of events within an IOC:
- The IOC sets initial values and ensures motor position.
- Motion is started; the number of steps to move is loaded into the motor controller.
- The IOC receives an interrupt from the EVR, or from the QDC in a single-IOC system.
- Whether a single or multiple IOC system, the QDC value is queued internally along with the EVR timestamp.
- As soon as possible, the IOC reads the number of steps remaining in the motor controller.
- A simple calculation gives the current position of the wires; the position and the EVR timestamp are queued internally.
- A separate thread awakens and retrieves the wire position with it's timestamp from the queue, then takes the corresponding QDC value based on its timestamp from the other queue. If the QDC is on a different IOC, a channel access request is made to retrieve the data, and in any case, that QDC data is saved with the wire position and timestamp.
These measurements are then passed to a display application immediately, to update the user's status screen. Once complete, some simple fitting and analysis computation is done, and the results are made available to the user's client software.
Interface Specifications
There are several interface points in the wire scanner subsystem, from the user at the topmost level, to the hardware at the bottom.
User Interface
Users will gain access to the wire scanner subsystem using one or more client applications.
- The default application provides access to basic functionality of the subsystem.
- A second application provides access to maintenance functions, notably calibration and testing.
- A third set of applications provides a high-level interface to emittance measurements and other operational functions.
The default application starts with a basic selection screen. The user selects the wire scanners to be used. By default, the associated PMTs are also selected and predetermined options are enabled. So, the user need simply select the wire scanner and press the Start Scan button. 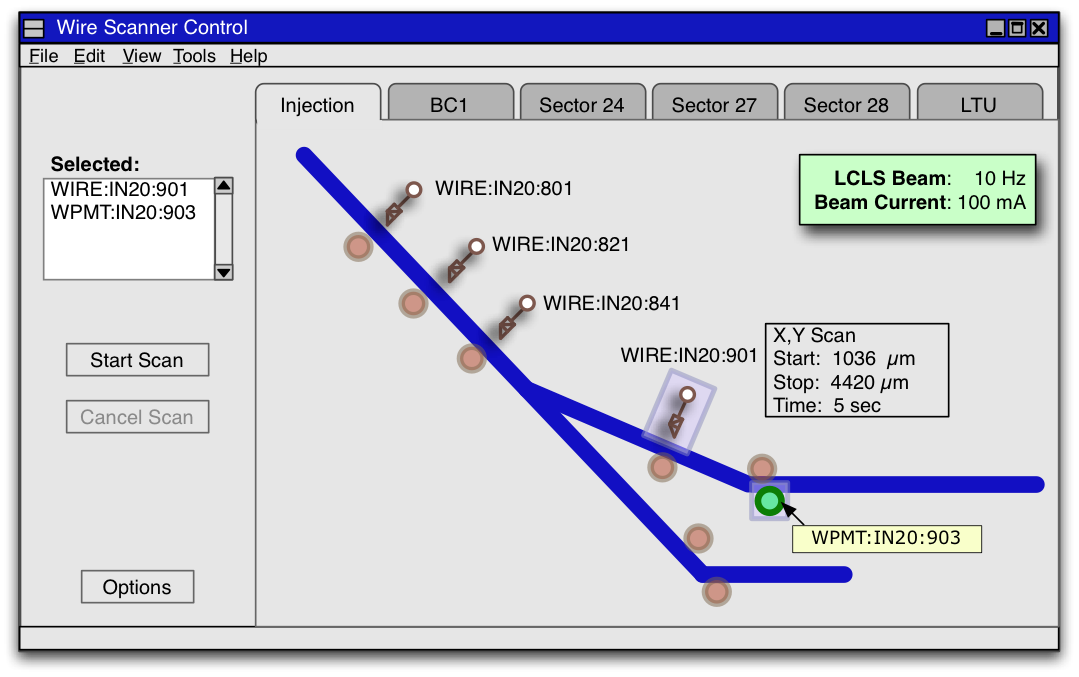 Figure 8. Main Screen for the Basic Client Application
Once a scan has started, a status dialog box will appear. It will update the scan proceeds, to provide a rough idea of the scan quality to that point. 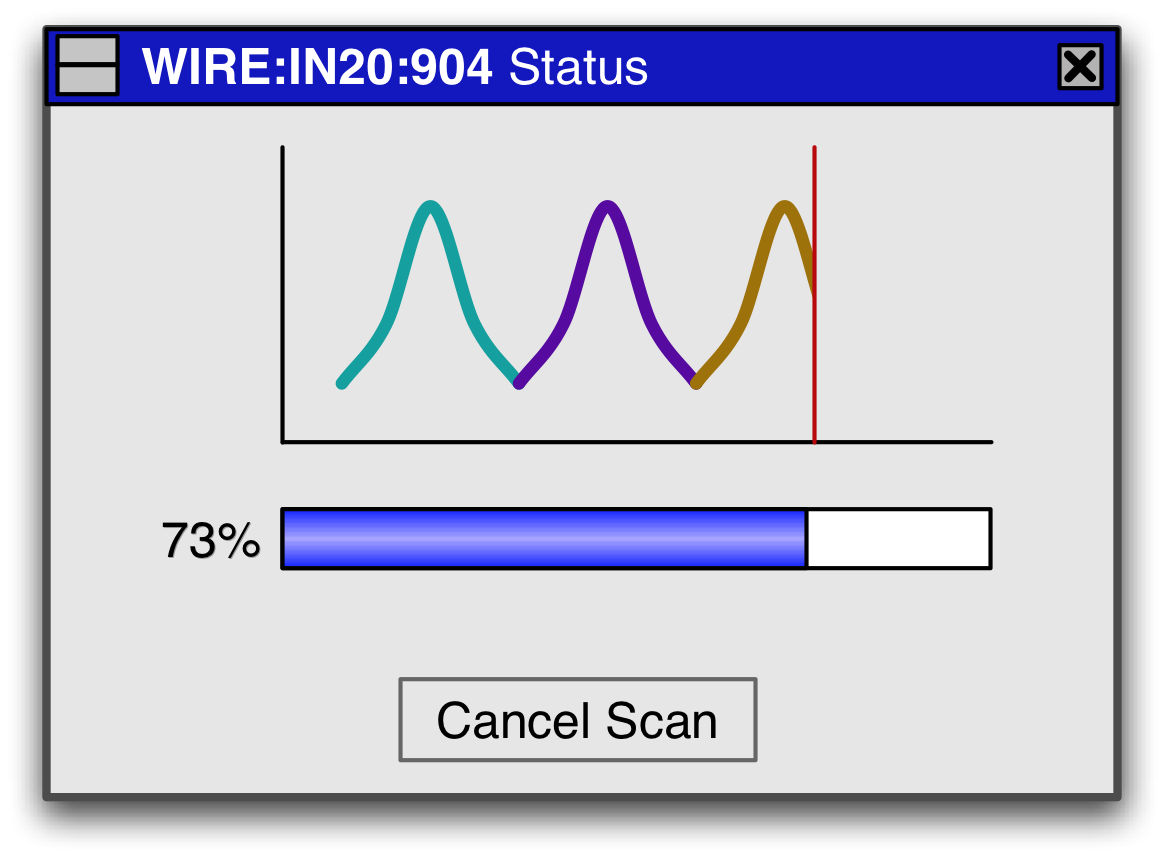 Figure 9. Status Update Screen
The user can change options for the scan, and can save those options as the new default settings for subsequent scans. Certain options take effect immediately, to influence the current scan. Other options only take effect on subsequent scans. 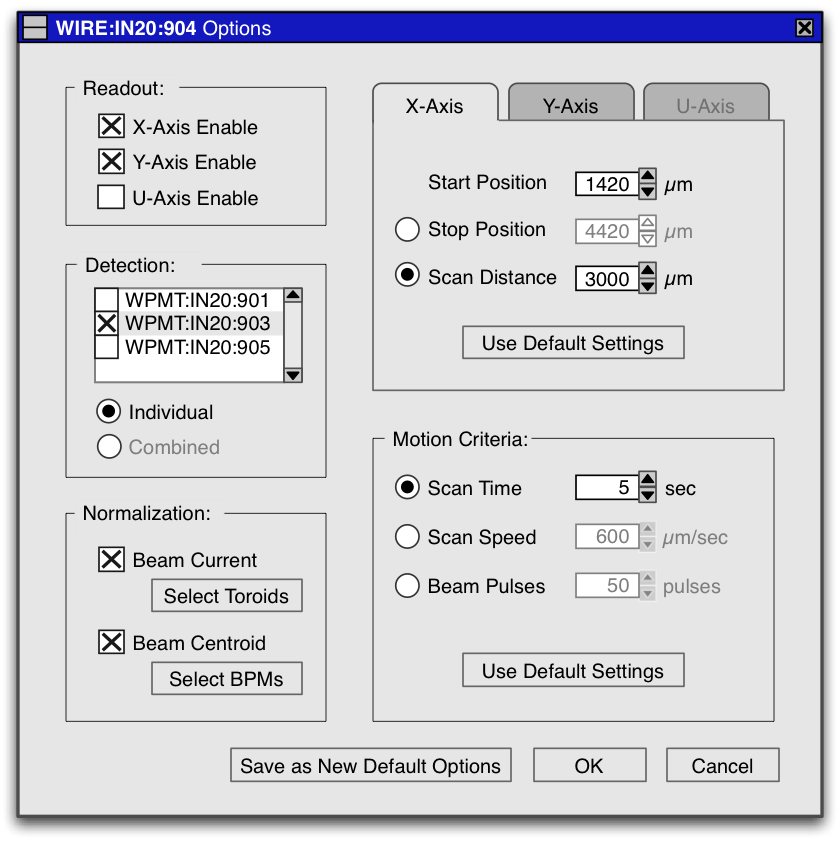 Figure 10. Wire Scanner Options Screen
Once complete, the status window will close if it was still visible, and the results window appears. Some basic analysis results are shown, and the user can save the data, the results or both for future reference. 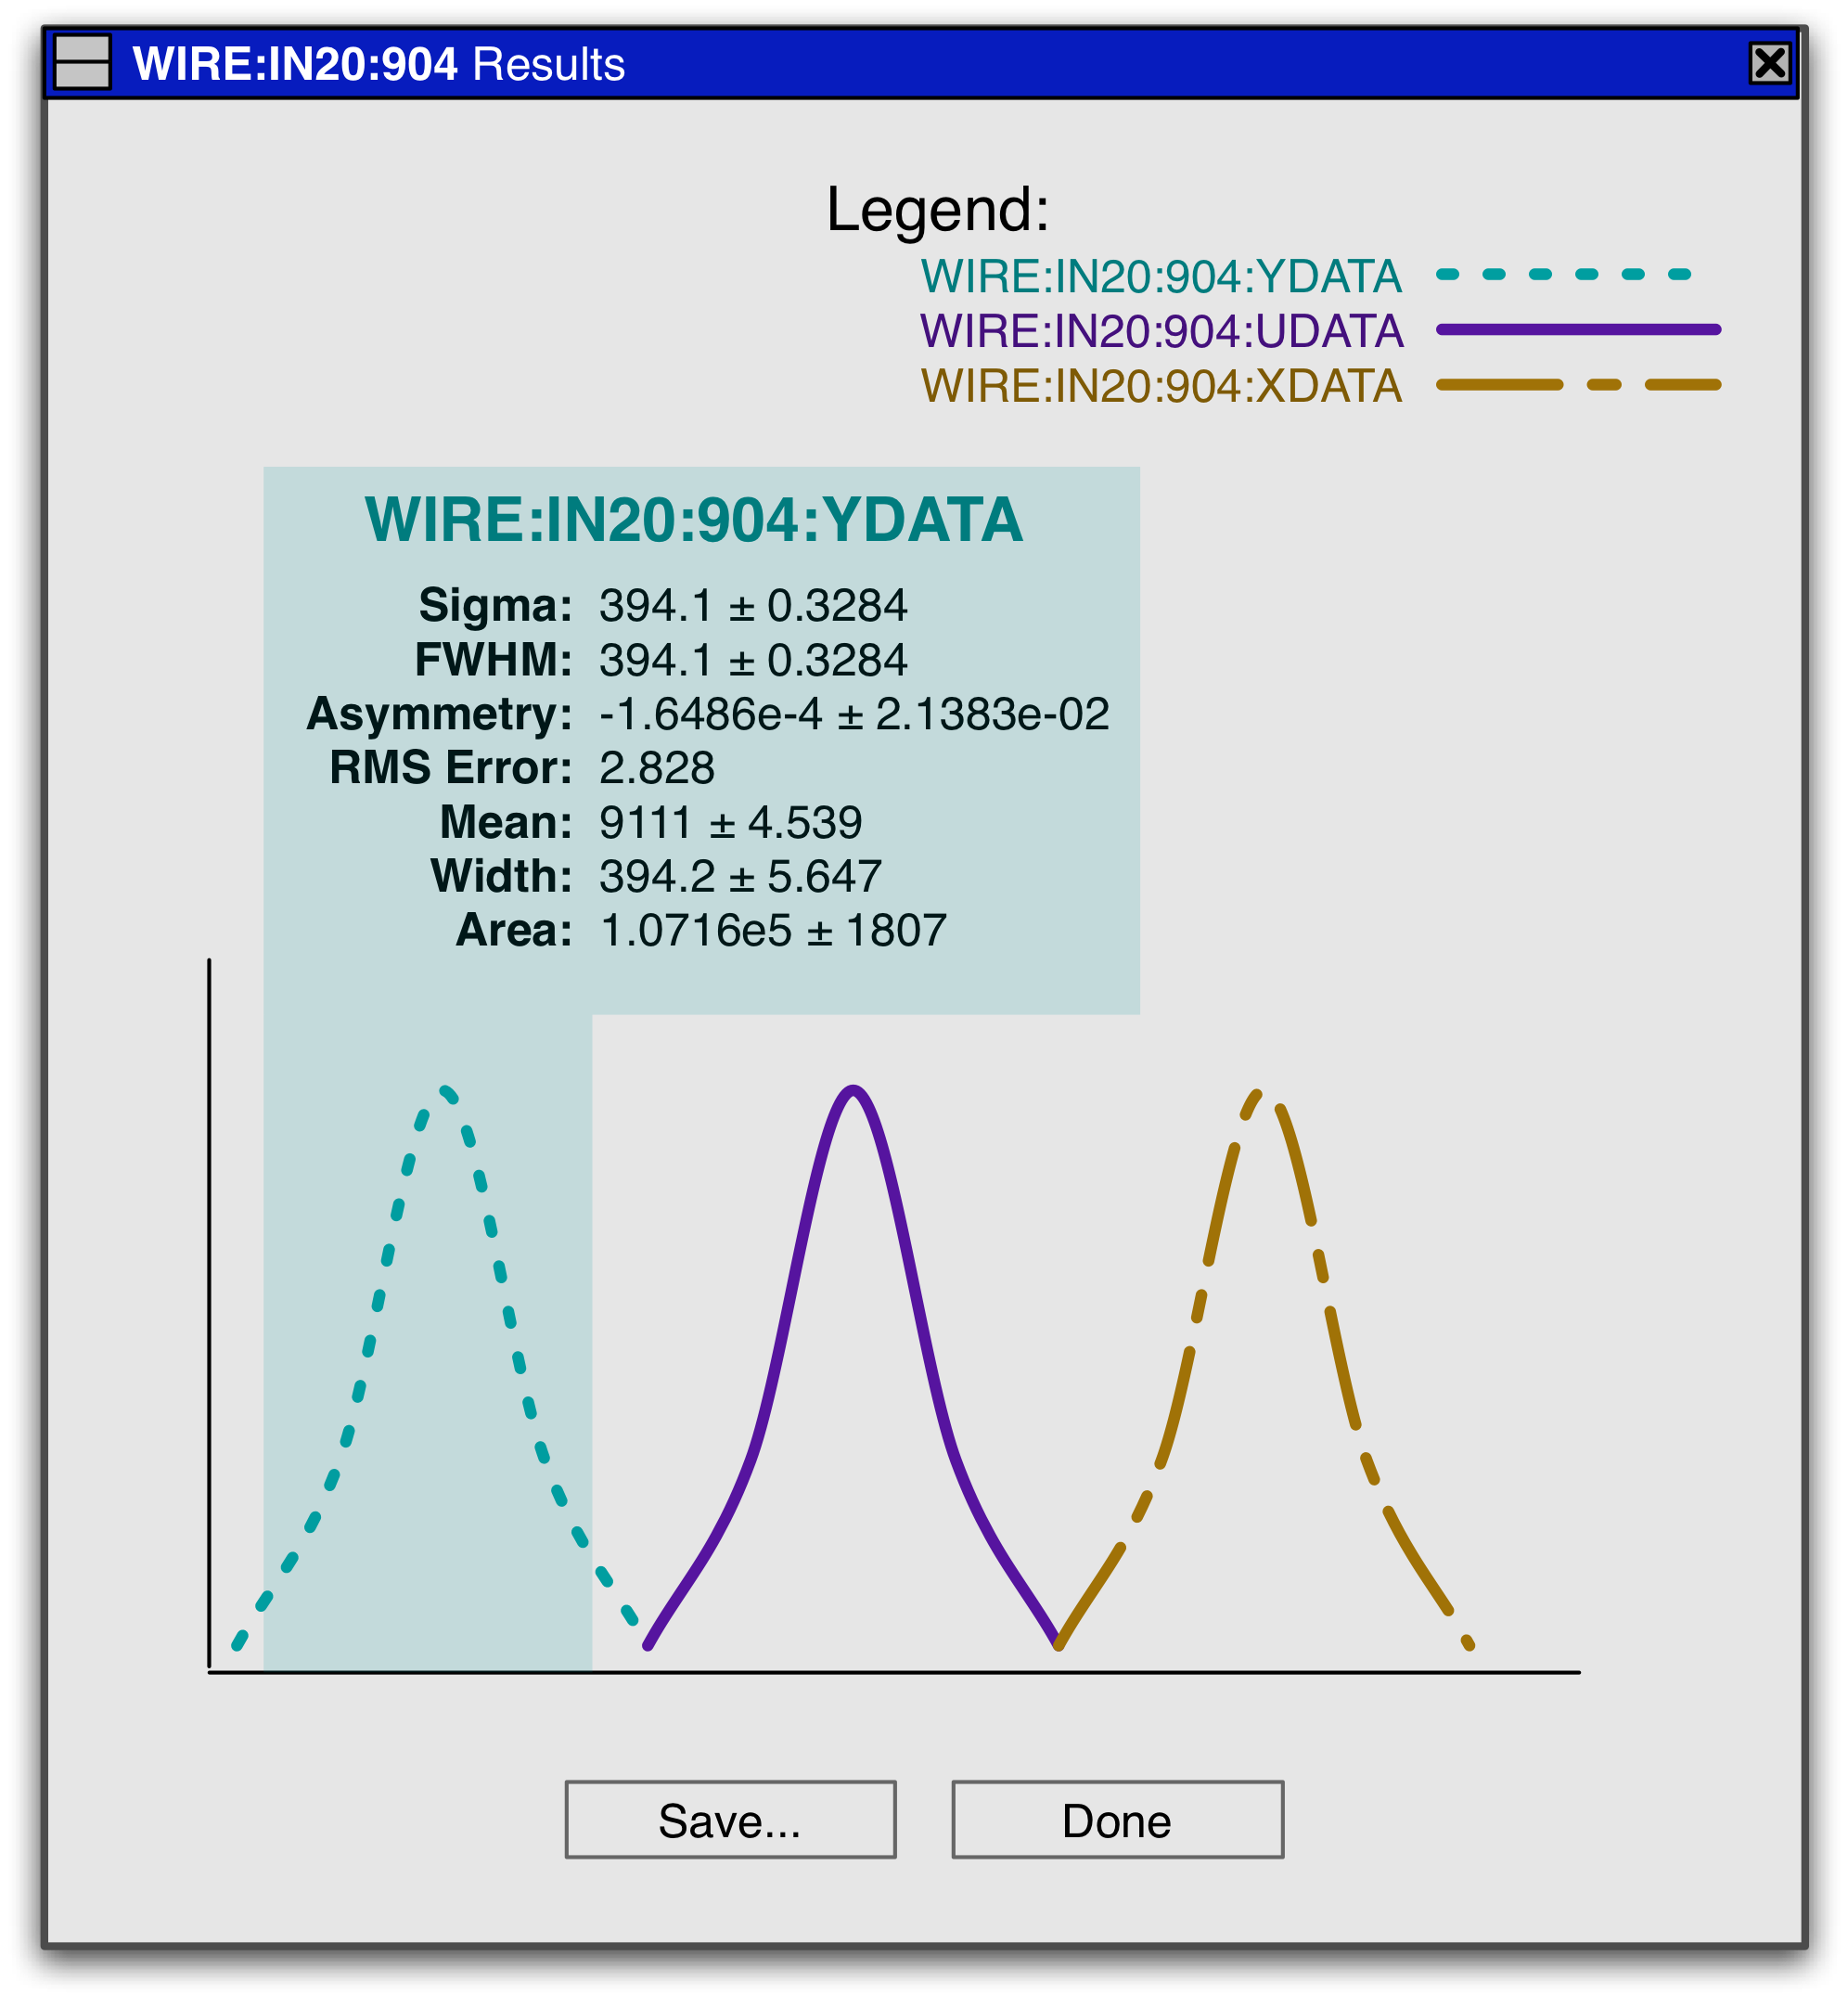 Figure 11. Results Screen
The wire scanner and PMT components together act as a server. The application component, as shown in Figure 1, acts as a client, and must communicate with the server through a well-defined interface.
The system is based on EPICS, which uses Channel Access as the protocol. The server interface is based on Channel Access, but is specified at a higher level of abstraction. 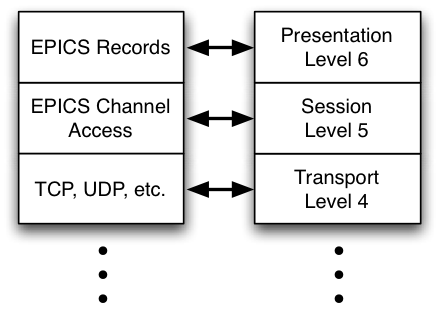 Figure 12. Basis of the Wire Scanner API
The wire scanner provides an API based on EPICS records. Each major function, every option and all data and status results are communicated through EPICS records, commonly called Process Variables (PVs).
The user interacts directly with a client application, which uses this API to effect changes and provide results.
Software Interface
The EPICS IOC for the wire scanner subsystem contains several EPICS records.
WIRE:<area>:<position>:
Function |
Potential Values |
CANCEL |
true,false |
START |
true,false |
STOP |
true,false |
STATE |
working,cancelled,successful,ready |
AXES |
XYU,XY,XU,X,YU,Y,U |
POSSTART |
numeric, microns |
POSSTOP |
numeric, microns |
SPEED |
numeric, microns/sec |
CURSPEED |
numeric, microns/sec |
NORMALIZECURRENT |
true,false |
TOROIDSTOUSE |
"TORO:IN20:621","TORO:IN20:622","TORO:IN20:623" |
NORMALIZECENTROID |
true,false |
BPMSTOUSE |
"BPMS:IN20:621","BPMS:IN20:622","BPMS:IN20:623" |
PMTLIST |
"WPMT:IN20:621","WPMT:IN20:622","WPMT:IN20:623" |
COMBINEPMTS |
true,false |
YDATARAW |
x1,y1,x2,y2,... |
XDATARAW |
x1,y1,x2,y2,... |
UDATARAW |
x1,y1,x2,y2,... |
YDATA |
x1,y1,x2,y2,... |
XDATA |
x1,y1,x2,y2,... |
UDATA |
x1,y1,x2,y2,... |
HASWIRES |
XYU,XY,XU,X,YU,Y,U |
PERCENTCOMPLETE |
string "50.0%" |
XSIGMA |
numerics XX.XXe+X,+- YY.YYe-YY |
XFWHM |
numerics XX.XXe+X,+- YY.YYe-YY |
XMEAN |
numerics XX.XXe+X,+- YY.YYe-YY |
XASYM |
numerics XX.XXe+X,+- YY.YYe-YY |
XRMSERR |
numerics XX.XXe+X,+- YY.YYe-YY |
XWIDTH |
numerics XX.XXe+X,+- YY.YYe-YY |
XAREA |
numerics XX.XXe+X,+- YY.YYe-YY |
YSIGMA |
numerics XX.XXe+X,+- YY.YYe-YY |
YFWHM |
numerics XX.XXe+X,+- YY.YYe-YY |
YMEAN |
numerics XX.XXe+X,+- YY.YYe-YY |
YASYM |
numerics XX.XXe+X,+- YY.YYe-YY |
YRMSERR |
numerics XX.XXe+X,+- YY.YYe-YY |
YWIDTH |
numerics XX.XXe+X,+- YY.YYe-YY |
YAREA |
numerics XX.XXe+X,+- YY.YYe-Y |
USIGMA |
numerics XX.XXe+X,+- YY.YYe-YY |
UFWHM |
numerics XX.XXe+X,+- YY.YYe-YY |
UMEAN |
numerics XX.XXe+X,+- YY.YYe-YY |
UASYM |
numerics XX.XXe+X,+- YY.YYe-YY |
URMSERR |
numerics XX.XXe+X,+- YY.YYe-YY |
UWIDTH |
numerics XX.XXe+X,+- YY.YYe-YY |
UAREA |
numerics XX.XXe+X,+- YY.YYe-YY |
HVSETTING |
Numeric |
BEAMTYPE |
binary 32 bit  |
Figure 13. EPICS Records Used in Wire Scanner Instrumentation
Timing System Interface
The wire scanners must interact with the timing system. Details forthcoming.
Machine Protection System Interface
The wire scanners need interact with the MPS only to learn whether the beam is enabled or disabled, and if there are any obstructions in the beamline upstream.
Beam Position Monitor Interface
The wire scanner software will use the BPM devices to normalize the beam jitter, on a pulse-by-pulse basis. Specifically, if the beam center drifts in some axis, the software will shift the measured position of the wire to compensate. This feature is optional for the user, and is also undoable; the user may elect to view the data after the scan with BPM correction turned on, and then again with it turned off.
Details of the API for BPM data access are forthcoming. Ideally, the BPM subsystem will provide a means by which a certain number of consecutive uniquely identified beam pulses can be measured, and then retrieved as an array of values. Each value will have a time stamp.
Toroid Beam Current Monitor Interface
The wire scanner software will use the toroid devices to normalize the beam current, on a pulse-by-pulse basis. Specifically, if the measured beam current changes from one beam pulse to the next, the measured integrated charge will be adjusted to compensate for that. This feature is optional for the user, and is also undoable; the user may elect to view the data after the scan with toroid correction turned on, and then again with it turned off.
Details of the API for toroid data access are forthcoming. Ideally, the toroid subsystem will provide a means by which a certain number of consecutive uniquely identified beam pulses can be measured, and then retrieved as an array of values. Each value will have a time stamp.
Network Interface
Each wire scanner subsystem will interact via the Control System Network. Details of the interaction are described with the EPICS System Documentation.
Internal Interfaces
The device interfaces for each of the wire scanner's constituent hardware devices are described in the corresponding hardware product manuals.
Interaction with the mechanical subassembly follows the Engineering Specification described in an accompanying document, the Wire Scanner Mechanical Engineering Specifications Document 1.3-105.
Deployment
There will be 19 wire scanners deployed for the LCLS, as shown in Table 1. The DL1 area refers to the injection line, where it makes 2 bends to join into the main Linac. The LI21 through LI28 areas are Linac Sectors 21 through 28. The LTU refers to the Linac-to-Undulator region.
The numbers in italics refers to existing wire scanners that require new electronics.
Area |
DL1 |
LI21 |
LI24 |
LI27 |
LI28 |
LTU |
Total |
Wire Scanners |
4 |
3 |
4 |
1 |
3 |
4 |
19 |
Table 1. Location of Existing and New Wire Scanners
Equipment Required For Each Wire Scanner
The following equipment will be used for each wire scanner, although some elements may be shared. One set of instrumentation can drive up to 8 motors, and read up to 8 PMTs or Gas Ionization Chambers.
Electronics
- Dawn model 3800 5-slot VME Chassis, 3U in height.
- Motorola MVME6100 Processor, at least 512 Mb memory, for the IOC.
- Hytec Model VICB8002 Industry Pack VME Carrier Card.
- Hytec Model 8601 Industry Pack (IP) 4-channel motor controller. Two of these cards can be used to control 8 motors from one IOC.
- Hytec Model SMDS4 external stepping motor driver, with power supply, typically 50 ohms at 24 VDC.
- High Voltage Power Supply with VME-based control module.
- Digital I/O for High Voltage on/off and status.
- Highland Model V550 VME based LVDT readout module.
- CAEN Model V965 Charge-integrating ADC (QDC) with external trigger.
- Beam Trigger Event Receiver (EVR)
Additionally, the following elements will be needed for each PMT detector.
- Preamp and electronics to translate signal from PMT, suitable for ADC input levels
- Photomultiplier Tube (PMT) with adequate characteristics to measure bremsstrahlung radiation.
- Base to house PMT, and provide connections for high voltage and analog signal readout.
Rack Allocation and Layout
The general layout of equipment with assigned rack space requires 19 Units of vertical space, including a single Unit height space for cable feed, which has a total of 35 inches. This is the worst-case scenario, and will support a system that can accommodate 8 drive motors and 16 PMTs or Ionization chambers.
Ideally, we will be able to reduce those requirements by at least 2U for the LVDT Electronics, and possibly by another 3U for the Motor Resistor Chassis, required for Unipolar stepping motor control. Bipolar motor control does not require this chassis, but are not able to drive cables of lengths which can be driven by Unipolar motor controls.
The racks will be located in the appropriate sections of the Klystron Gallery and surface buildings above the LTU area, including Buildings 106, 105, and/or 406. 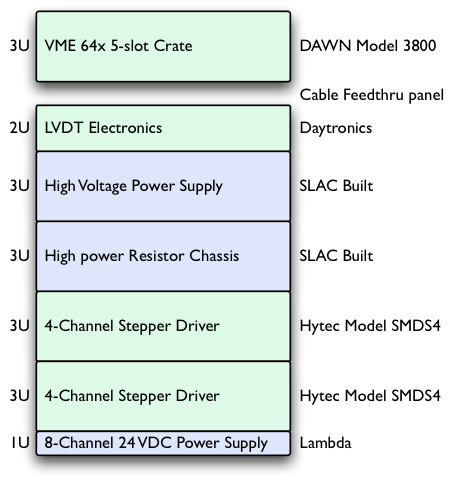 Figure 14. Rack Space for Wire Scanner Instrumentation.
Risks and Mitigation
The beam arrives in bunches between 8.3 and 100 milliseconds apart. Each beam bunch will be on the order of 100 femtoseconds (100_10-15 seconds) in duration.
If the total range of motion is 63.5 mm (~2 inches).
The normalization algorithm mentioned above is addressing the risk of pulse-to-pulse beam jitter. It will use BPM data.
The risk of mechanical frame jitter is addressed by a new shorter design of the wire mounting assembly and a shorter travel distance, described in the Mechanical Engineering Specifications Document 1.3-105.
There is also risk of beam current drift over a short time period, addressed by the current normalization algorithm described above, which uses toroid measurements.
Safety and Hazard Analysis
Each PMT and Ionization Chamber requires high voltage, up to 1.6 kV. Ideally, an external high voltage power supply will be used.
An option exists to use a VME-based HV module, which requires extra precaution.