Looking at PingER daily Inter Packet Delay Variation (IPDV) measured from SLAC to hosts around the world we frequently see spikes in IPDV lasting for just a day. Here we investigate some of these spikes in more detail. In particular, we are interested in seeing whether such spikes may be related to route changes between SLAC and the target host.
PingER Recorded data
PingER runs every 30 minutes sending 100Byte pings at a rate of one/second to each target until 10 are responded to or 30 are sent (whichever comes first) it then repeats this for 1000 Byte pings. The recorded data are of the form seen below (the format is described at PingER Monitor node format).
pinger.slac.stanford.edu 134.79.104.80 www-05.nexus.ao 41.221.254.23 100 1583911092 10 10 290.467 311.022 328.696 1 2 3 4 5 6 7 8 9 10 325 310 321 328 318 296 305 290 294 319
pinger.slac.stanford.edu 134.79.104.80 www-05.nexus.ao 41.221.254.23 1000 1583911102 10 10 302.750 315.344 326.889 1 2 3 4 5 6 7 8 9 10 312 309 302 312 304 323 324 314 326 322
pinger.slac.stanford.edu 134.79.104.80 www-05.nexus.ao 41.221.254.23 100 1583912777 11 10 315.680 3284.614 7524.609 1 2 5 3 4 6 7 8 9 11 340 315 5524 7524 6524 4545 3575 2575 1594 326
pinger.slac.stanford.edu 134.79.104.80 www-05.nexus.ao 41.221.254.23 1000 1583912788 11 10 311.455 927.884 3323.729 1 2 3 4 5 6 7 8 9 10 330 331 311 330 332 331 327 3323 2330 1330
pinger.slac.stanford.edu 134.79.104.80 www-05.nexus.ao 41.221.254.23 100 1583914686 10 10 307.451 323.349 331.896 1 2 3 4 5 6 7 8 9 10 328 328 307 321 331 327 328 308 322 328
pinger.slac.stanford.edu 134.79.104.80 www-05.nexus.ao 41.221.254.23 1000 1583914696 11 10 314.242 323.307 333.987 1 2 3 4 5 7 8 9 10 11 314 329 320 324 333 315 314 327 329 322
The time of each measurement is given as Unix GMT Epoch time (e.g. 1583912777 = Wed Mar 11 2020 7:46:16). The measurement above at timestamp 1583912777 shows a wide divergence in the 10 Round Trip Times (RTTs) with values: 340 315 5524 7524 6524 4545 3575 2575 1594 326 msecs and a lost packet (note the missing ping number 10 in the sequence 1 2 5 3 4 6 7 8 9 11, as well as the out of order packets).
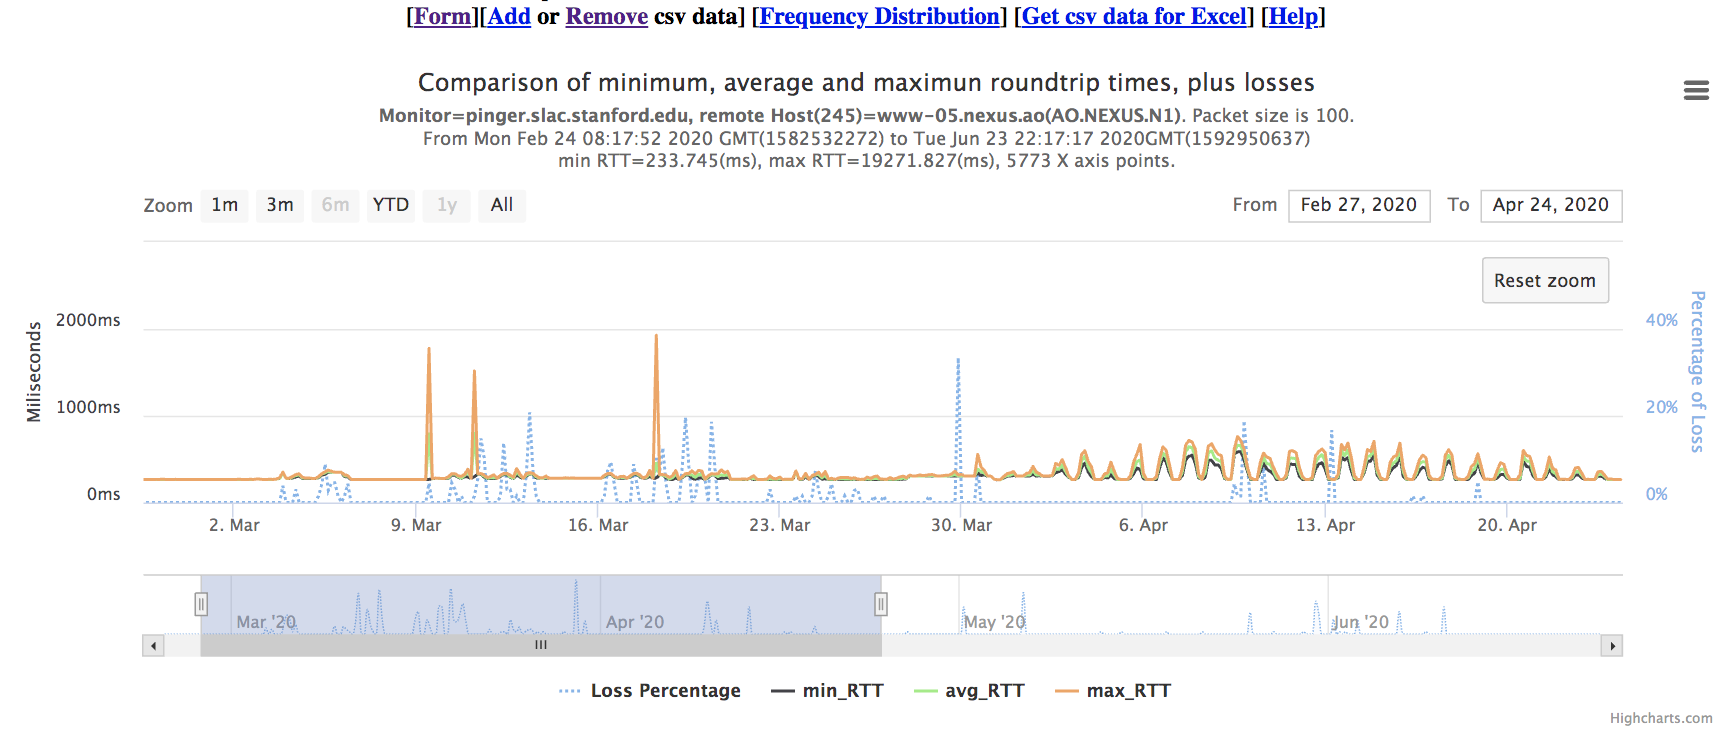
If one plots the minimum-RTT, average-RTT and maximum-RTT and % loss for the measurements made for 100Byte pings one gets the plot below. The measurement recorded at timestamp 1583912777 is:
Epoch_time,m/dd/yyyy h:mm,min_rtt,avg_rtt, max_rtt, % loss
1583912777,3/11/2020 7:46,315.680,3284.614,7524.609,9.09090909090909
and similarly for 1000 Byte pings:
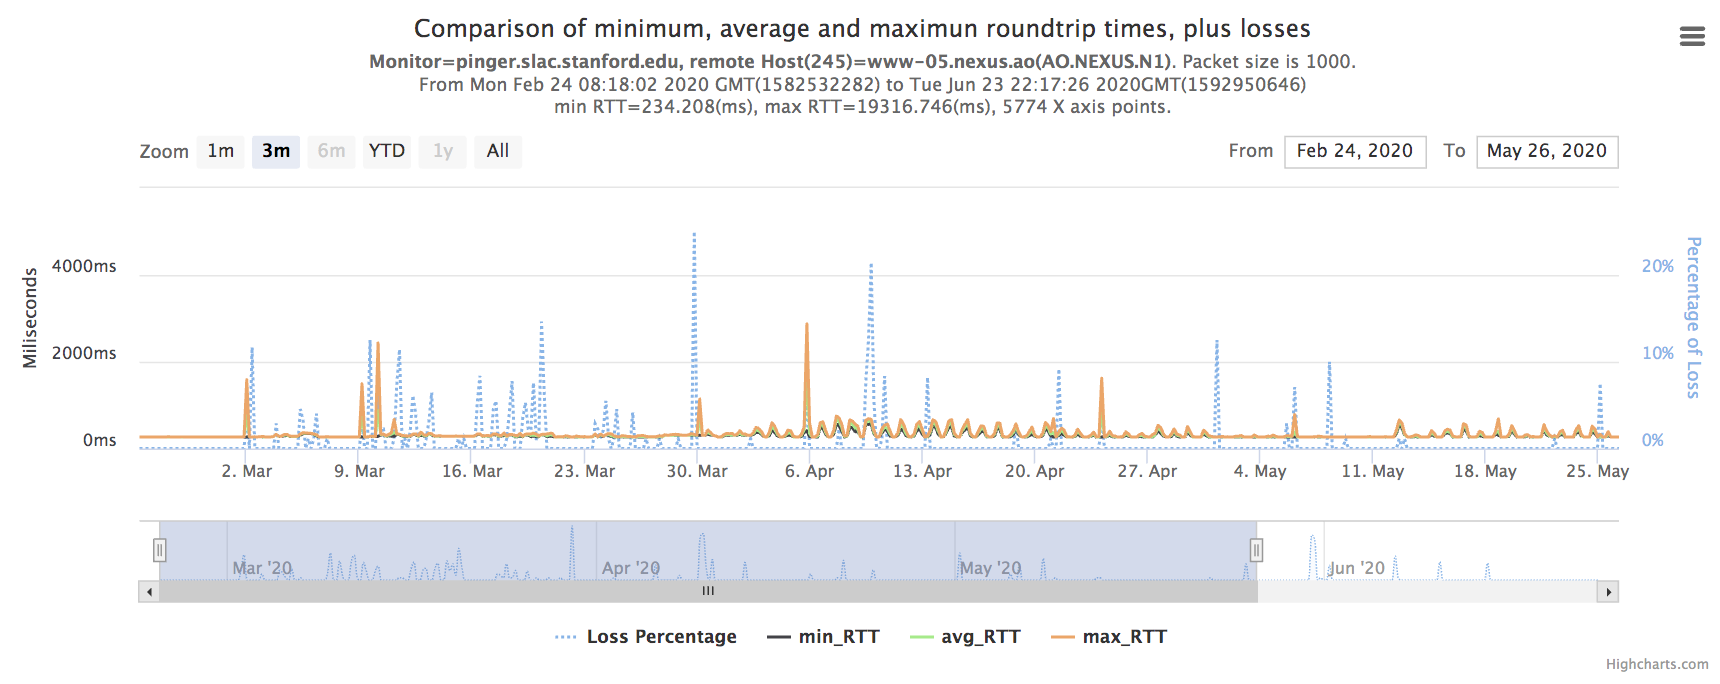
The question then is whether the large spikes in the RTTs (seen for example above for 100Byte pings on Mar 9 (12:18pm), Mar 11 (07:46am) and Mar 18 (07:47am) ) are related to a route change. There are similar spikes (not shown here) for 100Byte pings on June 1 (06:17am), and June 3 (07:18am).
Route change tool
On a daily base at 7:00am each morning PingER records the route from SLAC to each target host using the traceroute tool. The job takes about 1.5 hours to run. This data can then be examined using the https://www.slac.stanford.edu/cgi-bin/traceroutearchive.cgi web traceroute comparison tool that allows one to select the target host and compare the traceroutes hop by hop for 3 different dates.
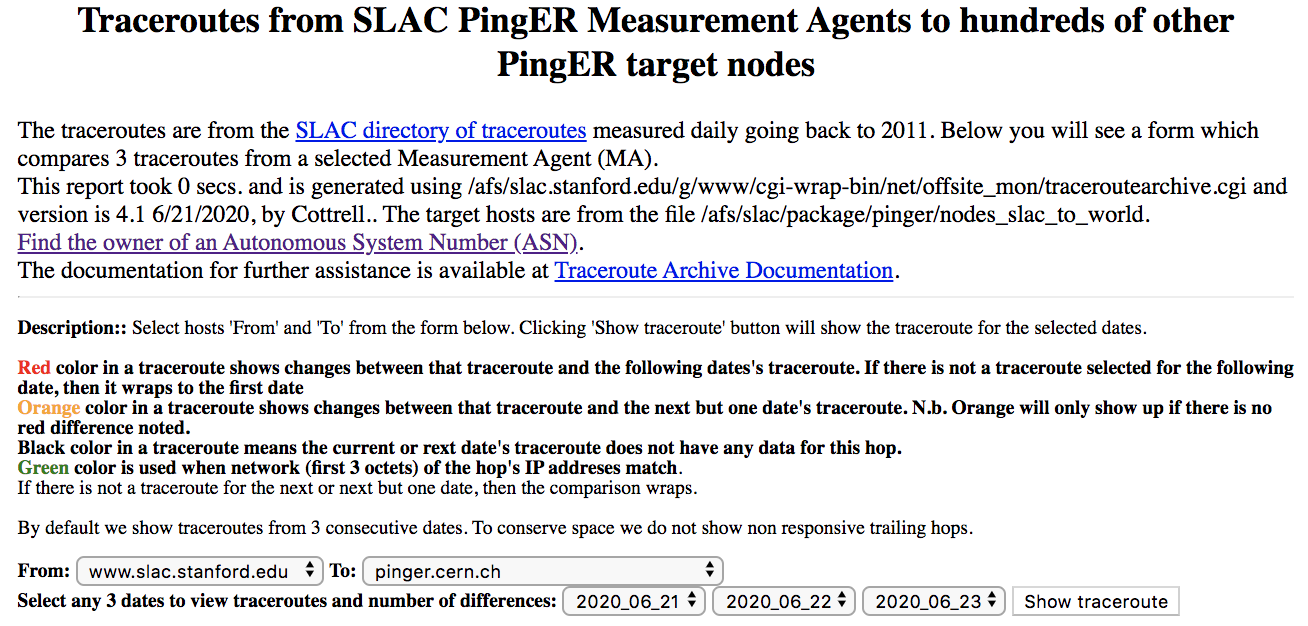
For the record, the traceroute comparison tool displays the following for the three date sets above for www-05.nexus.ao
| Mar 8, 9, 10 | Mar 10, 11, 12 | Mar 17, 18, 19 |
|---|---|---|
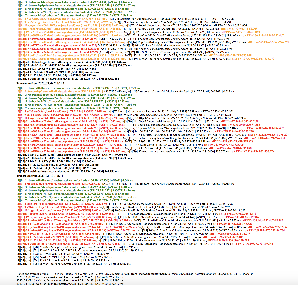 | 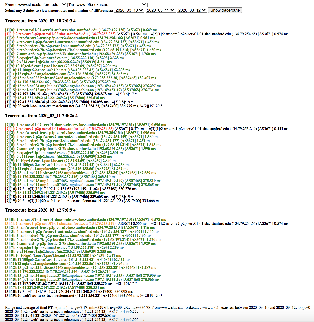 | 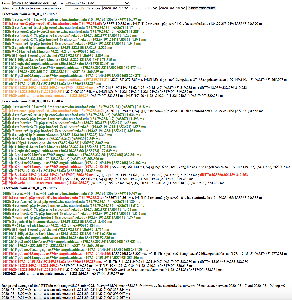 |
Reviewing each of these in more detail:
- Mar 8, 9, 10:
- Up to and including hop 13 the Mar 8 and 9 traceroutes are very similar (apart from a different load balanced router at hop 2)
- For hops 14 thru hop 22 the Mar 8 and 9 traceroutes are on the same AS174 (COGENT) before switching to AS17000 at hop 23.
- The Mar 10 traceroute is very different from Mar 8 and 9 starting at hops 8 and 9. from hop 9 onwards Mar 10 route goes via AS6939 (Hurricane Electric), AS46841 (FORKNETWORKING), AS5773 (LAMBEAU-TELECOM), AS37468 (Angola cables), AS174 (COGENT) and AS17400 (EBONET)
- The time for the overall RTTs is similar for Mar 8 and 9 (266 and 265 msec) but is 336msec for
- Mar 10,11,12
- The three traceroutes are roughly identical apart from the RTTs (and of course the load-balanced routers at hop 2).
- This time the overall RTTs for the three dates are within 7 msecs of each other.
- Mar 17, 18, 19
- Up to and including hop 15 the routes for the 3 dates are identical apart from the RTTs and of course the load-balanced routers at hop 2.
- On the other hand the RTT for Mar 18 at hops 11-15 is roughly 75 msec greater than for Mar 17 and Mar 19.
- At hop 18 there is a change of carrier from AS17400 (EBONET) for Mar 17, 18 to AS 37468 (Angola Cables) for Mar 10.
- The overall time for Mar 17 and 19 is 25-35 msec greater than for Mar 18 (295msec).