"South Africa detected its first novel coronavirus infection on 5 March. For the next few weeks, the epidemic followed an exponential curve similar to those in the United Kingdom, the United States, and many other countries. On 15 March, the country’s president, Cyril Ramaphosa, declared a national state of emergency banning visitors from high-risk countries, stopping large gatherings, closing more than half of its land borders, and shutting schools. On 27 March the country started a 21-day lockdown, closing all borders and confining everyone except those performing essential services to their homes except to buy groceries and medicine or to collect welfare payments." Science Magazine.
PingER
We used the PingER IPDV daily data for the last 365 days. It includes measurements from the SLAC host pinger.slac.stanford.edu in Northern California (Lat, Long =37.4177, -122.2035) to 7 hosts in South Africa.
| www.nmmu.ac.za, Port Elizabeth | bontany.uwc.ac.za, Cape Town | www.dut.ac.za, Durban | http://www.museumsnc.co.za./, Kimberley | www.ru.ac.za, Grahamstown | sagrid.ac.za,? | brunsvigia.tenet.ac.za, Cape Town |
Since there are large differences between weekday and weekend performance responses, we selected just the weekday (determined by UDT) measurements and smoothed the data using a sliding average over the last 5 days. The chart below shows the result (the 25 percentile, median and 75 percentiles for the 7 hosts) together with South Africa's Covid-19 confirmed cases from Johns Hopkins University's GitHub site: https://github.com/CSSEGISandData/COVID-19, plus the dates of notable interventions taken by South Africa.
It is seen that the 75 percentile shows a notable increase at the time of the interventions
According to https://en.wikipedia.org/wiki/COVID-19_pandemic_in_South_Africa on 5 March 2020, Minister of Health Zweli Mkhize confirmed that the virus spread to South Africa, with the first known patient being a male citizen who tested positive upon his return from Italy. On 15 March, the President of South Africa, Cyril Ramaphosa, declared a national state of disaster. On 23 March, a national lockdown was announced, starting on 26 March 2020. Ramaphosa announced that from 1 May 2020, a gradual and phased easing of the lockdown restrictions would begin.
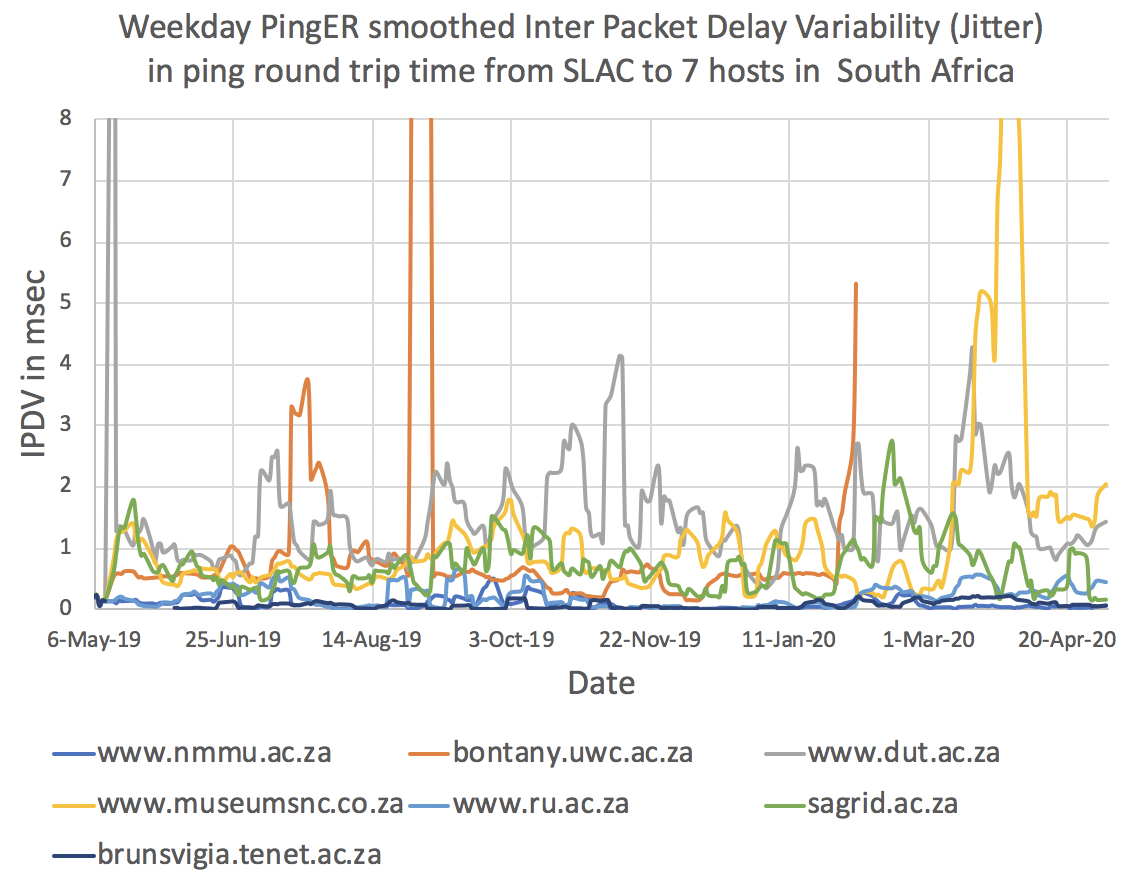
We then looked in more detail at the IPDVs for the individual hosts. See below.
It is seen that the major contributor to the rise in IPDV is www.museumsnc.co.za, followed by www.dut.ac.za. The bontany.uwc.ac.za is no longer accessible. The other hosts are connected to the South African Tertiary Education Network (TENET). That, in turn, connects directly to ESnet that connects SLAC to the Internet thus avoiding any commodity networks. ESnet supports the Energy Sciences in the US and is well provisioned. TENET supports tertiary academic and research establishments in South Africa. It is a well provisioned network that is probably lightly loaded on average, thus changes in traffic volumes (e.g. due to lockdown) have little effect.
Both www.museumsnc.co.za and www.dut.ac.za traverse commodity networks after leaving ESnet and are thus less likely to be over-provisioned and more sensitive to unplanned or increases in traffic load. For example, a traceroute for www.museumsnc.co.za leaves the ESnet network at Sunnyvale near SLAC to join the Equinix network, followed by the PCCW Inc. network, followed by Afrihost in South Africa.
Traceroute from SLAC to www.museumsnc.co.za from SLAC |
|---|
Wed May 6 12:29:15 2020: executing exec(traceroute -m 30 -q 1 -w 1 -A 154.0.166.162 140)=traceroute 16 gm-colo3-core2-lq.aserv.co.za (169.1.21.187) [AS37611] 317.722 ms |
Countries bordering South Africa
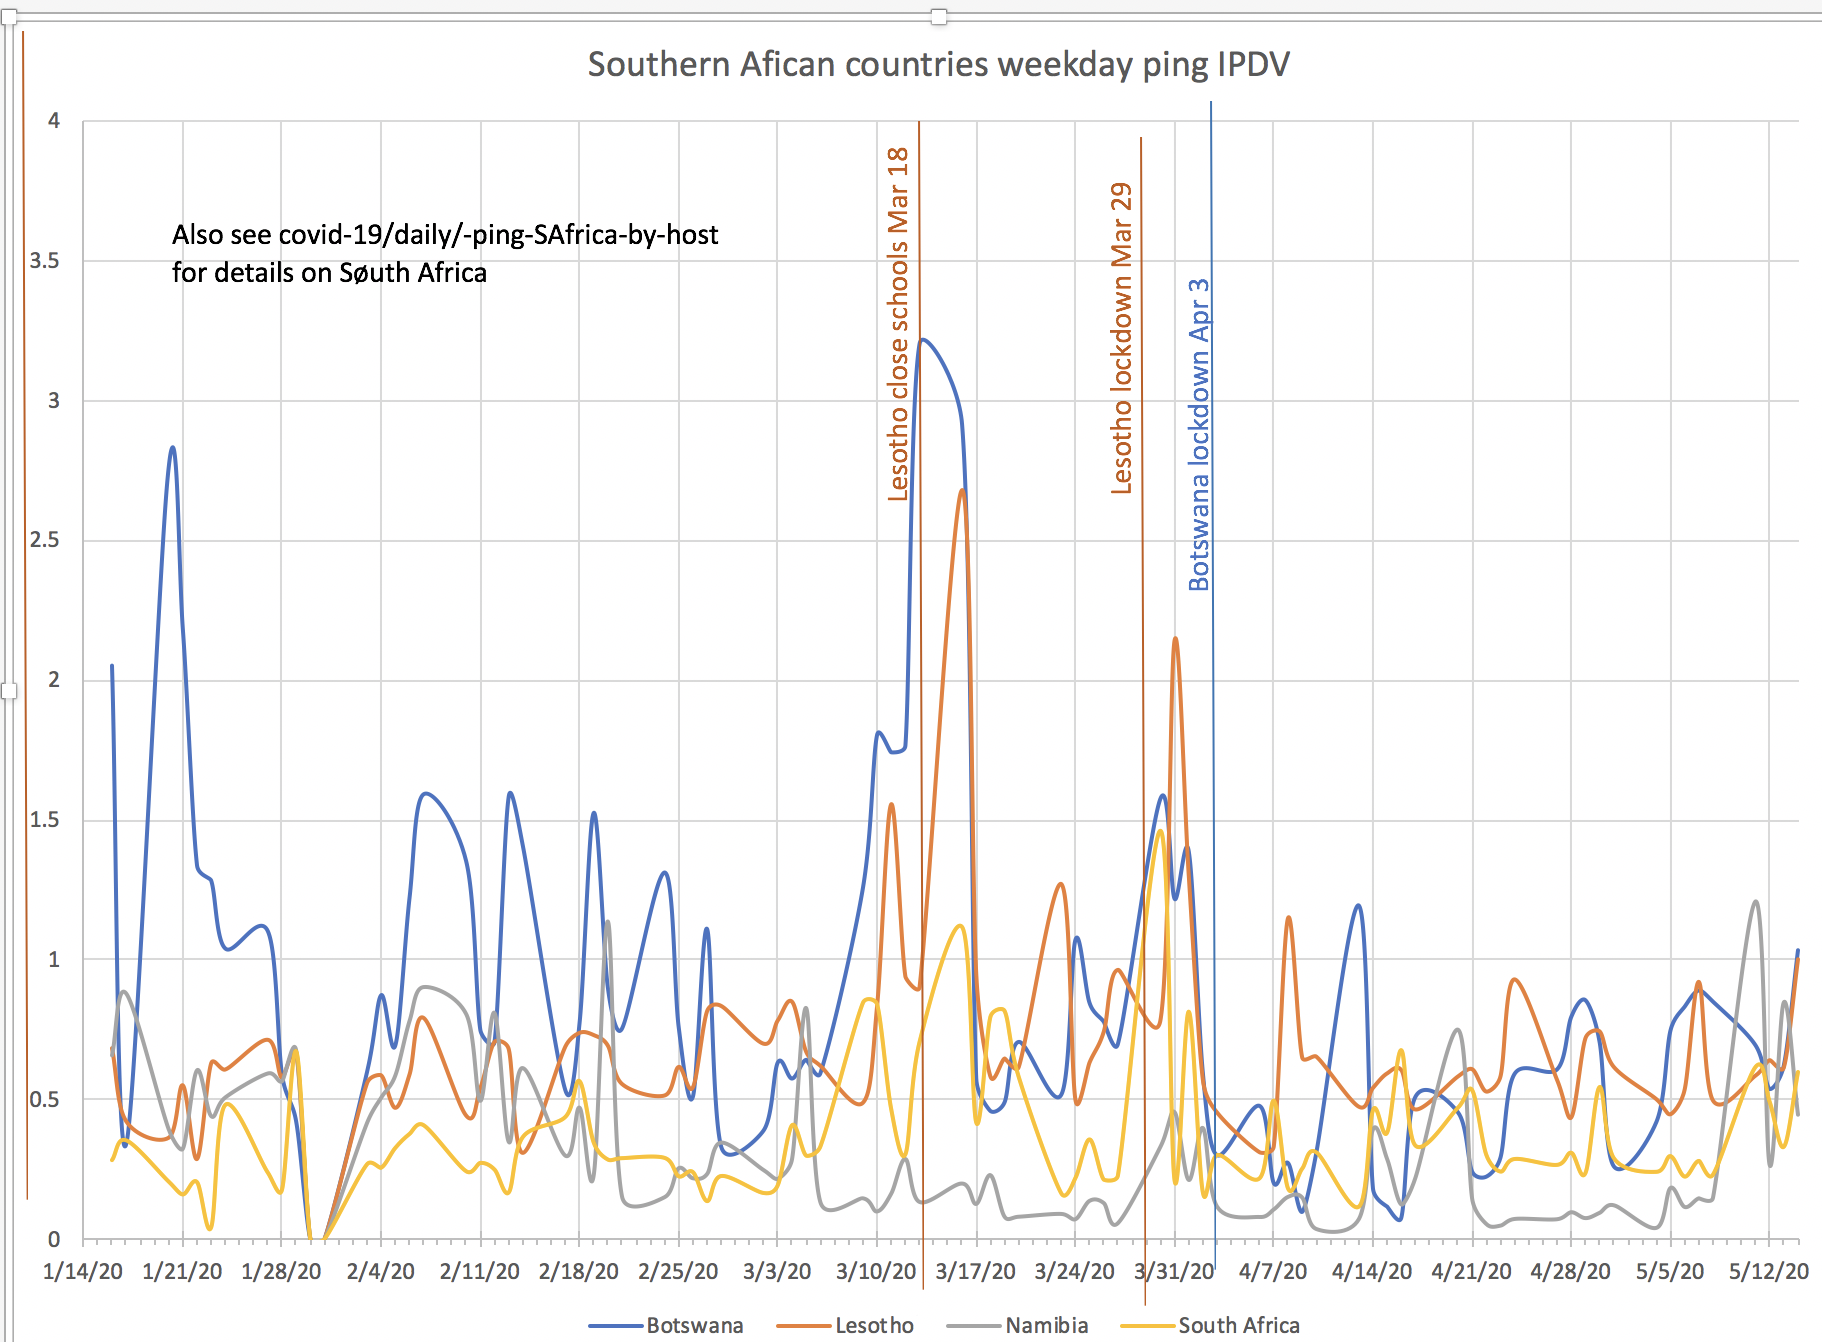
A possibility explored was just selecting hosts in the 6 countries bordering and including South Africa (TLDs BW, LS, SZ, ZA, ZW) and then just using hosts with TLDs .co, .com, .go, .gov or including banc or bank in the name. The ideas was that such hosts are probably on commodity networks. However as of May 5th, 2020 these countries have few Covid-19 cases (BW:23, LS: 0, NA 101, SZ (Eswatine): 145, ZA: 218,329, ZW:34). As expected we could not identify a significant impact of Covid-19 on IPDV.
Useful other documents
Coronavirus-free Lesotho relaxes lockdown restrictions, 5/6/2020
Covid-19 9n Africa, from The Center For Disease Dynamics, Economics & Policy


