Remarks on the analysis
Using only well reconstructed events : TkrNumTracks=1
Taking recontructed vertex variables : VtxX0, VtxY0, VtxXDir, VtxYDir
All parameters derived from runs at 0 degree : Mean is the value to put in the Monte Carlo
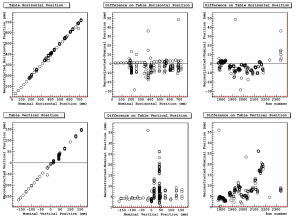
SPS Table Position - global values
Table position statistics : Mean
*Average Horizontal Offset (mm) : -2.4
*Average Vertical Offset (mm) : 7.8
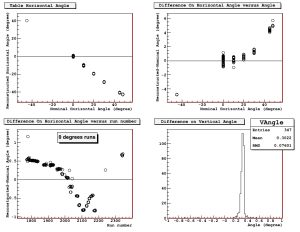
SPS Table Angle - global values
Table Angle statistics : Mean
*Average Horizontal Angle Offset (deg) : 0.12
*Average Vertical Angle Offset (deg) : 0.31
Detailed Analysis of Electron runs
Runs excluded from the list
+ all before 1773 : first tests
+ 1795 : database pb
+ 2025-2026-2028-2029-2335-2171-2066-1970-1968 : pedestal
+ 1984-2042-2340-2341-1888-1914-1915-1918-1789-1927-2168-2169 : crack
+ 2027-2030 : Trigger Engine
+ 2035 : moving slits
+ 1963-2163-2238-2247-1962-2061-1955-1969 -1779-1780-1781: Junk
+ 2136-2137-2138-2139 : special runs
+ 1971-1972-1973-1974-2246 : self-trigger
Results
all positions in millilemeters and all angles in degree.
Position and Angle values correspond to systematic differences determined using runs at 0 degree : RECONSTRUCTED - EXPECTED
|
|
BEAM RMS |
|
Position |
|
Angle |
|
|
PLOTS |
|
|
Momentum |
run |
Hori. |
Vert. |
Hori. |
Vert. |
Hori. |
Vert. |
Notes |
Beam |
Angle |
Position |
10 |
all |
4.6 |
5.2 |
7.5 |
8.3 |
0.7 |
0.3 |
few runs |
|||
20 |
all |
3.1 |
5.1 |
|
|
|
0.32 |
|
|||
|
2082->2086 |
|
|
-10.3 |
8.4 |
-0.69 |
|
|
|
|
|
|
2103->2113 |
|
|
-3.8 |
8.4 |
-0.82 |
|
|
|
|
|
|
2162->2166 |
|
|
-0.7 |
20.6 |
-0.42 |
|
|
|
|
|
|
2170->2180 |
|
|
-0.64 |
20.6 |
-0.83 |
|
|
|
|
|
|
|
|
|
|
|
|
|
|
|
|
|
50 |
all |
2.6 |
3.4 |
|
|
-0.45 |
0.28 |
|
|||
|
run<2043 |
|
|
|
|
-0.20 |
|
|
|
|
|
|
run<2060 |
|
|
-5.0 |
7.3 |
|
|
|
|
|
|
|
2060->2080 |
|
|
-7.0 |
7.3 |
|
|
|
|
|
|
|
2153->2159 |
|
|
1.7 |
16.3 |
|
|
|
|
|
|
|
|
|
|
|
|
|
|
|
|
|
|
100 |
all |
1.6 |
2.6 |
|
|
|
0.33 |
|
|||
|
run<1860 |
|
|
2.5 |
4. |
0.5 |
|
|
|
|
|
|
1980->2025 |
|
|
-2. |
5. |
0.88 |
|
|
|
|
|
|
2143->2146 |
|
|
1.8 |
17. |
-0.5 |
|
|
|
|
|
|
|
|
|
|
|
|
|
|
|
|
|
200 |
all |
4.1 |
3.7 |
|
0.47 |
|
0.32 |
|
|||
|
run<1920 |
|
|
-3. |
|
0.39 |
|
|
|
|
|
|
2031->2034 |
|
|
-9. |
|
-0.25 |
|
|
|
|
|
|
2239->2245 |
|
|
6. |
|
0.23 |
|
|
|
|
|
|
|
|
|
|
|
|
|
|
|
|
|
280 |
all |
8.5 |
8.8 |
-7.1 |
7.2 |
|
0.30 |
Large dispersion on Position |
|||
|
1917->1931 |
|
|
|
|
0.4 |
|
|
|
|
|
|
1952->1967 |
|
|
|
|
0.3 |
|
|
|
|
|
|
2126->2129 |
|
|
|
|
-0.7 |
|
|
|
|
|
One can dowload a ps file with Beam spots for all the SPS electron runs here : ALL PLOTS