Motivation
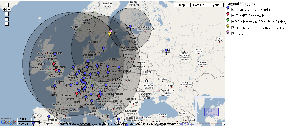
The main purpose of TULIP Web based visualization is to provide Visualization for TULIP. It is an alternative visualization to the older Java JNLP Visualization. The advantage of using this visualization is that it does not require the client to install Java and can be run from a standard web browser and it provides a more detailed zoom in functionality. Below is an example when we tried to locate www.kth.se .
The three landmarks chosen in case of trilateration were Helsinki-Finland 8 ms, Karlskrona-Sweden 14ms, Amsterdam-Netherlands 24ms.
The four landmarks chosen in case of Multilateration were Helsinki-Finland 8 ms, Karlskrona-Sweden 14ms, Amsterdam-Netherlands 24ms and Germany 27ms.
Deployment
It is a CGI-Script which is deployed at /afs/slac.stanford.edu/g/www/cgi-wrap-bin/net/shahryar/tulip-viz.cgi. It can be accessed from the web via http://www-wanmon.slac.stanford.edu/cgi-wrap/tulip-viz.cgi?target=<TARGET>
where <TARGET> is the IP address or domain name that you want to locate. It is also linked from TULIP main page.
Security Considerations
It uses the -w and -T (taint) options, plus use strict, all open and closes have a die associated, the system command uses the 3 paramter version,
Google Maps
The Google Map is deployed at /afs/slac.stanford.edu/www/comp/net/wan-mon/viper/tulip_map.html
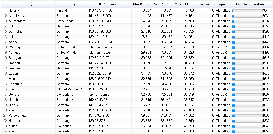
Table (Google Visualization)
The table is deployed at /afs/slac.stanford.edu/www/comp/net/wan-mon/viper/test_table.html
This tables used Google Visualization API See Google Visualization API for details.
<html>
<script type="text/javascript" src="http://www.google.com/jsapi"> </script>
<script type="text/javascript">
google.load("visualization","1",{packages: \['table'\]});
var data;
var table;
var count=0;
var formatter;
function drawTable() {
data = new google.visualization.DataTable();
data.addColumn('string', 'City');
data.addColumn('string', 'Country');
data.addColumn('string', 'IP Address');
data.addColumn('number', 'Min RTT');
data.addColumn('number', 'Avg RTT');
data.addColumn('number', 'Max RTT');
data.addColumn('number', 'Loss (%)');
data.addColumn('string', 'Type');
data.addColumn('number', "Est. Distance (km)");
table = new google.visualization.Table(document.getElementById('table_div'));
formatter = new google.visualization.TableBarFormat({width: 120});
formatter.format(data, 8); // Apply formatter to 9th column
table.draw(data, {allowHtml: true,showRowNumber: true});
}
function addRow(city,country,ip,min_rtt,a_rtt,max_rtt,loss,type,distance){
var dist = parseInt(distance);
data.addRows(1);
data.setCell(count, 0, city);
data.setCell(count, 1, country);
data.setCell(count, 2, ip);
data.setCell(count, 3, parseFloat(min_rtt), min_rtt);
data.setCell(count, 4, parseFloat(a_rtt), a_rtt);
data.setCell(count, 5, parseFloat(max_rtt), max_rtt);
data.setCell(count, 6, parseFloat(loss), loss);
data.setCell(count, 7, type);
data.setCell(count, 8, dist,dist);
formatter.format(data, 8); // Apply formatter to 9th column
table.draw(data, {allowHtml: true,showRowNumber: true});
count++;
}
</script>
<body>
<div id="table_div">
</div>
<script>
drawTable();
</script>
The important method over here is addRow(). It is called from the Java Class GetPingDataPL.java This class spits out the Java Script calls of the format:
<script>addRow('Princeton','"United States"','128.112.139.80',' 81.010','81.5899','82.592',' 0','PlanetLab','4050.5');</script>
<script>addRow('Boston','"United States"','204.8.155.227',' 77.131','79.8392','81.611',' 0','PlanetLab','3856.5498046875');</script>
<script>addRow('Provo','"United States"','128.187.223.212',' 30.673','31.1793','31.722',' 0','PlanetLab','1533.6500244140625');</script>
<script>addRow('Atlanta','"United States"','143.215.129.117',' 69.584','70.0512','70.590',' 0','PlanetLab','3479.199951171875');</script>
<script>addRow('Vancouver','Canada','206.12.16.155',' 11.231','11.4789','11.688',' 0','PlanetLab','561.5499877929688');</script>
<script>addRow('Houston','"United States"','208.117.131.116',' 84.476','84.9645','85.390',' 0','PlanetLab','4223.7998046875');</script>
<script>addRow('Kwangju','"Korea Rep"','210.125.84.15',' 164.529','165.0591','165.930',' 0','PlanetLab','8226.4501953125');</script>
<script>addRow('Durham','"United States"','152.3.138.5',' 86.711','86.9308','87.292',' 0','PlanetLab','4335.5498046875');</script>
Java Code
The java code is kept at /afs/slac.stanford.edu/package/pinger/tulip/src/tulip
|-- core
| |-- AutomateTest-08-20-2008
| |-- AutomateTest-10-11.tier
| |-- AutomateTest-1stResearchPaper
| |-- AutomateTest-25-07
| |-- AutomateTest-backUp-07-22.txt
| |-- AutomateTest-backUp-09-10
| |-- AutomateTest-sh.backup
| |-- AutomateTest-with-Viz
| |-- AutomateTest-withnewalgo-notiering
| |-- AutomateTest.
| |-- AutomateTest.bac
| |-- AutomateTest.final
| |-- AutomateTest.java
| |-- AutomateTest.java.old
| |-- AutomateTest.testall
| |-- AutomateTest.v1
| |-- AutomateTest_all_landmarks
| |-- GetPingDataPL-08-27-2008
| |-- GetPingDataPL.java
| |-- Locate-11-3-2008
| |-- Locate.1.0
| |-- Locate.bak
| |-- Locate.java
| |-- LocateMe.bak
| |-- LocateMe.java.bak
| |-- LocateMe10-30-08.back
| `-- PhysicalDistance.java
`-- util
|-- AnalyzeLog.java
|-- Conversions.java
|-- CreateElllipsoid.java
|-- GetGeoIPData.java
|-- Haversine.java
|-- JScience.java.bak
|-- LatLngToXYZ.java
|-- LatLontoXY.java
|-- Normalize.java
|-- PingParser.java
|-- Point.java
|-- SAXParserTulip.java
|-- Sites.java
|-- XYZToLatLng.java
|-- XYtoLatLon.java
|-- sites.xml
`-- test.java.bak
Problems
If the RTT > ~127ms the circle cannot be plotted. 127 * 50(alpha) ~= 6357 Km which is the radious of the earth.