Motivation
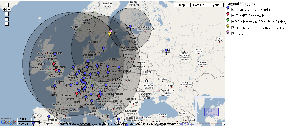
The main purpose of TULIP Web based visualization is to provide Visualization for TULIP. It is an alternative visualization to the older Java JNLP Visualization. The advantage of using this visualization is that it does not require the client to install Java and can be run from a standard web browser and it provides a more detailed zoom in functionality. Below is an example when we tried to locate www.kth.se .
The three landmarks chosen in case of trilateration were Helsinki-Finland 8 ms, Karlskrona-Sweden 14ms, Amsterdam-Netherlands 24ms.
The four landmarks chosen in case of Multilateration were Helsinki-Finland 8 ms, Karlskrona-Sweden 14ms, Amsterdam-Netherlands 24ms and Germany 27ms.
Deployment
It is a CGI-Script which is deployed at /afs/slac.stanford.edu/g/www/cgi-wrap-bin/net/shahryar/tulip-viz.cgi. It can be accessed from the web via
http://www-wanmon.slac.stanford.edu/cgi-wrap/tulip-viz.cgi?target=<TARGET>
where <TARGET> is the IP address or domain name that you want to locate. It is also linked from TULIP main page.
Usage
These parameters are provided in QUERY_STRING target = [IP | name] debug=<level> function= [xml | error | log | help]
Examples:
- http://www-wanmon.slac.stanford.edu/cgi-wrap/tulip-viz.cgi?target=134.79.16.9
- http://www-wanmon.slac.stanford.edu/cgi-wrap/tulip-viz.cgi?target=www.cern.ch
- http://www-wanmon.slac.stanford.edu/cgi-wrap/tulip-viz.cgi?target=www.cern.ch&function=xml returns the XML file for www.cern.ch if it exists
- http://www-wanmon.slac.stanford.edu/cgi-wrap/tulip-viz.cgi?function=help returns the help file
- http://www-wanmon.slac.stanford.edu/cgi-wrap/tulip-viz.cgi?function=error returns the error log for the webserver only accessable from SLAC
- http://www-wanmon.slac.stanford.edu/cgi-wrap/tulip-viz.cgi?debug=1
Security Considerations
It uses the -w and -T (taint) options, plus use strict, all open and closes have a die associated, the system command uses the 3 paramter version,
Google Maps
The Google Map is deployed at /afs/slac.stanford.edu/www/comp/net/wan-mon/viper/tulip_map.html
This file (tulip_map.html) is read by tulip-viz.cgi script and then printed to the standard output, as it is with the exception of one line of code described below.
<script src="http://maps.google.com/maps?file=api&v=2&key=KEY"
type="text/javascript"></script>
<script type="text/javascript">
// global variables
var gmarkers=[];
var map;
var circle;
var circleRadius=0;
function doDrawCircle(lat,lon,circleRadius){
var center = map.getCenter();
var bounds = new GLatLngBounds();
var circlePoints = Array();
with (Math) {
var d = circleRadius/6378.8; // radians
var lat1 = (PI/180)* lat; // radians
var lng1 = (PI/180)* lon; // radians
for (var a = 0 ; a < 361 ; a++ ) {
var tc = (PI/180)*a;
var y = asin(sin(lat1)*cos(d)+cos(lat1)*sin(d)*cos(tc));
var dlng = atan2(sin(tc)*sin(d)*cos(lat1),cos(d)-sin(lat1)*sin(y));
var x = ((lng1-dlng+PI) % (2*PI)) - PI ; // MOD function
var point = new GLatLng(parseFloat(y*(180/PI)),parseFloat(x*(180/PI)));
circlePoints.push(point);
bounds.extend(point);
}
if (d < 1.5678565720686044) {
circle = new GPolygon(circlePoints, '#000000', 1, 1, '#000000', 0.2);
}
else {
circle = new GPolygon(circlePoints, '#000000', 1, 1);
}
map.addOverlay(circle);
//map.setZoom(map.getBoundsZoomLevel(bounds));
}
}
function Markers(subject){
// map = new GMap2(document.getElementById("map"));
if (document.getElementById(subject).checked==false) { // hide the marker
for (var i=0;i<gmarkers.length;i++) {
if (gmarkers[i].type==subject) {
map.removeOverlay(gmarkers[i]);
}
}
} else { // show the marker again
for (var i=0;i<gmarkers.length;i++) {
if (gmarkers[i].type==subject) {
map.addOverlay(gmarkers[i]);
}
}
}
}
function createMarker(point, title ,subject, link, desc, loc,lat,lon, rtt)
{
var icon = new GIcon();
icon.shadowSize = new GSize(22, 20);
icon.iconAnchor = new GPoint(6, 20);
icon.infoWindowAnchor = new GPoint(5, 1);
if(subject == "PlanetLab")
{
icon.iconSize = new GSize(12,20);
icon.image = "http://www.slac.stanford.edu/comp/net/wan-mon/viper/mm_20_blue.png";
<!--alert(subject);-->
}
else if(subject == "PingER")
{
//icon.iconSize = new GSize(18,19);
//icon.iconSize = new GSize(15,15);
icon.iconSize = new GSize(12,20);
icon.image = "http://www.slac.stanford.edu/comp/net/wan-mon/viper/mm_20_red.png";
}
else if(subject == "multilateration")
{
//icon.iconSize = new GSize(10,12);
icon.iconSize = new GSize(12,20);
icon.image = "http://www.slac.stanford.edu/comp/net/wan-mon/viper/mm_20_green.png";
}
else if(subject == "trilateration")
{
//icon.iconSize = new GSize(17,17);
icon.iconSize = new GSize(12,20);
icon.image = "http://www.slac.stanford.edu/comp/net/wan-mon/viper/yellow_MarkerA.png";
}
else if (subject == "geoip")
{
icon.iconSize = new GSize(12,20);
icon.image = "http://www.slac.stanford.edu/comp/net/wan-mon/viper/pink_MarkerA.png";
}
else
{
alert(subject);
}
var marker = new GMarker(point,icon);
GEvent.addListener(marker, "click", function() {
marker.openInfoWindowHtml(" <b> Title</b> "+title +"<BR> <b> Link </b> <a href="+"'"+link+"' >"+link+"</a> <BR> <b> Type </b> "+subject+"<BR>
<b> Region </b> "+loc+"<BR> <b> Latitude </b> "+lat+"<BR> <b> Longitude </b> "+lon+"<BR> <b>Min RTT </b>"+rtt);
});
return marker;
}
function load()
{
map = new GMap2(document.getElementById("map"));
map.addControl(new GSmallMapControl());
map.addControl(new GMapTypeControl());
map.addControl(new GOverviewMapControl());
map.addControl(new GScaleControl());
map.setCenter(new GLatLng(45,13.1419), 2);
var mySite =new Array();// This is the structue in which the wole data is saved
function doDownload(rssFile) {
GDownloadUrl(rssFile, function(data, responseCode) {
var xml = GXml.parse(data);
var items = xml.documentElement.getElementsByTagName("item");
//alert(data);
for (var i = 0; i < items.length; i++)
{
mySite[i] = new Object();
mySite[i].link = GXml.value(items[i].getElementsByTagName("link").item(0));
mySite[i].title= GXml.value(items[i].getElementsByTagName("title").item(0));
mySite[i].desc= GXml.value(items[i].getElementsByTagName("description").item(0));
mySite[i].loc = GXml.value(items[i].getElementsByTagName("region").item(0));
mySite[i].subject= GXml.value(items[i].getElementsByTagName("subject").item(0));
mySite[i].lat= GXml.value(items[i].getElementsByTagName("lat").item(0));
mySite[i].lon= GXml.value(items[i].getElementsByTagName("lon").item(0));
mySite[i].point = new GLatLng(parseFloat(GXml.value(items[i].getElementsByTagName("lat").item(0))),
parseFloat(GXml.value(items[i].getElementsByTagName("lon").item(0))));
mySite[i].rtt= GXml.value(items[i].getElementsByTagName("rtt").item(0));
//alert(mySite[i].rtt);
if(mySite[i].rtt)
{
doDrawCircle(mySite[i].lat,mySite[i].lon,mySite[i].rtt*50);
}
marker = createMarker(mySite[i].point,mySite[i].title ,mySite[i].subject, mySite[i].link, mySite[i].desc,mySite[i].loc,mySite[i].lat,
mySite[i].lon,mySite[i].rtt);
gmarkers.push(marker);
marker.type = mySite[i].subject;
map.addOverlay(marker);
}
});
} // end doDownload
doDownload('tulip-viz.cgi?function=xml');#!!!!!!!!!!!!THIS LINE IS REPLACED
}
</script>
</head>
<body onload="load()">
<table class="tborder">
<tr><td class="alt2" colspan ="90%">
<!-- map -->
<div id="map" style="width: 900px; height: 500px"></div>
<!-- map -->
</td>
<td valign="top" class="alt1" colspan ="10%">
<!-- this is the form with the check boxes -->
<form name="form1" action=""><strong>Legend / Toggles</strong><br />
<img src="http://www.slac.stanford.edu/comp/net/wan-mon/viper/mm_20_blue.png" width="12" height="20" title="Awesome IHY" alt="Red Marker" />
<input type="checkbox" name="bcon1" id="PlanetLab" onclick="Markers('PlanetLab')" checked /> Planet Lab Landmarks
<br />
<img src="http://www.slac.stanford.edu/comp/net/wan-mon/viper/mm_20_red.png" width="12" height="20" title="Awesome IHY" alt="Red Marker" />
<input type="checkbox" name="mon1" id="PingER" onclick="Markers('PingER')" checked /> PingER Landmarks
<br />
<img src="http://www.slac.stanford.edu/comp/net/wan-mon/viper/mm_20_green.png" width="12" height="20" title="Awesome IHY" alt="Red Marker" />
<input type="checkbox" name="remote1" id="multilateration" onclick="Markers('multilateration')" checked />Multilateration (Uses four Circles)
<br />
<img src="http://www.slac.stanford.edu/comp/net/wan-mon/viper/yellow_MarkerA.png" width="12" height="20" title="Awesome IHY" alt="Red Marker" />
<input type="checkbox" name="trilateration" id="trilateration" onclick="Markers('trilateration')" checked/> Trilateration (Uses three Circles)
<br />
<img src="http://www.slac.stanford.edu/comp/net/wan-mon/viper/pink_MarkerA.png" width="12" height="20" title="Awesome IHY" alt="Red Marker" />
<input type="checkbox" name="mag1" id="geoip" onclick="Markers('geoip')" checked /> Geoiptool
<br />
</form> <br />
</td>
</tr>
</table>
Contacts:
Shahryar Khan (SEECS and SLAC) <shahryar2001 at gmail.com> Qasim Bilal Lone (SEECS and SLAC) <qasim.lone at gmail.com>, a
nd Les Cottrell (SLAC) <cottrell at slac.stanford.edu> as part of the MAGGIE-NS team
</body>
</HTML>
The standard output is sent to the client/browser and contains Javascript for it to execute. This JavaScript module (tulip_map.html above) depends on an XML file that is generated by the Java Program (AutomateTest.java, see below) for a particular domain or IP address. The CGI script (tulip-viz.cgi) dynamically changes the following line of code (in tulip_map.html) to download the XML file for a particular IP address.
doDownload('tulip-viz.cgi?function=xml&target=<IP-address>');
This line of code sends a second request to tulip-viz.cgi (with a different parameter (function=xml)) which returns the XML file for that IP address from /tmp directory.
Another important method in this JavaScript module is doDrawCircle(lat,lon,circleRadious) which draws circle of radious in Kilometers using latitude and longitude at the center.
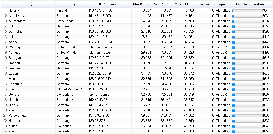
Table (Google Visualization)
The table is deployed at /afs/slac.stanford.edu/www/comp/net/wan-mon/viper/test_table.html
This file is read by the tulip-viz.cgi script and is printed to the standard output (and hence sent to the browser/client) without modification
This table uses Google Visualization API. See Google Visualization API for details. The contents of test_table.html are as follows:
<html>
<script type="text/javascript" src="http://www.google.com/jsapi"> </script>
<script type="text/javascript">
google.load("visualization","1",{packages: \['table'\]});
var data;
var table;
var count=0;
var formatter;
function drawTable() {
data = new google.visualization.DataTable();
data.addColumn('string', 'City');
data.addColumn('string', 'Country');
data.addColumn('string', 'IP Address');
data.addColumn('number', 'Min RTT');
data.addColumn('number', 'Avg RTT');
data.addColumn('number', 'Max RTT');
data.addColumn('number', 'Loss (%)');
data.addColumn('string', 'Type');
data.addColumn('number', "Est. Distance (km)");
table = new google.visualization.Table(document.getElementById('table_div'));
formatter = new google.visualization.TableBarFormat({width: 120});
formatter.format(data, 8); // Apply formatter to 9th column
table.draw(data, {allowHtml: true,showRowNumber: true});
}
function addRow(city,country,ip,min_rtt,a_rtt,max_rtt,loss,type,distance){
var dist = parseInt(distance);
data.addRows(1);
data.setCell(count, 0, city);
data.setCell(count, 1, country);
data.setCell(count, 2, ip);
data.setCell(count, 3, parseFloat(min_rtt), min_rtt);
data.setCell(count, 4, parseFloat(a_rtt), a_rtt);
data.setCell(count, 5, parseFloat(max_rtt), max_rtt);
data.setCell(count, 6, parseFloat(loss), loss);
data.setCell(count, 7, type);
data.setCell(count, 8, dist,dist);
formatter.format(data, 8); // Apply formatter to 9th column
      if(count % 5 == 0) {// draw function is expensive in terms of time so call only once for every 5 rows
      table.draw(data, {allowHtml: true,showRowNumber: true});
      }
count++;
}
</script>
<body>
<div id="table_div">
</div>
<script>
drawTable();
</script>
The important method in here is addRow(). It is called from the Java Class GetPingDataPL.java This class spits out the Java Script calls of the format:
<script>addRow('Princeton','"United States"','128.112.139.80',' 81.010','81.5899','82.592',' 0','PlanetLab','4050.5');</script>
<script>addRow('Boston','"United States"','204.8.155.227',' 77.131','79.8392','81.611',' 0','PlanetLab','3856.5498046875');</script>
<script>addRow('Provo','"United States"','128.187.223.212',' 30.673','31.1793','31.722',' 0','PlanetLab','1533.6500244140625');</script>
<script>addRow('Atlanta','"United States"','143.215.129.117',' 69.584','70.0512','70.590',' 0','PlanetLab','3479.199951171875');</script>
<script>addRow('Vancouver','Canada','206.12.16.155',' 11.231','11.4789','11.688',' 0','PlanetLab','561.5499877929688');</script>
<script>addRow('Houston','"United States"','208.117.131.116',' 84.476','84.9645','85.390',' 0','PlanetLab','4223.7998046875');</script>
<script>addRow('Kwangju','"Korea Rep"','210.125.84.15',' 164.529','165.0591','165.930',' 0','PlanetLab','8226.4501953125');</script>
<script>addRow('Durham','"United States"','152.3.138.5',' 86.711','86.9308','87.292',' 0','PlanetLab','4335.5498046875');</script>
Java Code
The java code is kept at /afs/slac.stanford.edu/package/pinger/tulip/src/tulip
|-- core
| |-- AutomateTest-08-20-2008
| |-- AutomateTest-10-11.tier
| |-- AutomateTest-1stResearchPaper
| |-- AutomateTest-25-07
| |-- AutomateTest-backUp-07-22.txt
| |-- AutomateTest-backUp-09-10
| |-- AutomateTest-sh.backup
| |-- AutomateTest-with-Viz
| |-- AutomateTest-withnewalgo-notiering
| |-- AutomateTest.
| |-- AutomateTest.bac
| |-- AutomateTest.final
| |-- AutomateTest.java
| |-- AutomateTest.java.old
| |-- AutomateTest.testall
| |-- AutomateTest.v1
| |-- AutomateTest_all_landmarks
| |-- GetPingDataPL-08-27-2008
| |-- GetPingDataPL.java
| |-- Locate-11-3-2008
| |-- Locate.1.0
| |-- Locate.bak
| |-- Locate.java
| |-- LocateMe.bak
| |-- LocateMe.java.bak
| |-- LocateMe10-30-08.back
| `-- PhysicalDistance.java
`-- util
|-- AnalyzeLog.java
|-- Conversions.java
|-- CreateElllipsoid.java
|-- GetGeoIPData.java
|-- Haversine.java
|-- JScience.java.bak
|-- LatLngToXYZ.java
|-- LatLontoXY.java
|-- Normalize.java
|-- PingParser.java
|-- Point.java
|-- SAXParserTulip.java
|-- Sites.java
|-- XYZToLatLng.java
|-- XYtoLatLon.java
|-- sites.xml
`-- test.java.bak
The two important classes are:
(1) AutomateTest.java The main Java file that saves the XML file in the /tmp directory
To run it seperately ( java -cp /afs/slac.stanford.edu/package/pinger/tulip/build/commons-httpclient-3.1.jar:/afs/slac.stanford.edu/package/pinger/tulip/build/commons-logging-1.1.1.jar:/afs/slac.stanford.edu/package/pinger/tulip/build/commons-codec-1.3.jar:/afs/slac.stanford.edu/package/pinger/tulip/build tulip/core/AutomateTest target 171.67.216.14 startNewTest)
(2) GetPingDataPL.java The class that spits out the JS output
Problems
If the RTT > ~127ms the circle cannot be plotted. 127 * 50(alpha) ~= 6357 Km which is the radious of the earth.
java -cp /afs/slac.stanford.edu/package/pinger/tulip/build/commons-httpclient-3.1.jar:/afs/slac.stanford.edu/package/pinger/tulip/build/commons-logging-1.1.1.jar:/afs/slac.stanford.edu/package/pinger/tulip/build/commons-codec-1.3.jar:/afs/slac.stanford.edu/package/pinger/tulip/build tulip/core/AutomateTest target 171.67.216.14 startNewTest