Introduction
Package PlotsWithGUI is intended for interactive 2-d image analysis. It is written on python and uses the numpy library for fast manipulation with arrays, matplotlib library for graphics, and PyQt4 for GUI (Graphical User Interface). We assume that image is available in the form of 2-d numpy array. This array is passed as an input parameter at initialization of the ImgExplorer class object and can be updated later using a simple program interface. When image is drawn, one may select by mouse different regions of the image in order to plot spectra, profiles, x-y and r-theta projections, zoomed-in images etc. GUI allows easy manipulate with regions; add, move, select, and remove regions and associated derived plots for current event. All newly created plots are preserved for other events, when image array is updated. GUI is mainly based on intuitive mouse manipulations with very minor input from keyboard.
Features
Current version of the package produce the plot of the input image and allows to generate numerous derived plots, such as
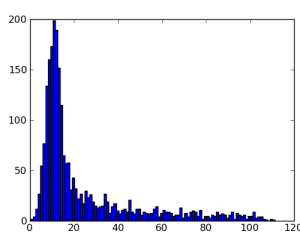
- Spectrum in the rectangular region
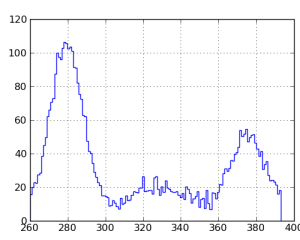
- Image profile along the straight line
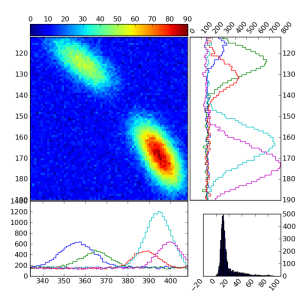
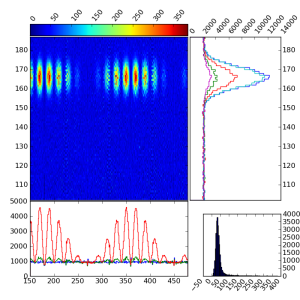
- X-Y projections and spectrum in the rectangular region
- R-Phi projections and spectrum in the wedge region
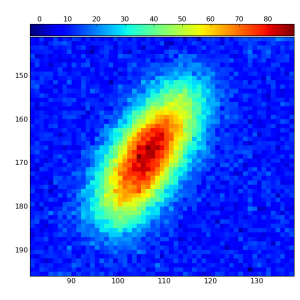
- Zoomed-in image of the rectangular region
How to run it?
Use module Example.py from the PlotsWithGUI package in order to to run example and to see how it works:
psanaxxxx> python Example.py
This package has a simple program interface, which runs as a regular PyQt4 widget.
#-----------------------------
import sys
import ImgExplorer as ie
from PyQt4 import QtGui, QtCore
#-----------------------------

def main():

    app = QtGui.QApplication(sys.argv)

    w  = ie.ImgExplorer(None)
    w.move(QtCore.QPoint(10,10))
    w.set_image_array( w.get_array2d_with_ring_for_test() )
    w.show()

    app.exec_()

#-----------------------------
if __name__ == "__main__" :
    main()
    sys.exit ('End of test')
#-----------------------------
Main window
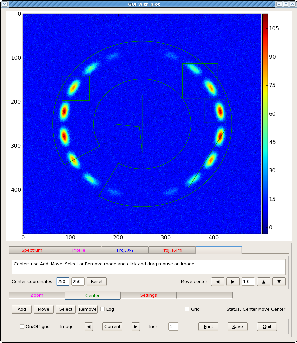
When program starts the main graphical window appears at first. This window contains the input image integrated with GUI.
Control GUI of the main window
Image of the main window
Derived plots
Spectrum
Profile
Projection X-Y
Configuration parameters
confpars.00N
Projection R-Theta
Zoom
Overview
Content Tools