Introduction
Package PlotsWithGUI is intended for interactive 2-d image analysis. It is written on python and uses the numpy library for fast manipulation with arrays, matplotlib library for graphics, and PyQt4 for GUI (Graphical User Interface). We assume that image is available in the form of 2-d numpy array. This array is passed as an input parameter at initialization of the ImgExplorer class object and can be updated later using a simple program interface. When image is drawn, one may select by mouse different regions of the image in order to plot spectra, profiles, x-y and r-theta projections, zoomed-in images etc. GUI allows easy manipulate with regions; add, move, select, and remove regions and associated derived plots for current image. All newly created plots are preserved for other images, when image array is updated. GUI is based on intuitive mouse manipulations with very minor input from keyboard, where it is necessary.
Features
Current version of the package produce the plot of the input image and allows to generate numerous derived plots, such as
- Spectrum in the rectangular region
- Image profile along the straight line
- X-Y projections and spectrum in the rectangular region
- R-Phi projections and spectrum in the wedge region
- Zoomed-in image of the rectangular region
Main window
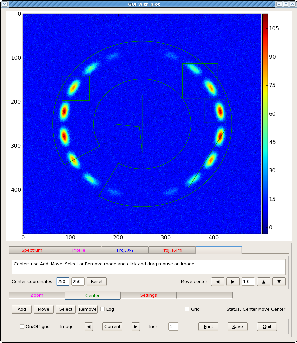
When program starts the main graphical window appears first. This window contains image of the input 2-d array integrated with GUI.
In order to get any derived plot one has to click on mouse (left button) few times;
First, select the tab for type of the plot which you want;
- Spectrum
- Profile
- Proj.X-Y
- Proj.R-Phi
- Zoom
- Center
then, choise the modeAdd(default mode isMove)
and, finally, click-and-drag the mouse on image in order to select the desired region. This operation slightly depends on what type of region do you want to select: - for line it is the 1st and last point of the line,
- for rectangular box it is two opposite corners,
- for center it is the coordinate of the center and the half size of the center sign along the x and y directions,
- for wedge it is two opposite corners, assuming that the center is already defined.
All click-release points can be indicated withoud any particular order. Later all regions can be adjusted in modeMove.
Derived plots
Spectrum
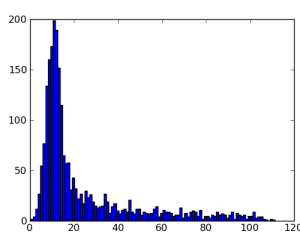
Plot shows the spectrum of pixel amplitudes in the rectangular region.
Profile
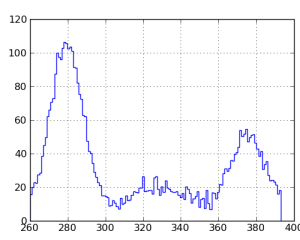
Plot shows the profile histogram of pixel amplitudes along the straight line. If the (x1,y1) and (x2,y2) are the two endpoints of the line, the histogram represents the pixels
- along the x direction, if |x2-x1| > |y2-y1|, and
- along the y direction, if |x2-x1| < |y2-y1|.
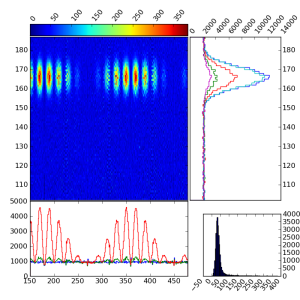
Projection X-Y
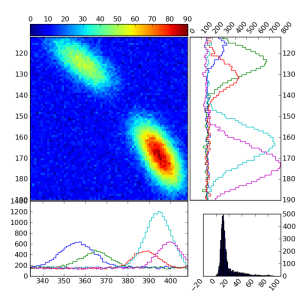
Plot shows the zoomed rectangular region of image, its two projections on x and y directions, and the spectrum of pixel amplitudes in the same rectangle. The number of slices in x and y projection can be changed trough the Proj.X-Y GUI.
Projection R-Phi
For this plot the wedge region of image is transformed in the r-theta array. Plot shows the r-theta array, its two projections on r and theta directions, and the spectrum of the bin amplitudes. The number of r-rings and theta-sectors can be changed trough the GUI. The radial correction factor r0/r can be applied to the pixel amplitudes if the checkbox is marked in the Proj.R-Phi GUI.
Zoom
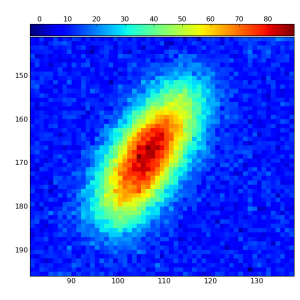
Plot shows the zoomed rectangular region of image.
Image access method
By default, for test purpose, image arrays are generated by a few methods involving random numbers.
In real case the image access method get_image( self, imageFlag, increment=None), defined in class ImgControl, needs to be overwritten in order to supply user-defined image arrays.
Example for multi-image analysis shows how to overwrite the {get_image(...)}} in user code. The input parameter imageFlag may take three values self.icp.imagePrevious, self.icp.imageCurrent, or self.icp.imageNext, depending on which button in the GUI is clicked, left arrow, Current, or right arrow, respectively. The increment value, also defined in the GUI, may be used as a parameter in transition to the next or previous image.
Use case examples
Example for single image
Module Example1.py from the PlotsWithGUI package shows how to run
this program for a single image:
psanaxxxx> python Example1.py
This package has a simple program interface, which runs as a regular PyQt4 widget, as shown in code of the Example1.py:
#-----------------------------
import sys
import ImgExplorer as imgex
from PyQt4 import QtGui, QtCore
#-----------------------------

def main():

    app = QtGui.QApplication(sys.argv)

    w  = imgex.ImgExplorer(None)
    w.move(QtCore.QPoint(10,10))
    w.set_image_array( imgex.getRandomWithRing2DArray() )
    w.show()

    app.exec_()

#-----------------------------
if __name__ == "__main__" :
    main()
    sys.exit ('End of test')
#-----------------------------
Actual single image array should be feeded in stead of imgex.getRandomWithRing2DArray().
Example for multi-image analysis
Generic exampple for multi-image analysis can be run by the command:
psanaxxxx> python Example.py
Code of the Example.py:
#------------------------------
import sys
import ImgExplorer as imgex
from PyQt4 import QtGui, QtCore
#------------------------------

class ImgExplorerWithMyImages(imgex.ImgExplorer) :

    def __init__(self, parent=None, arr=None):
        imgex.ImgExplorer.__init__(self, None)
        self.myshape = (500,500)
        self.get_image( self.icp.imageCurrent )

    def get_image( self, imageFlag, increment=None) :
        """This method overwrites the get_image(...) in class ImgControl.
        imageFlag may take 3 values: self.icp.imagePrevious / imageCurrent / imageNext.
        The increment value may be used in transition to the next or previous image.
        """
        print 'MY IMAGES SUPPLIED BY THE get_image(', imageFlag, ', increment =', increment, ')'

        if imageFlag == self.icp.imagePrevious :
            self.set_image_array( imgex.getSmouth2DArray(self.myshape) )
        if imageFlag == self.icp.imageCurrent :
            self.set_image_array( imgex.getRandomWithRing2DArray(self.myshape) )
        if imageFlag == self.icp.imageNext :
            self.set_image_array( imgex.getRandom2DArray(self.myshape) )

#------------------------------

def main():

    app = QtGui.QApplication(sys.argv)

    w = ImgExplorerWithMyImages()
    w.move(QtCore.QPoint(10,10))
    w.show()

    app.exec_()

#------------------------------
if __name__ == "__main__" :
    main()
    sys.exit ('End of test')
#------------------------------
This example shows how to owerwrite the method get_image( self, imageFlag, increment=None) from class ImgControl in order to supply the user defined image arrays for the "current, "previous", and "next" image. As in previous example the test image arrays generated by the methods getSmouth2DArray(...), getRandomWithRing2DArray(...), and getRandom2DArray(...) have to be replaces by the real image arrays.
Configuration parameters
Buttons Print and Save in the GUI work with configuration parameters;
- Print - prints the list of current configuration parameters,
- Save - saves the current configuration parameters in the file
confpars.00N.
When program is started, the configuration parameters will be loaded from the available fileconfpars.00Nor set to their default values.
How to get and run this package
Package PlotsWithGUI currently is in test exploitation and is not included yet in ana-releases.
Nevertheless, it can be copied and compiled in your local release directory.
To run example use commands:
ssh -Y pslogin

cd <your-favorite-directory>
newrel ana-current <your-release-directory-name>
cd                 <your-release-directory-name>
sit_setup
addpkg PlotsWithGUI

python PlotsWithGUI/src/Example.py
Appropriate substitution of names is assumed for the <your-favorite-directory> and <your-release-directory-name> placeholders.
Overview
Content Tools