Introduction
Zafar pointed us to an interesting TED talk on the HPI that gives an alternative take on measuring the progress of countries.
From WikipediaThe Happy Planet Index (HPI) is an index of human well-being and environmental impact that was introduced by the New Economics Foundation (NEF) in July 2006. The index is designed to challenge well-established indices of countries’ development, such as Gross Domestic Product (GDP) and the Human Development Index (HDI), which are seen as not taking sustainability into account. In particular, GDP is seen as inappropriate, as the usual ultimate aim of most people is not to be rich, but to be happy and healthy.1 Furthermore, it is believed that the notion of sustainable development requires a measure of the environmental costs of pursuing those goals.
Result
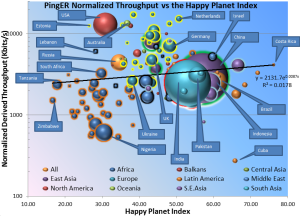
We downloaded the HPI data from the web and compared it with the PingER Normalized Derived Throughput for 2011. The result is seen below in the bubble plot with the bubble size being by country, and the bubble color identifying the region. To assist in distinguishing regions: European Countries are surrounded in yellow, East Asian countries are surrounded by green,and South Asian by red. the spread sheet is found here. The correlation with Internet performance is not strong. This is probably since the countries with the best Internet performance tend to the more advanced ones that also consume the most resources.
