| Name
|
Size
|
Creator |
Creation Date
|
Last Modification Date
|
Labels |
Attached To |
|
PNG File Screen Shot 2021-03-08 at 1.57.13 PM.png |
501 kB |
Les Cottrell |
Mar 08, 2021 13:58 |
Mar 08, 2021 14:29 |
|
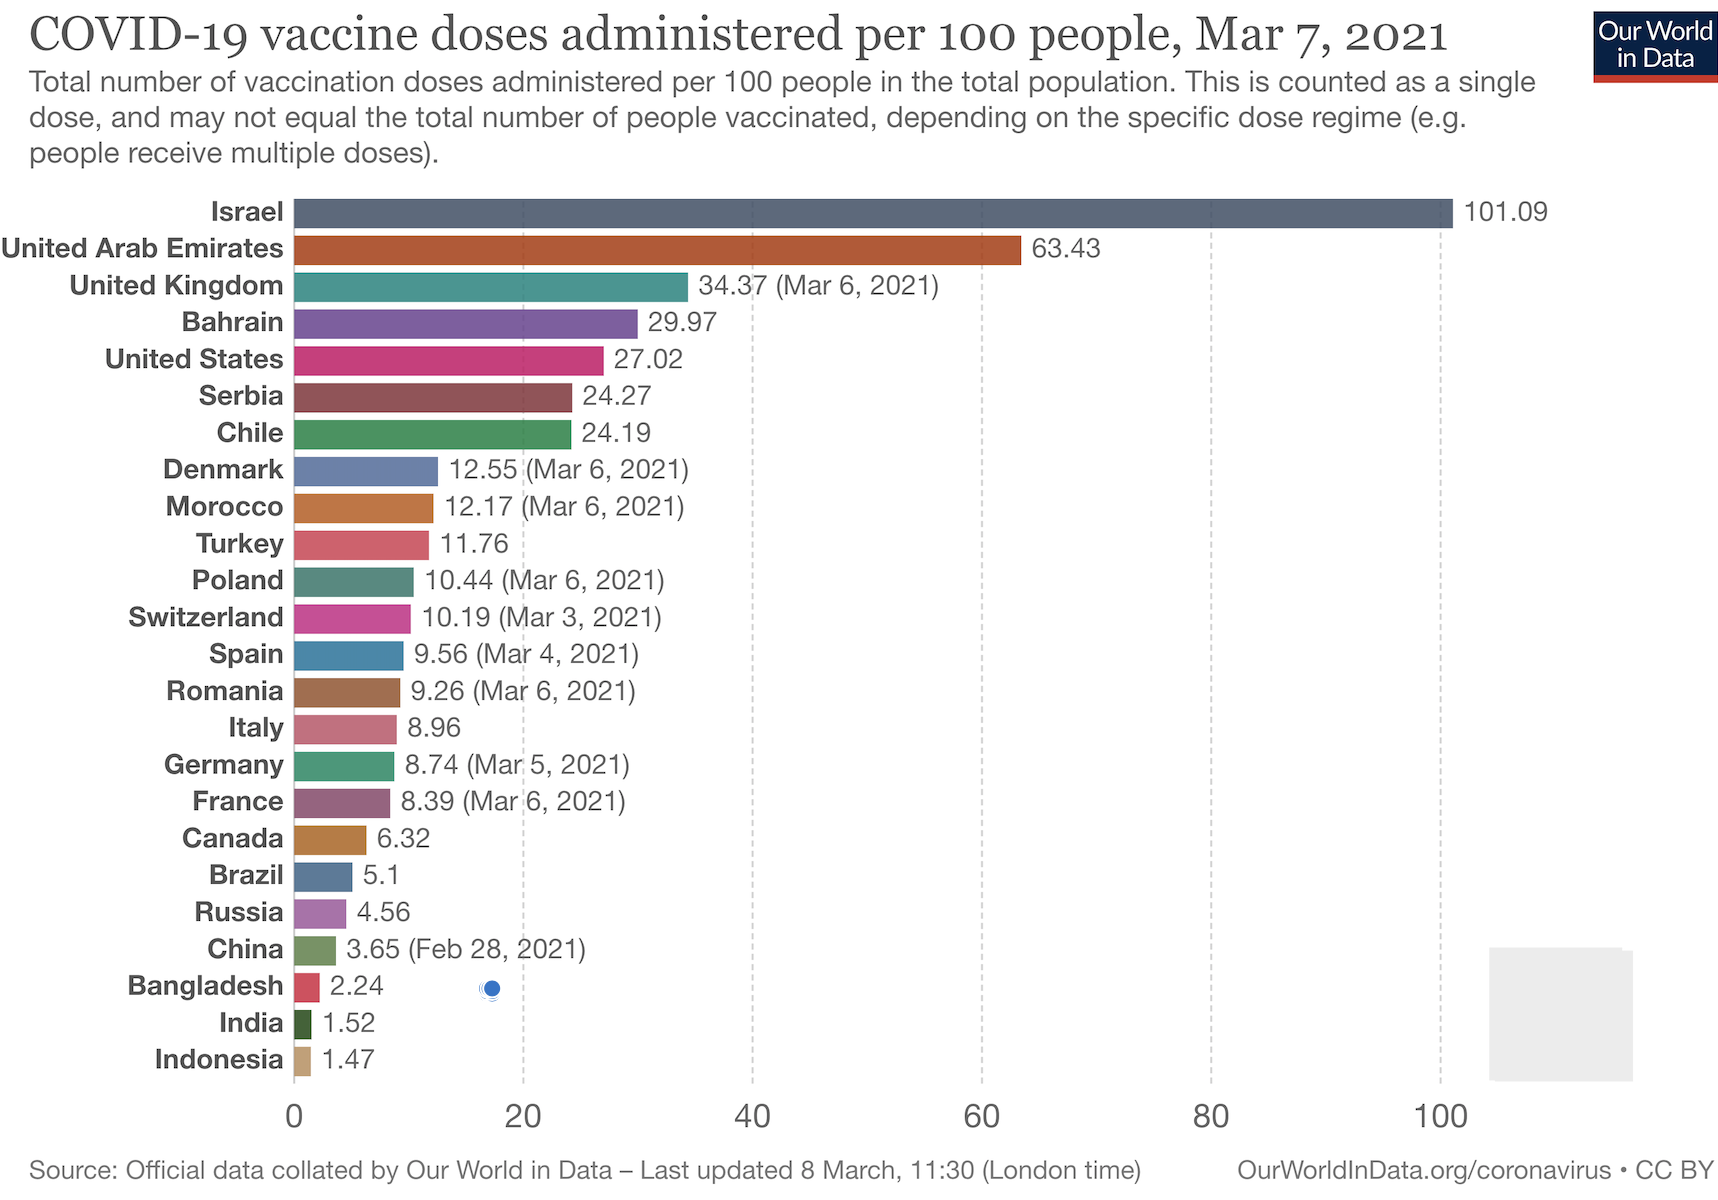
Page: Covid-19 March 7 Leading countries by number of vaccinations per capita
|
|
PNG File Screen Shot 2021-05-12 at 12.37.05 PM.png |
500 kB |
Les Cottrell |
May 12, 2021 12:38 |
May 12, 2021 12:38 |
|
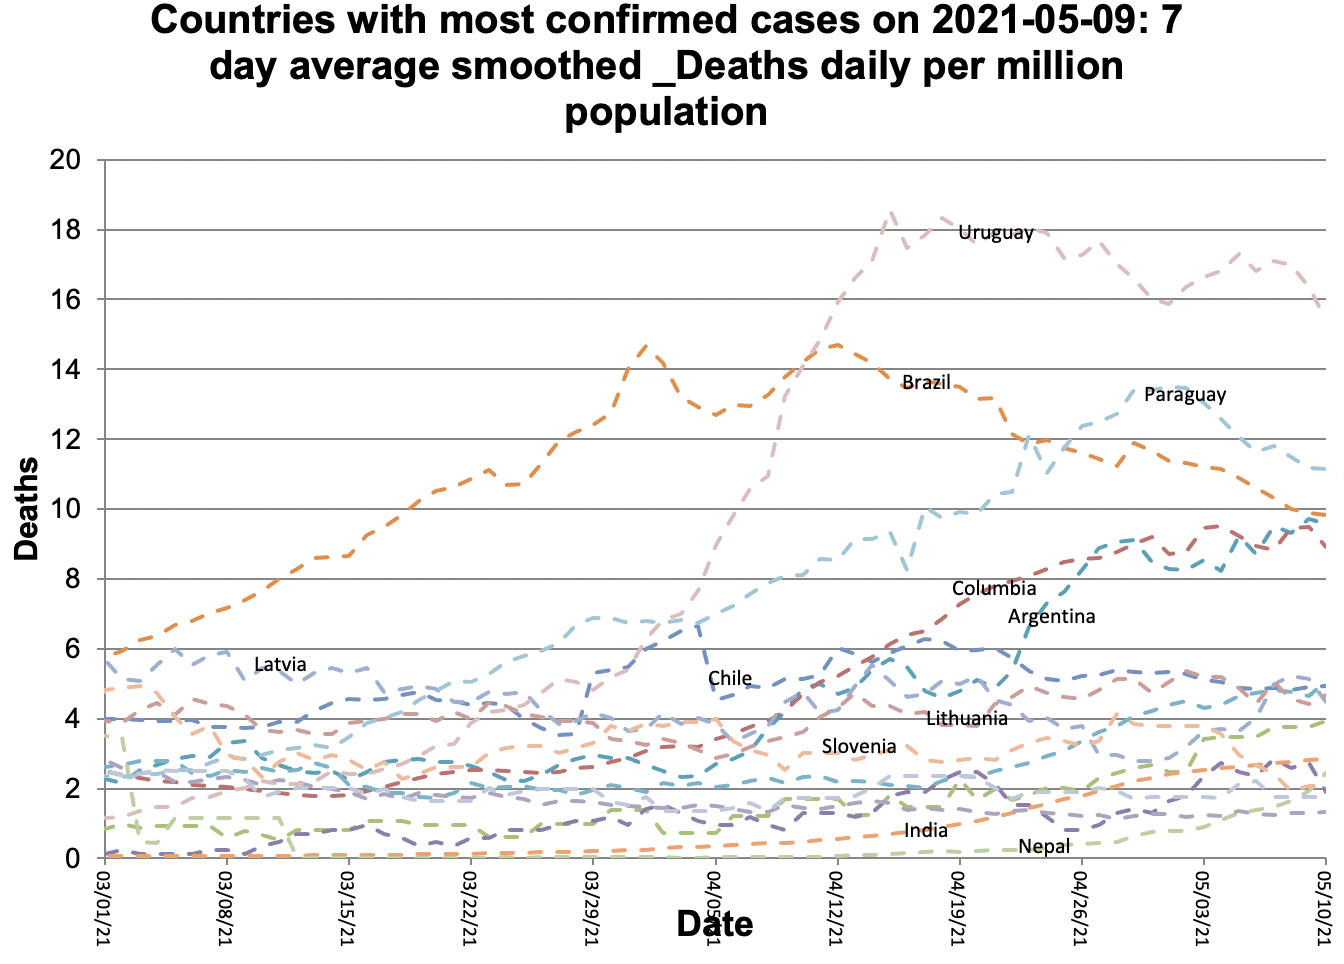
Page: Covid-19: 2021-05-09 Comparison of badly affected countries by region
|
|
PNG File Screen Shot 2020-04-14 at 4.58.27 PM.png |
500 kB |
Les Cottrell |
Apr 14, 2020 17:00 |
Apr 14, 2020 17:08 |
|
Page: Using Chart.ca
|
|
PNG File Screen Shot 2020-06-03 at 6.10.51 PM.png |
499 kB |
Les Cottrell |
Jun 03, 2020 18:38 |
Jun 03, 2020 18:38 |
|
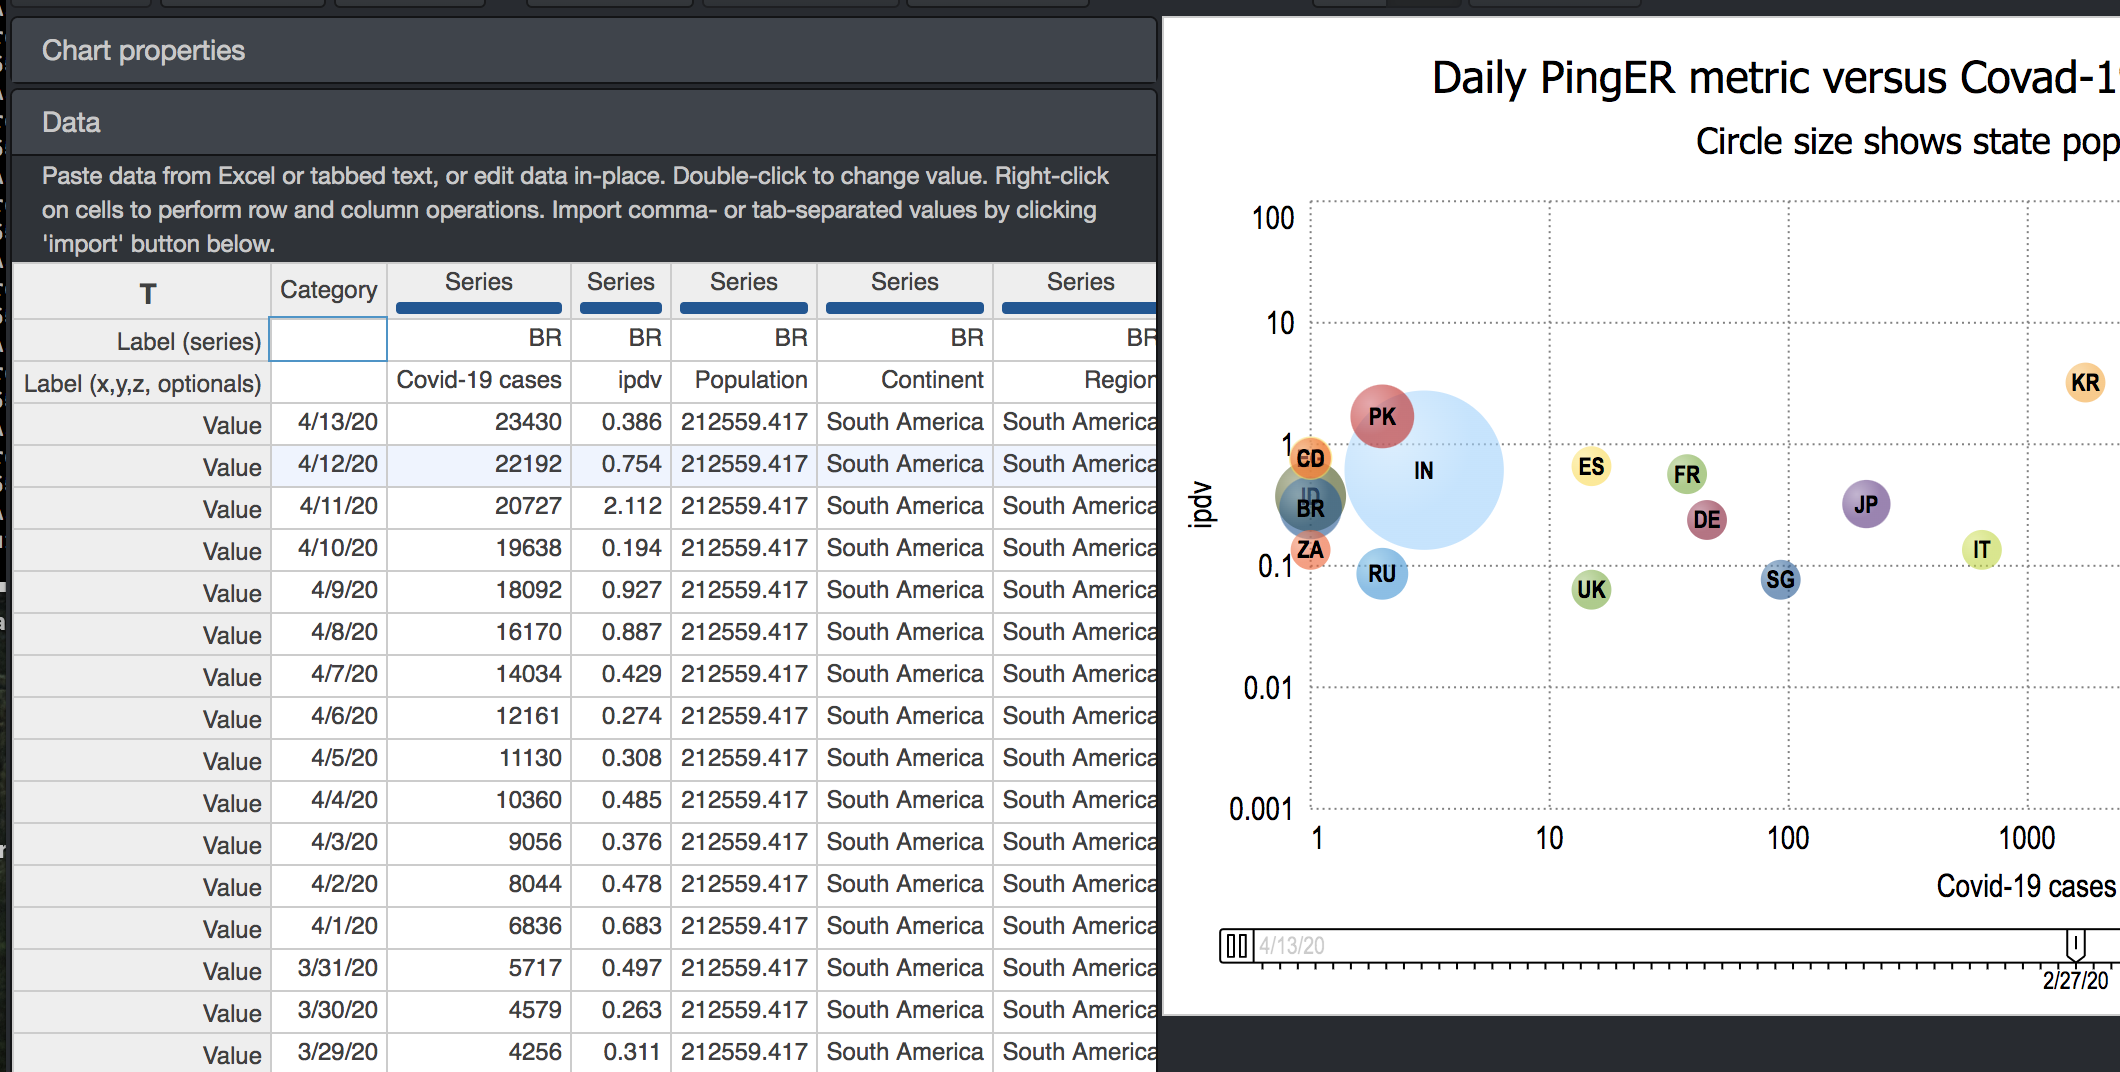
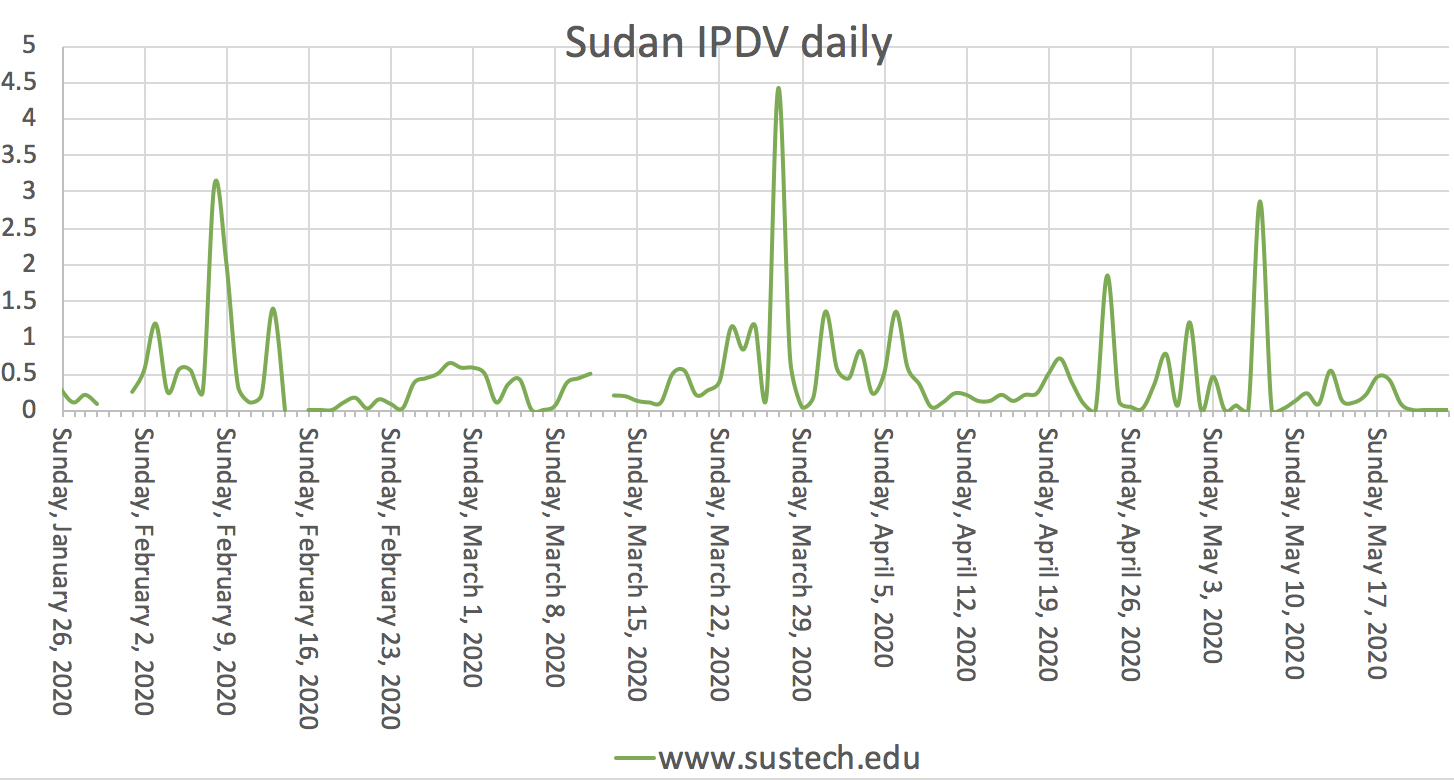
Page: PingER and Covid-19 in East Africa
|
|
PNG File Screen Shot 2020-11-09 at 3.32.48 PM.png |
498 kB |
Les Cottrell |
Nov 09, 2020 15:33 |
Nov 09, 2020 15:33 |
|
Page: Covid-19 in countries with most cases
|
|
PDF File E-Center_Proposal_Narrative.pdf |
498 kB |
Yee-Ting Li |
Sep 17, 2010 10:53 |
Sep 17, 2010 10:53 |
|
Page: e-Center
|
|
PNG File Screen Shot 2021-01-27 at 5.19.01 PM.png |
498 kB |
Les Cottrell |
Jan 30, 2021 13:31 |
Jan 30, 2021 13:31 |
|
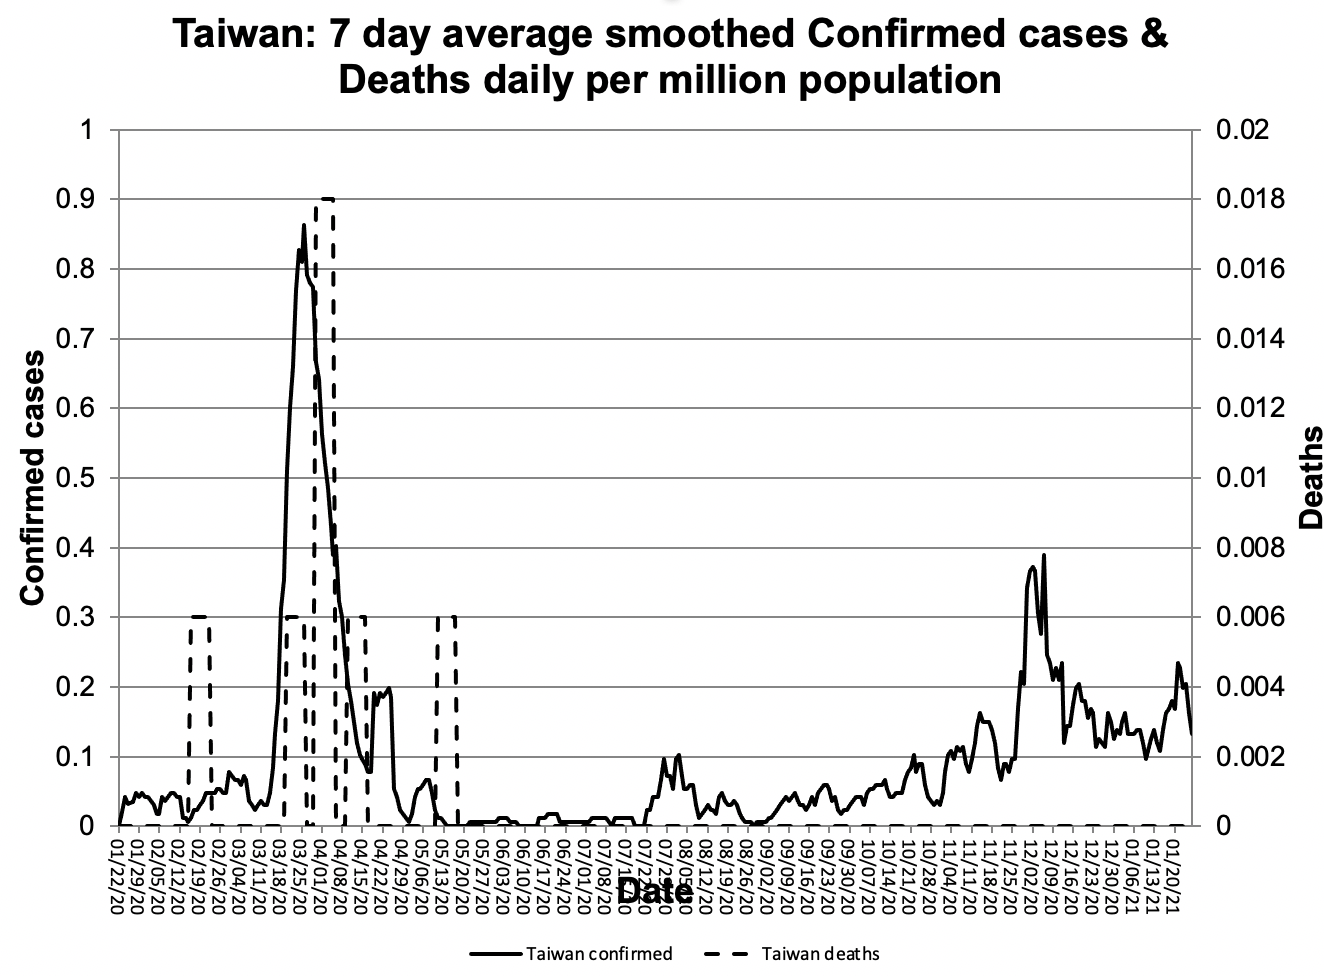
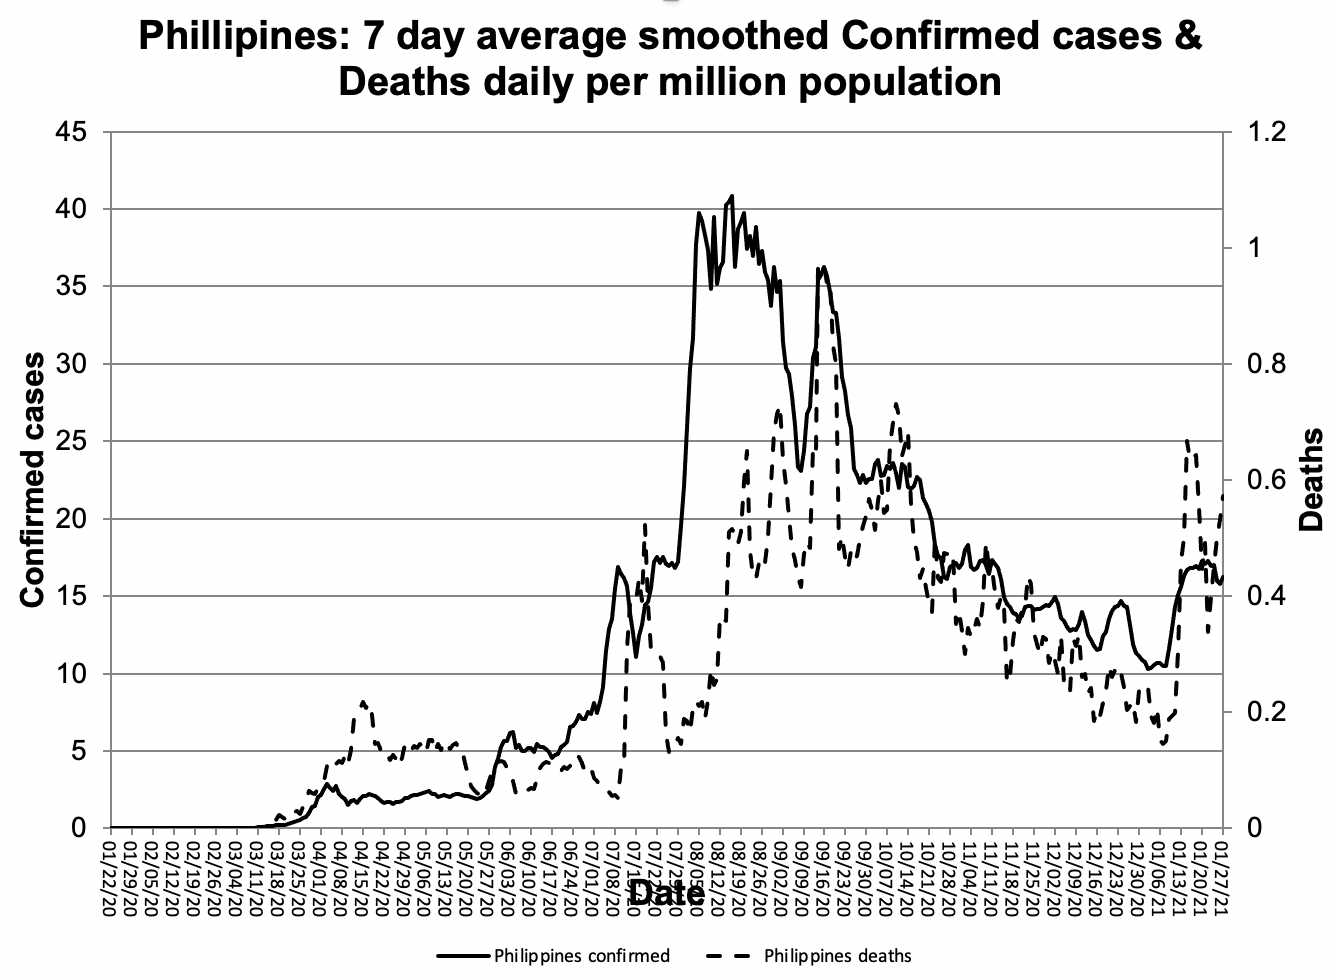
Page: Covid-19 Estimating delays between confirmed cases and deaths
|
|
PNG File Screen Shot 2021-01-27 at 5.19.01 PM.png |
498 kB |
Les Cottrell |
Jan 27, 2021 17:19 |
Jan 27, 2021 17:19 |
|
Page: Covid-19 Comparing the ratio of Deaths to Confirmed cases for representative countries
|
|
PNG File Screen Shot 2020-10-22 at 2.15.40 PM.png |
497 kB |
Les Cottrell |
Oct 22, 2020 14:18 |
Oct 22, 2020 14:18 |
|
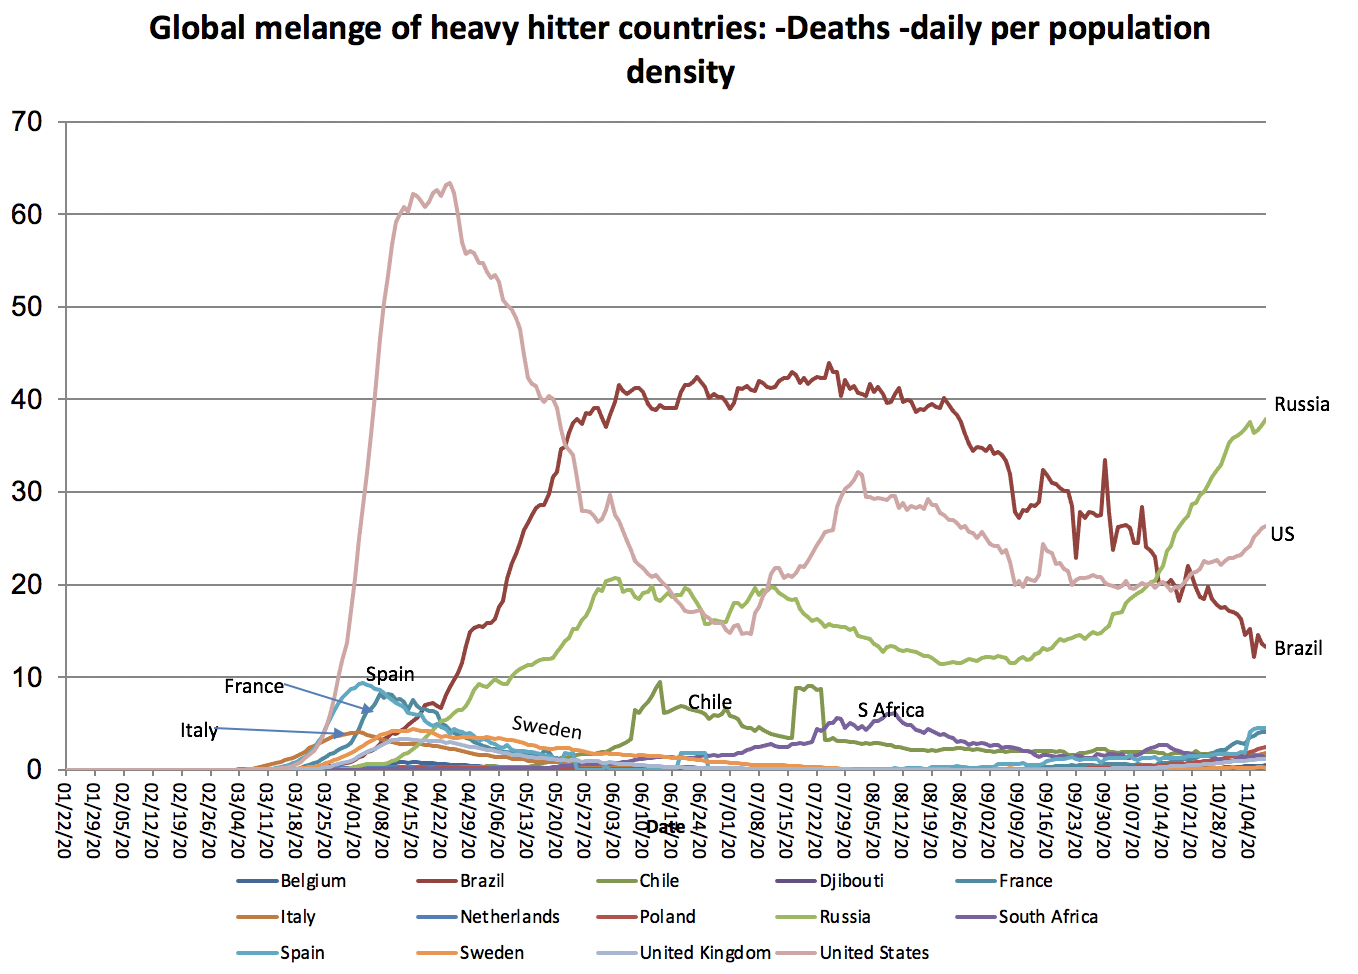
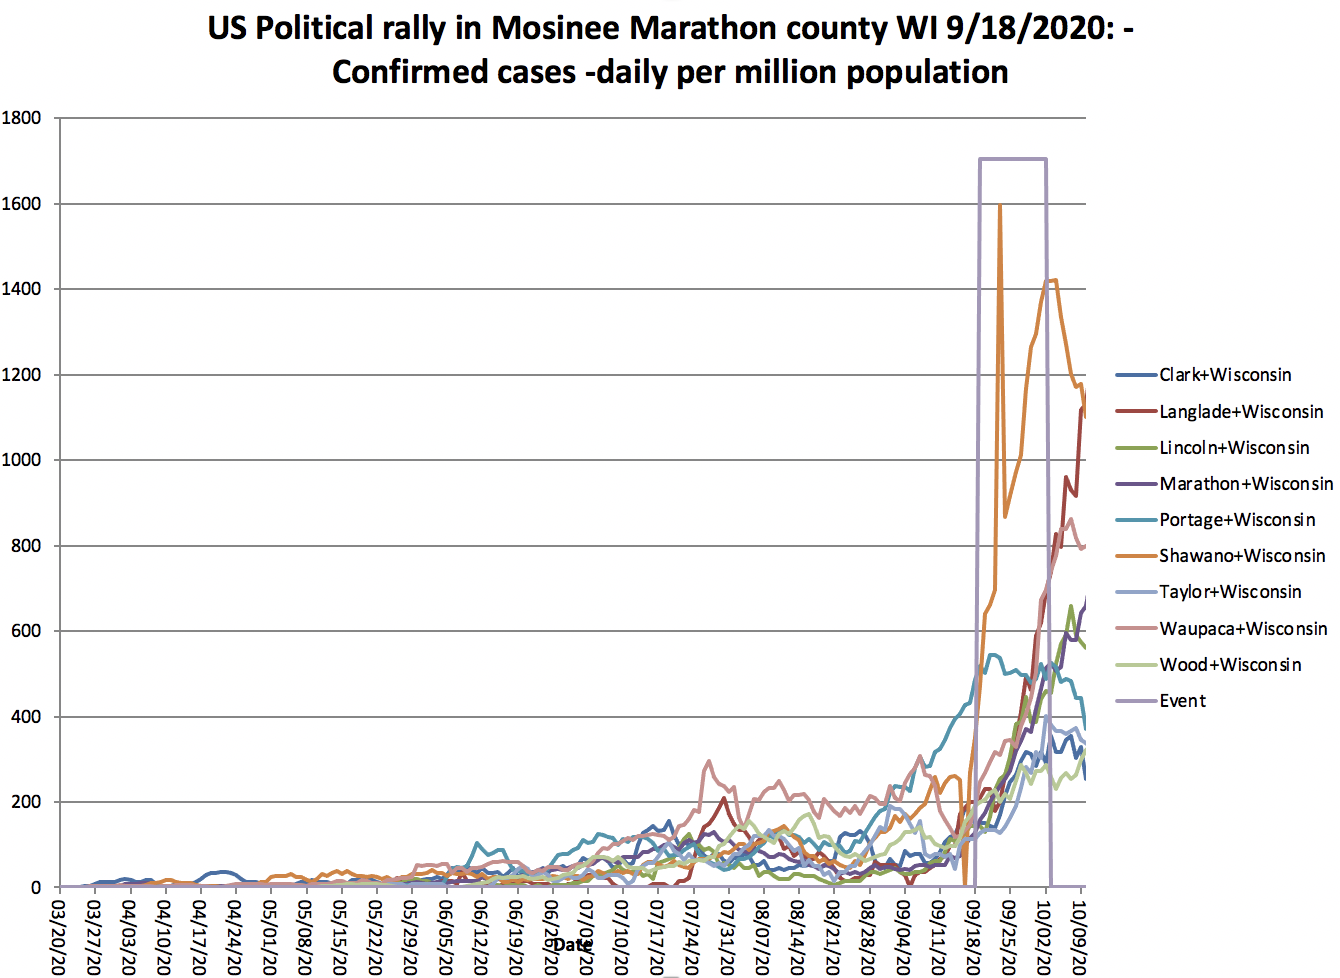
Page: Covid-19 US cases by counties following political rallies
|
|
Microsoft Word 97 Document GNEPpetsc06.doc |
497 kB |
Les Cottrell |
Sep 01, 2006 14:58 |
Sep 01, 2006 14:58 |
|
Page: Terapaths DWMI FY 2006 Accomplishments
|
|
PNG File Screen Shot 2021-01-28 at 3.52.52 PM.png |
496 kB |
Les Cottrell |
Jan 28, 2021 15:53 |
Jan 28, 2021 15:53 |
|
Page: Covid-19 Comparing the ratio of Deaths to Confirmed cases for representative countries
|
|
PNG File Screen Shot 2021-01-28 at 3.52.52 PM.png |
496 kB |
Les Cottrell |
Jan 30, 2021 13:31 |
Jan 30, 2021 13:31 |
|
Page: Covid-19 Estimating delays between confirmed cases and deaths
|
|
PNG File Screen Shot 2021-04-22 at 7.10.30 PM.png |
494 kB |
Les Cottrell |
Apr 22, 2021 19:10 |
Apr 23, 2021 12:15 |
|
Page: Covid-19 April 24 2021
|
|
PNG File Screen Shot 2021-04-22 at 7.10.30 PM.png |
494 kB |
Les Cottrell |
May 09, 2021 14:48 |
May 10, 2021 17:52 |
|
Page: Covid-19: 2021-05-09 Comparison of badly affected countries by region
|
|
Microsoft Excel Sheet performance-data-SLAC-PK-mac.xls |
493 kB |
Unknown User (umar.kalim) |
Jan 22, 2009 18:16 |
Jan 22, 2009 18:16 |
|
Page: Case Study of SEECS, NUST & Pakistan - Jan '09
|
|
PNG File Screen Shot 2021-01-28 at 3.34.39 PM.png |
493 kB |
Les Cottrell |
Jan 30, 2021 13:31 |
Jan 30, 2021 13:31 |
|
Page: Covid-19 Estimating delays between confirmed cases and deaths
|
|
PNG File Screen Shot 2021-01-28 at 3.34.39 PM.png |
493 kB |
Les Cottrell |
Jan 28, 2021 15:35 |
Jan 28, 2021 15:35 |
|
Page: Covid-19 Comparing the ratio of Deaths to Confirmed cases for representative countries
|
|
PNG File Screen Shot 2021-01-16 at 8.35.40 PM.png |
492 kB |
Les Cottrell |
Jan 16, 2021 20:38 |
Jan 16, 2021 20:38 |
|
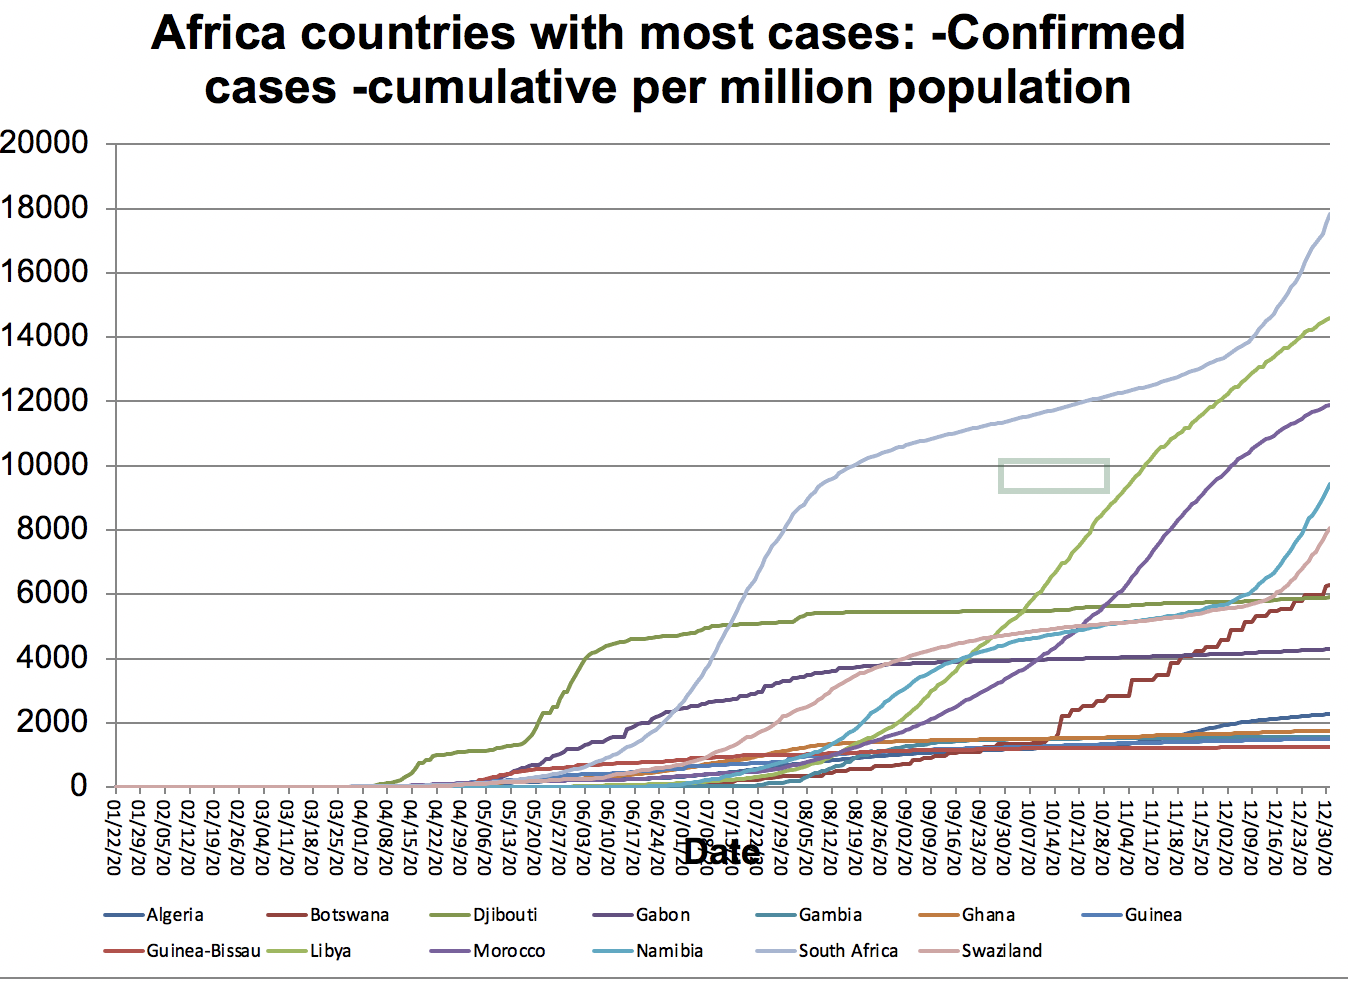
Page: Africa
|
|
PNG File Screen Shot 2021-01-16 at 8.35.40 PM.png |
492 kB |
Les Cottrell |
Jan 16, 2021 21:13 |
Jan 16, 2021 21:13 |
|
Page: Covid-19 bulletins
|
|
File ernet-map.bmp |
492 kB |
Les Cottrell |
Feb 13, 2007 09:33 |
Feb 13, 2007 09:33 |
|
Page: South Asia Case Study - 2008
|