Presentation FERMI _HBL presentation.pdf
HBL_answers_agncoordinators.docx
Internal reviewer comments on the April, 2019, ApJ version
Changes made April, 2019, due to suggestions from Vaidehi:
Updated wording as suggested
Dropped TSvar, because that variability analysis was not used in the paper.
Combined and consolidated tables.
Response to the ApJ Review:
We extend our thanks to the referee for a careful reading and helpful suggestions. Responses to the recommendations are given below. Changes in the text appear in bold font.
- The authors should explain why they decided to perform the extrapolation of the SED for high-confidence HSPs sources
only, i.e. with L_HSP>=0.89. Based on the estimated purity of their classification based on the validation of their machine
learning method reported at the end of Section 2, a lower L_HSPs>0.8 threshold will still produce a 75% efficiency that
would probably yield a quite large number of HSPs detectable by IACTs under the same assumptions used for the
high-confidences ones. Is this study a proof-of-concept that will be extended to the other (slightly less likely) HSPs
candidates selected with the Chiaro et al. 2016 method in a future work? Or there are more fundamental reasons
why the other sources in Table 1 and 2 were not investigated that I am missing?
Authors: This new method of identifying HSP blazars was untested. We know that the 4FGL catalog will have many more sources to investigate if this method is useful; therefore we concentrated our spectral analysis on the Very High Confidence sample. We added text to that effect at the beginning of section 4, line 120.
- Section 2: the description of the method used to select HSPs sources from 3FGL is terse. The manuscript, as it stands,
is not self-consistent and does not provide the minimal set of information that are needed to assess the viability of
the machine learning method used to select HSPs based on their gamma-ray flaring activity. I suggest that the authors
add to this section a summary of the basics about the method described in Chiaro+2016.
Authors: We have reorganized the description of the machine learning method and added information about the basic idea of the method (line 80) and the way the neural network works (line 88).
- As the authors mention in the introduction, other methods have been proposed to select candidate TeV blazars that
do not use gamma-ray information, at least directly. It would be interesting to know if their list of high and low-confidence
HSPs candidates can be spatially associated to candidates HSPs from the catalogs produced by Chang et al. 2017
(2WHSP) and D'Abrusco et al. 2019 (2019ApJS..242....4D).
Authors: We added a paragraph comparing our results to the 2WHSP catalog at the end of section 3, line 112. We did not try to compare our results with the D'Abrusco catalog, because their work attempts to identify the general BL Lac population, and not specifically HSPs.
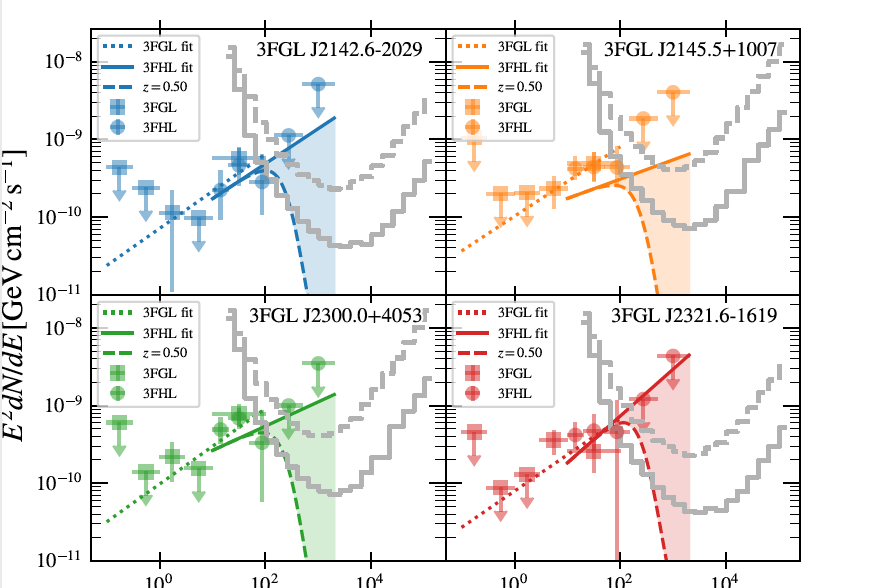
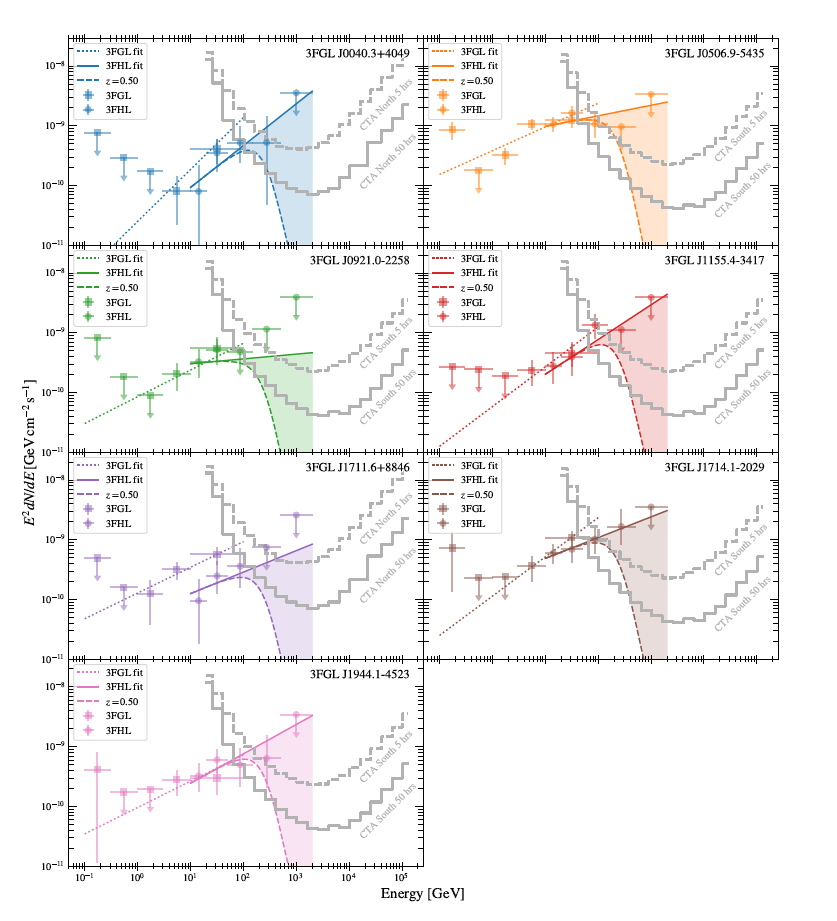
- In order to model the EBL attenuation, a redshift for the gamma-ray source needs to be provideds. The authors should
specify how they sampled the 0 to 0.5 interval used to obtain the two extreme behaviors, or did they just use the z=0
and z=0.5 values to determine the boundaries of the blue shaded areas between the two fitted SEDs?
Authors: We did the calculation for z=0 and z=0.5, without attempting to do a sampling. These two values encompass most of the known HSP redshifts, providing limits. We added this information to the text at line 165.
- Figure 1: since the focus of the papers is on sources located in scarcely populated bins for large L_HSP, I would
suggest to use a logarithmic y scale.
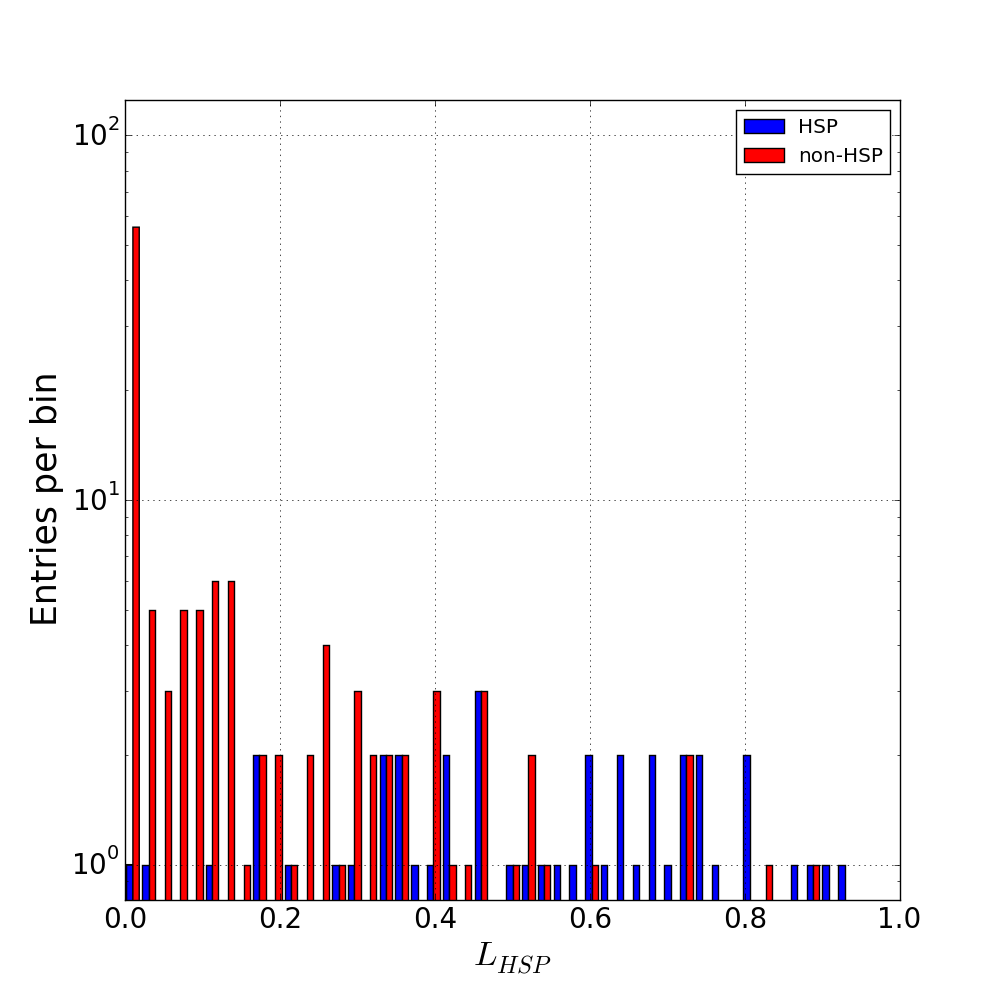
Authors: We changed to logarithmic scaling for Figure 1.
- Line 136: "did we find" -> "we found"
We prefer to keep the original wording. We feel it reads more smoothly, and it is grammatically correct.
G.Chiaro, M.Meyer, M. Di Mauro, D.Salvetti, G. La Mura, D.J. Thompson
Blazars and in particular the subclass of high synchrotron peaked objects are the main targets for the present generation of Imaging Atmospheric Cherenkov Telescopes (IACTs)and will remain of great importance for very high-energy gamma-ray science in light of the future Cherenkov Telescope Array (CTA).
The observation time of high energy sources by IACTs is limited by their small field of view, by the presence of many competing source populations to observe and science cases to study. Therefore, it is important to select the most promising targets in order to save observation time and consequently to increase the number of detections.
The aim of this study is to search for unclassified blazars , using Artificial Neural Network (ANN) algorithm that can realistically observed with IACTs or CTA in 50 or 5 hours.
The 3FGL catalogue contains two classes of source with uncertain classification that offer opportunities to identify HBLs and subsequently TeV candidates according with the TeV catalog census : (i) the 573 BCU and (ii) 1010 UCSs. Recently in https://arxiv.org/abs/1602.00385 the authors applied a number of machine-learning techniques to classify 3FGL UCSs as pulsars or AGN. The authors found 334 pulsars, 559 sources of AGN type and 117 remained uncertain.
The resulting 573 BCU and 559 AGN type sources represent the first targets for this search and we apply an optimized version of the ANN described in https://arxiv.org/abs/1709.05727 in order to compute the likelihood distribution of HBL and non-HBL sources
We perform an analysis of Fermi-LAT data in order to find the gamma-ray SED of our HBL candidates and confirm the nature of them.
We analyze 104 months of Pass 8 data, from 2008 August 4 to 2017 April 4, selecting gamma-ray events in the energy range E=[0.1,1000] GeV, passing standard data quality selection criteria.
We also compare the extrapolated fluxes of the candidates against the sensitivity of present IACTs and the future CTA. We use the Fermi-LAT spectral shape of the sources obtained in the range between 0.1 and 300 GeV using the best-fit model parameters from the LAT 4-year 3FGL Catalogue and particularly we referred to the following relation derived from the spectral model that fits the data.
ref.contact Graziano Chiaro graziano.chiaro@inaf.it
---------------------------------------------------------------------------------------------------------------------------------------------------------------------------------------------------------------------
DATA
Blazar subclasses HBL and non-HBL distribution against gamma-ray flux

Likelihood distribution of HBL and non-HBL sources in 3FGL blazars by our applied ANN algorithm.
This result could show that the applied algorithm is not able to clearly identify HBLs but the likelihood distribution can still be acceptable for the aim of this study
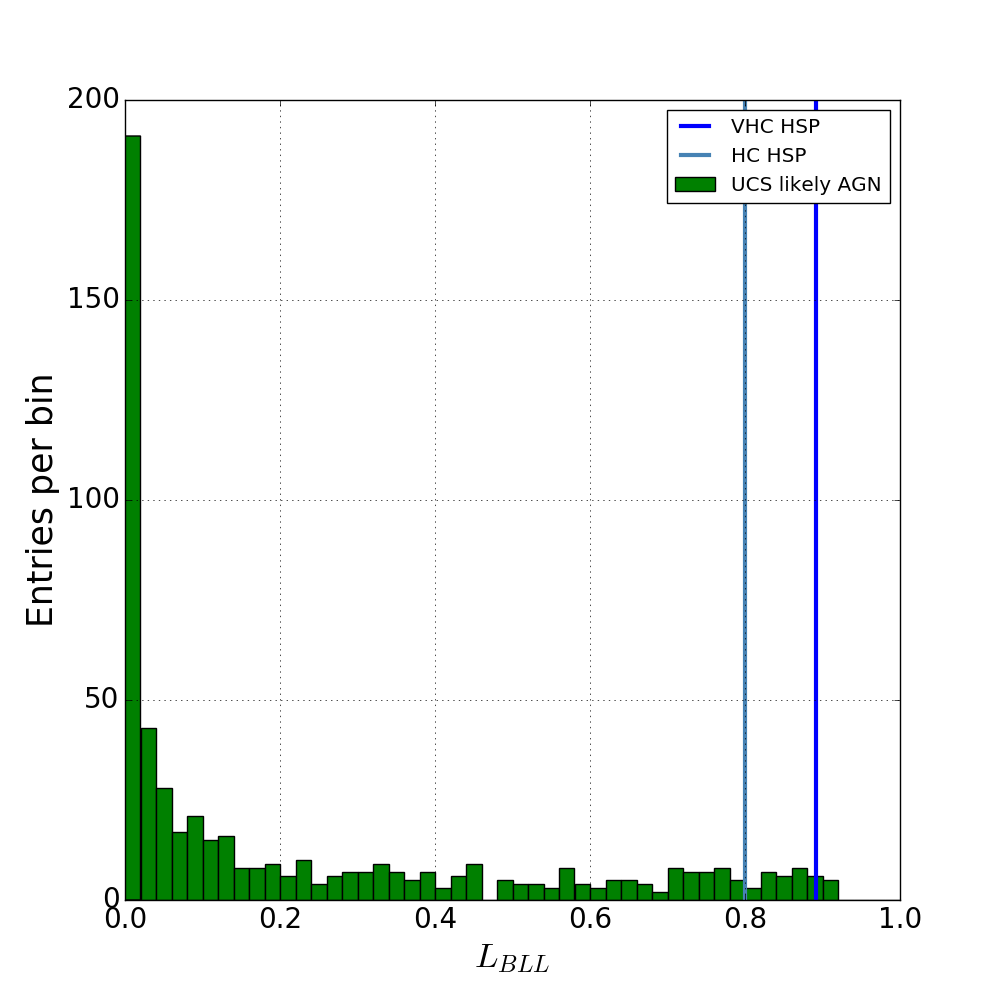
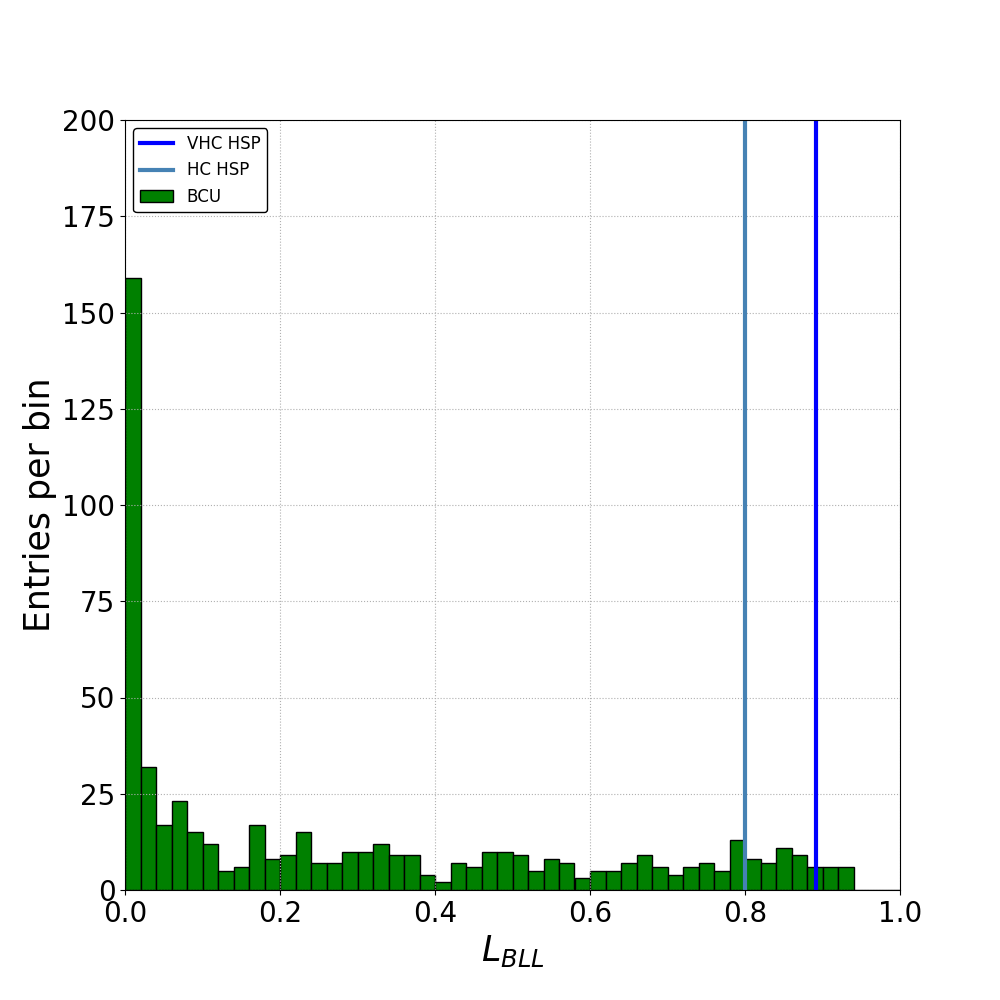
Distribution of the ANN likelihood to be HBL candidates of 3FGL BCUs. (right) and UCS_bcu (left). Vertical blue and steel blue lines indicate the applied classification thresholds to identify sources as High Confidence candidates.
---------------------------------------------------------------------------------------------------------------------------------------------------------------------------------------------------------------------------
Full list of BCU HBL candidates. In Cols. 9, 10, 11 the observabilty at the IACT sites. On the top of the list the candidates with the highest Likelihood (L> 0.89) .
| 3FGL name | Association | TS | Sp.Index | TS_var | L_hbl | RAJ2000 | DecJ2000 | HESS | VERITAS | MAGIC |
| 3FGL J0047.9+5447 | 1RXS J004754.5+544758 | 56.73 | 1.57 | 11.7 | 0.92 | 12.0160498 | 4.80784405 | X | X | |
| X 3FGL J1155.4-3417 | NVSS J115520-341718 | 147.32 | 147.32 | 16.24 | 0.92 | 178.8740215 | -34.32645279 | X | ||
| 3FGL J1434.6+6640 | 1RXS J143442.0+664031 | 73.9 | 1.58 | 16.78 | 0.92 | 218.7228694 | 66.67084133 | X | X | |
| 3FGL J0921.0-2258 | NVSS J092057-225721 | 62.51 | 62.51 | 10.5 | 0.91 | 140.2437951 | -22.94845947 | X | X | X |
| 3FGL J0648.1+1606 | 1RXS J064814.1+160708 | 40.1 | 1.81 | 13.91 | 0.90 | 102.0277929 | 16.08911409 | X | X | X |
| 3FGL J1711.6+8846 | 1RXS J171643.8+884414 | 44.3 | 1.83 | 12.4 | 0.90 | 258.6700448 | 88.75072331 | X | X | |
| 3FGL J1714.1-2029 | 1RXS J171405.2-202747 | 73.8 | 1.44 | 18.16 | 0.90 | 258.5155102 | -20.47598092 | X | X | X |
| 3FGL J1910.8+2855 | 1RXS J191053.2+285622 | 102.25 | 1.61 | 15.16 | 0.90 | 287.7132899 | 28.9403263 | X | X | X |
| 3FGL J0153.4+7114 | TXS 0149+710 | 80.86 | 1.81 | 19.72 | 0.89 | 28.42864335 | 71.25516089 | X | X | |
| 3FGL J0506.9-5435 | 1ES 0505-546 | 455.43 | 1.49 | 29.82 | 0.89 | 76.75704931 | -54.59583993 | X | X | |
| 3FGL J1944.1-4523 | 1RXS J194422.6-452326 | 100.69 | 1.63 | 11.11 | 0.89 | 296.1113217 | 45.38296215 | X | ||
| 3FGL J0742.4-8133c | SUMSS J074220-813139 | 32.29 | 2.03 | 11.8 | 0.92 | 115.4463652 | -81.53829083 | |||
| 3FGL J0040.3+4049 | B3 0037+405 | 75.94 | 1.93 | 12.02 | 0.9 | 10.08708372 | 40.83205536 | |||
| 3FGL J0043.7-1117 | 1RXS J004349.3-111612 | 69.4 | 1.91 | 12.51 | 0.88 | 10.93797337 | -11.31276512 | |||
| 3FGL J1824.4+4310 | 1RXS J182418.7+430954 | 80.91 | 1.82 | 19.74 | 0.88 | 276.1228226 | 43.17807155 | |||
| 3FGL J0528.3+1815 | 1RXS J052829.6+181657 | 35.69 | 1.67 | 14.66 | 0.87 | 82.11289303 | 18.27306451 | |||
| 3FGL J0646.4-5452 | PMN J0646-5451 | 190.34 | 1.46 | 17.37 | 0.87 | 101.6181351 | -54.91863251 | |||
| 3FGL J1959.8-4725 | SUMSS J195945-472519 | 923.79 | 1.51 | 94.31 | 0.87 | 299.9397253 | -47.42901042 | |||
| 3FGL J2108.6-8619 | 1RXS J210959.5-861853 | 91.04 | 1.65 | 10.72 | 0.87 | 316.9856579 | -86.30865936 | |||
| 3FGL J0039.0-2218 | PMN J0039-2220 | 89.34 | 1.66 | 11.61 | 0.86 | 9.766909807 | -22.31500028 | |||
| 3FGL J0305.2-1607 | PKS 0302-16 | 147.6 | 1.6 | 22.94 | 0.86 | 46.29075836 | -16.14465396 | |||
| 3FGL J1040.8+1342 | 1RXS J104057.7+134216 | 69.15 | 1.7 | 11.06 | 0.86 | 160.2594773 | 13.71799931 | |||
| 3FGL J2312.9-6923 | SUMSS J231347-692332 | 35.32 | 1.72 | 16.13 | 0.86 | 348.4026935 | -69.39020448 | |||
| 3FGL J0515.5-0123 | NVSS J051536-012427 | 45.65 | 1.79 | 11.76 | 0.85 | 78.87455087 | -1.419462214 | |||
| 3FGL J0620.4+2644 | RX J0620.6+2644 | 92.02 | 1.53 | 15.1 | 0.85 | 95.17349572 | 26.74390304 | |||
| 3FGL J0640.0-1252 | TXS 0637-128 | 174.15 | 1.52 | 14.44 | 0.85 | 100.0137646 | -12.90013415 | |||
| 3FGL J0733.5+5153 | NVSS J073326+515355 | 104.32 | 1.68 | 11.18 | 0.85 | 113.3491751 | 51.86215575 | |||
| 3FGL J1141.2+6805 | 1RXS J114118.3+680433 | 140.09 | 1.68 | 23.32 | 0.85 | 175.3295357 | 68.0822362 | |||
| 3FGL J1203.5-3925 | PMN J1203-3926 | 103.2 | 1.69 | 18.55 | 0.85 | 180.8463393 | -39.42493679 | |||
| 3FGL J1939.6-4925 | SUMSS J193946-492539 | 64.55 | 1.84 | 15.92 | 0.85 | 294.9560989 | -49.46611442 | |||
| 3FGL J2316.8-5209 | SUMSS J231701-521003 | 37.3 | 1.78 | 15.19 | 0.85 | 349.2774178 | -52.18819115 | |||
| 3FGL J0132.5-0802 | PKS 0130-083 | 71.92 | 1.87 | 12.42 | 0.84 | 23.18651181 | -8.065356912 | |||
| 3FGL J0342.6-3006 | PKS 0340-302 | 43.17 | 1.96 | 13.37 | 0.84 | 55.71024104 | -30.11480314 | |||
| 3FGL J1446.8-1831 | NVSS J144644-182922 | 27.9 | 1.7 | 8.69 | 0.84 | 221.7533056 | -18.51448366 | |||
| 3FGL J1855.1-6008 | PMN J1854-6009 | 21.39 | 1.83 | 6.74 | 0.84 | 283.672544 | -60.1250475 | |||
| 3FGL J0043.5-0444 | 1RXS J004333.7-044257 | 75.94 | 1.91 | 11.93 | 0.83 | 10.8838869 | -4.721385702 | |||
| 3FGL J0746.9+8511 | NVSS J074715+851208 | 118.95 | 1.67 | 18.34 | 0.83 | 117.2491059 | 85.21791595 | |||
| 3FGL J0650.5+2055 | 1RXS J065033.9+205603 | 206.21 | 1.72 | 20.06 | 0.82 | 102.6389899 | 20.92952844 | |||
| 3FGL J1319.6+7759 | NVSS J131921+775823 | 182.64 | 1.95 | 25.12 | 0.82 | 199.9478129 | 78.00731101 | |||
| 3FGL J1908.8-0130 | NVSS J190836-012642 | 306.43 | 2.1 | 35.5 | 0.82 | 287.2015241 | -1.527053471 | |||
| 3FGL J2347.9+5436 | NVSS J234753+543627 | 163.04 | 1.78 | 21.76 | 0.82 | 356.9713227 | 54.58170077 | |||
| 3FGL J0204.2+2420 | B2 0201+24 | 27.62 | 1.7 | 12.29 | 0.81 | 31.09102234 | 24.27132207 | |||
| 3FGL J0439.6-3159 | 1RXS J043931.4-320045 | 119.86 | 1.74 | 24.96 | 0.81 | 69.85155048 | -32.03484089 | |||
| 3FGL J1547.1-2801 | 1RXS J154711.8-280222 | 96.77 | 1.77 | 16.75 | 0.81 | 236.8077415 | -28.04443418 | |||
| 3FGL J1612.4-3100 | NVSS J161219-305937 | 494.96 | 1.86 | 116.18 | 0.81 | 243.1006458 | -30.99149787 | |||
| 3FGL J0030.2-1646 | 1RXS J003019.6-164723 | 168.7 | 1.66 | 30.18 | 0.8 | 7.586848013 | -16.82218924 | |||
| 3FGL J1158.9+0818 | RX J1158.8+0819 | 51.45 | 1.81 | 11.81 | 0.8 | 179.7088941 | 8.311328097 | |||
| 3FGL J1841.2+2910 | MG3 J184126+2910 | 195.91 | 1.79 | 22.89 | 0.8 | 280.3558247 | 29.15522239 |
--------------------------------------------------------------------------------------------------------------------------------------------------------------------------------------------------------------------------
Full list of BCU HBL candidates. In Cols. 8, 9, 10 the observabilty at the IACT sites. On the top of the list the candidates with the highest Likelihood (L> 0.89)
| 3FGL name | TS | Sp.Index | TS_var | L_hbl | RAJ2000 | DecJ2000 | HESS | VERITAS | MAGIC |
| 3FGL J2142.6-2029 | 36.07 | 1.68 | 8.19 | 0.914 | 325.6572 | -20.4955 | X | X | X |
| 3FGL J2321.6-1619 | 34.14 | 1.73 | 45.13 | 0.911 | 350.3966 | -16.3171 | X | X | X |
| 3FGL J2145.5+1007 | 52.53 | 1.70 | 19.90 | 0.906 | 326.3815 | 10.1296 | X | X | X |
| $3FGL J2300.0+4053 | 174.53 | 1.64 | 6.97 | 0.904 | 345.0583 | 40.8750 | X | X | X |
| 3FGL J2224.4+0351 | 29.5 | 1.93 | 9.55 | 0.89 | 336.1020 | 3.8590 | |||
| 3FGL J1525.8-0834 | 59.52 | 1.92 | 23.26 | 0.89 | 231.4700 | -8.5790 | |||
| 3FGL J1619.1+7538 | 107.12 | 1.86 | 14.91 | 0.88 | 244.9610 | 75.6730 | |||
| 3FGL J0251.1-1829 | 104.26 | 1.58 | 10.20 | 0.88 | 42.7970 | -18.4860 | |||
| 3FGL J0020.9+0323 | 60.66 | 2.09 | 22.50 | 0.88 | 5.2310 | 3.3950 | |||
| 3FGL J0813.5-0356 | 57.02 | 1.71 | 13.15 | 0.88 | 123.3870 | -3.9390 | |||
| 3FGL J1234.7-0437 | 51.54 | 2.00 | 29.76 | 0.87 | 188.6970 | -4.6220 | |||
| 3FGL J1922.2+2313 | 80.83 | 2.22 | 22.63 | 0.87 | 290.5650 | 23.2260 | |||
| 3FGL J2043.6+0001 | 48.48 | 2.01 | 24.43 | 0.87 | 310.9010 | 0.0290 | |||
| 3FGL J0312.7-2222 | 177.14 | 1.84 | 18.27 | 0.87 | 48.1760 | -22.3710 | |||
| 3FGL J1513.3-3719 | 54.74 | 1.91 | 18.06 | 0.87 | 228.3290 | -37.3190 | |||
| 3FGL J0524.5-6937 | 94.15 | 2.05 | 18.37 | 0.86 | 81.1280 | -69.6290 | |||
| 3FGL J1225.4-3448 | 22.27 | 1.74 | 7.01 | 0.86 | 186.3560 | -34.8070 | |||
| 3FGL J1222.7+7952 | 43.83 | 2.12 | 14.79 | 0.86 | 185.9965 | 79.8921 | |||
| 3FGL J2309.0+5428 | 77.06 | 1.75 | 17.68 | 0.85 | 347.2520 | 54.4760 | |||
| 3FGL J2015.3-1431 | 17.42 | 1.81 | 14.63 | 0.85 | 303.8543 | -14.5344 | |||
| 3FGL J2053.9+2922 | 359.63 | 1.76 | 43.97 | 0.85 | 313.4760 | 29.3740 | |||
| 3FGL J0234.2-0629 | 90.7 | 2.00 | 20.73 | 0.84 | 38.5640 | -6.1050 | |||
| 3FGL J1545.0-6641 | 150.1 | 1.59 | 11.85 | 0.84 | 236.2650 | -66.6997 | |||
| 3FGL J0731.8-3010 | 37.07 | 1.96 | 12.91 | 0.84 | 112.9740 | -30.1770 | |||
| 3FGL J0952.8+0711 | 50.96 | 1.91 | 14.12 | 0.84 | 148.2170 | 7.1990 | |||
| 3FGL J0527.3+6647 | 51.89 | 1.90 | 14.78 | 0.83 | 81.9000 | 66.7767 | |||
| 3FGL J1528.1-2904 | 26.28 | 1.80 | 11.72 | 0.83 | 232.0360 | -29.0680 | |||
| 3FGL J0049.0+4224 | 36.95 | 1.80 | 16.58 | 0.82 | 12.2530 | 42.4130 | |||
| 3FGL J1057.6-4051 | 40.23 | 1.71 | 15.54 | 0.82 | 164.4090 | -40.8620 | |||
| 3FGL J0928.3-5255 | 98.75 | 2.09 | 26.68 | 0.8 | 142.0300 | -52.8680 |
-----------------------------------------------------------------------------------------------------------------------------------------------------------------------------------------------------
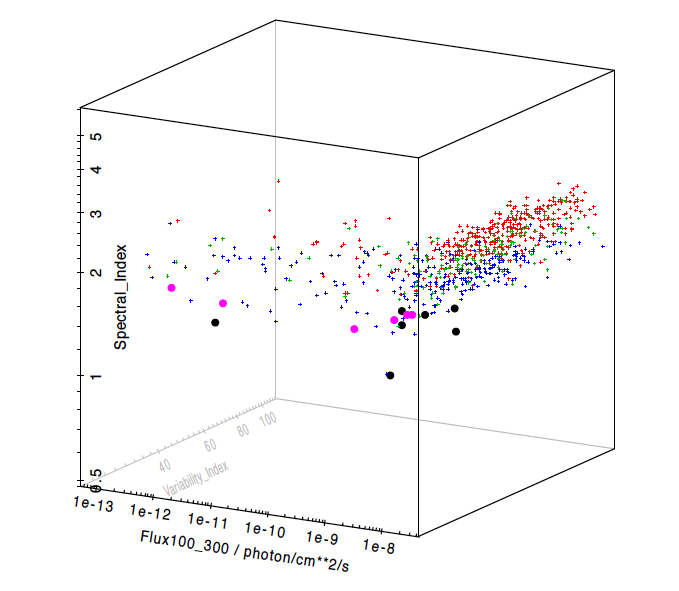
The 3D plot shows the distribution of HBL candidates against the 3FGL blazar subclasses HBL [blue], IBL [green] , LBL [ red ].
All the candidates lie in the clean HBL area validating the ANN results that classified the target as HBL sources.
TeV candidates
We compare the extrapolated fluxes of the candidates against the sensitivity of present IACTs and the future CTA. We used the Fermi-LAT spectral shape of the sources obtained in the range between 0.1 and 300 GeV using the best-fit model parameters from the LAT 4-year 3FGL Catalogue and particularly we referred to the spectral model that fits the data.
We compare the extrapolated fluxes with the CTA sensitivity for 50 hours (5hours) of observations as a solid (dashed) grey line.
Above a declination of 0 degrees we use the sensitivity of the northern array and the southern array otherwise.
The CTA sensitivity for 5 hours of observations is similar to that of currently operating IACTs for 50 hours of observations except a higher threshold energy of ~ 80 GeV.
ApJ Referee Report
Reviewer's Comments:
The identification of the gamma-ray sources that can be detected at TeV energies with the current and future slate
of Imaging Atmospheric Cherenkov Telescopes (IACTs) is an important task. The development of efficient methods
to select such TeV targets from the catalog of sources observed by the Fermi LAT instrument is a fundamental task
to maximize the scientific output of both the Fermi and IACTs telescopes and, as a consequence, improve our
understanding of the extremely energetic emission from blazars.
The manuscript "Identifying TeV Source Candidates among Fermi-LAT Unclassified Sources" presents a method
to select potential TeV targets observable by IACTS based on the variability and spectral properties of gamma-ray
sources observed by Fermi LAT instrument. A set of candidate high-synchrotron-peaked (HSPs), the spectral class
of blazars most likely to emit at TeV energies, is selected based on their reported variability by applying an already
tested machine learning technique. Among these candidates, sources which can be detected by IACTs under
reasonable assumption on the duration of the exposures are further identified by comparing their spectral energy
distributions extrapolated to TeV energies with the sensitivity curves for current and future IACTs.
The extrapolation of the SEDs of such sources are based on fitted spectral models of the candidate HSPs sources
from Fermi LAT data collected until April 2017, at the TeV energy
The paper represents a valuable contribution to the literature in this field and deserves publication once the questions and
comments below will be addressed. The manuscript is well written and clear. I would like to see the revised manuscript.
Comments
- The authors should explain why they decided to perform the extrapolation of the SED for high-confidence HSPs sources
only, i.e. with L_HSP>=0.89. Based on the estimated purity of their classification based on the validation of their machine
learning method reported at the end of Section 2, a lower L_HSPs>0.8 threshold will still produce a 75% efficiency that
would probably yield a quite large number of HSPs detectable by IACTs under the same assumptions used for the
high-confidences ones. Is this study a proof-of-concept that will be extended to the other (slightly less likely) HSPs
candidates selected with the Chiaro et al. 2016 method in a future work? Or there are more fundamental reasons
why the other sources in Table 1 and 2 were not investigated that I am missing?
- Section 2: the description of the method used to select HSPs sources from 3FGL is terse. The manuscript, as it stands,
is not self-consistent and does not provide the minimal set of information that are needed to assess the viability of
the machine learning method used to select HSPs based on their gamma-ray flaring activity. I suggest that the authors
add to this section a summary of the basics about the method described in Chiaro+2016.
- As the authors mention in the introduction, other methods have been proposed to select candidate TeV blazars that
do not use gamma-ray information, at least directly. It would be interesting to know if their list of high and low-confidence
HSPs candidates can be spatially associated to candidates HSPs from the catalogs produced by Chang et al. 2017
(2WHSP) and D'Abrusco et al. 2019 (2019ApJS..242....4D).
- In order to model the EBL attenuation, a redshift for the gamma-ray source needs to be provideds. The authors should
specify how they sampled the 0 to 0.5 interval used to obtain the two extreme behaviors, or did they just use the z=0
and z=0.5 values to determine the boundaries of the blue shaded areas between the two fitted SEDs?
- Figure 1: since the focus of the papers is on sources located in scarcely populated bins for large L_HSP, I would
suggest to use a logarithmic y scale.
- Line 136: "did we find" -> "we found"