Motivation
This tool is developed to assist in comparing results of Multilateration and Trilateration. Initially dual map approach has been used to pinpoint errors and calculate distances between the estimated results and actual locations. We are also considering a more conventional single map approach as an alternate too. This visualization will help researchers analyze the strengths and weaknesses of both algorithms and will aid in figuring out suitable conditions for each case.
Approach
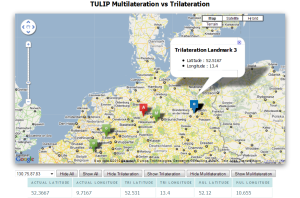
We have used Google Maps Api for plotting the results. The results are exported by a script into a csv file. The csv file has specific format (listed below). When the page is loaded a javascript function is called to parse csv file into js variables. These variables are then used to show different information all over the page. HTML file has an combo box. This combobox is populated on fly with ip addresses from the csv file. When a user selects an ip address, google map is refreshed to show Actual Location, Trilateration and Multilateration estimates with their landmarks used to pinpoint the region.
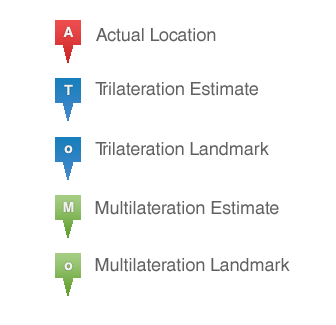
Three different color markers are used to identify each set of variable.